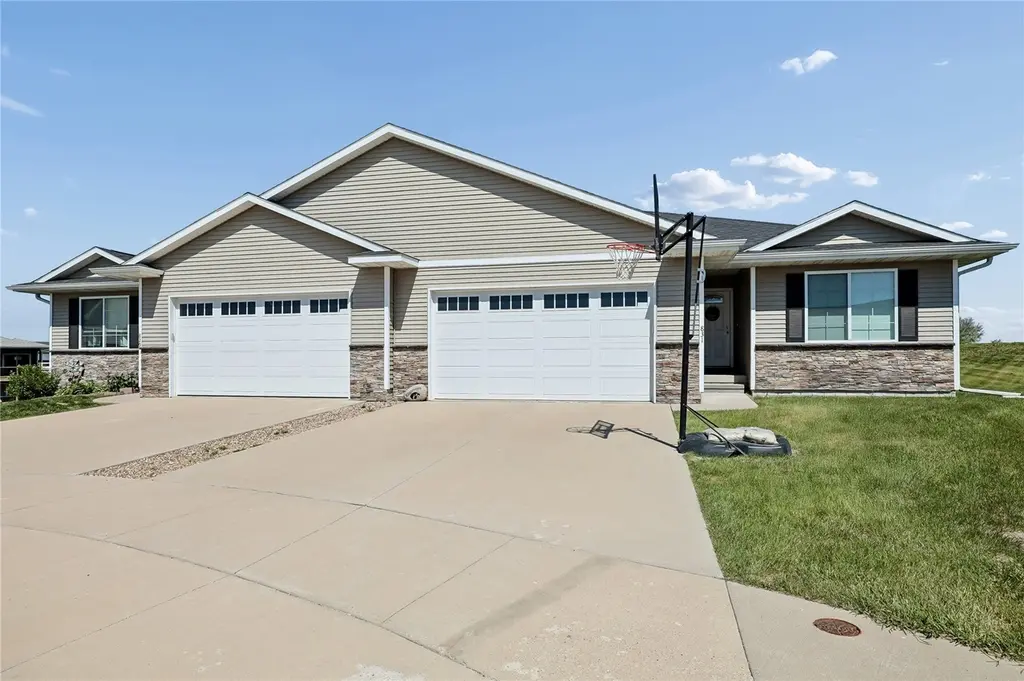
831 Heartland Ct · Fairfax, IA
Flood risk 1/10 · Minimal
- FEMA flood zone
- X (unshaded)
- Chance of flooding over 30 yrs
- 0.0%
- Est. flood insurance / yr
- $507 – $1,088
Fire risk 1/10 · Minimal
- Est. fire insurance / yr
- $902 – $1,676
Heat risk 3/10 · Minor
- Hot days now (above 102°F)
- 7 days/yr
- Hot days in 30 yrs
- 15 days/yr
Wind risk 2/10 · Minimal
- Chance of severe wind over 30 yrs
- —
Air-quality risk 2/10 · Minimal
- Unhealthy air days now
- 0 days/yr
- Unhealthy air days in 30 yrs
- 1 days/yr
Risk factors via First Street. Map © Google.
Why this score? — see what drove the D- grade
The composite is a weighted blend of 9 inputs, each scored 0–100. Each bar is that input's sub-score; the figure is the points it added to the 100-point composite (weight × sub-score).
- Appreciation +10.0/10.0
- ARV discount +7.8/15.0
- Schools +5.7/10.0
- Cash flow +4.4/30.0
- Livability +3.7/5.0
- Rent growth +2.5/5.0
- Condition / age +2.5/5.0
- 1% rule +0.8/10.0
- DSCR +0.0/10.0
$330,000
🖨 Deal sheet 📄 Offer letter ✓ Due diligence
Listing remarks
This above average home just might check all the boxes! Location- Backs up to green space, great when sitting on your covered deck! Small community yet minutes to Cedar Rapids and the interstate. Floor plan- Great open layout that flows well with spacious rooms! The finished lower level makes it nice for entertaining guests, also a great space for the entire family! Amenities- Gorgeous decor throughout, electric fireplace surrounded by built in shelves, granite counter tops, huge kitchen island, food pantry, Waynes coating, main floor laundry, heated garage, double sinks in the primary bathroom, plus so much more! The large windows bring in a lot of natural lighting! Still like new, move ri
Key facts
- $145 HOA
- 2 garage spots
- Built 2021
Property features AI
Finance
- HOA & community: Homeowners association with a $145 monthly fee
Exterior
- Parking: 2-car garage; Heated garage; Garage door opener
- Utilities: Public water; Public sewer
- Home design: Condominium (residential); One finished level above grade; Finished lower level
- Construction: Frame, stone and vinyl siding exterior; Shallow foundation (basement present)
- Exterior features: Deck; Located on a cul-de-sac
Interior
- Kitchen: Dishwasher; Gas range; Microwave; Refrigerator; Disposal; Breakfast bar (kitchen passthrough)
- Bathrooms: 3 full bathrooms
- Heating & cooling: Central air conditioning; Forced air heating; Natural gas heating; Fireplace insert
- Interior features: Breakfast bar; Vaulted ceilings; Fireplace with electric insert in the living room; Full basement
- Laundry & utility: Washer; Dryer; Gas water heater
Neighborhood map
What this means for you Summary
Snapshot
- This is a 3-bed/3.0-bath condo listed at $330k.
Deal economics
- At list price, monthly cash flow is $-862 ($-10k/yr) — negative.
- To cash-flow at today's rent, offer at most $178k (46.1% below list).
- To meet the 1% rule (rent ≥ 1% of price), the offer needs to be $192k (41.8% below list).
- Recommended offer: $178k (46.1% below list) — sets the bar for cash-flow.
- Cap rate 3.2% vs local median 2.6% in Fairfax — meaningfully above typical; check what's discounted (condition, days-on-market, listing class) to confirm the premium yield is real.
Location & tenants
- Location reads 74/100 on livability (#232 in IA, #4,402 nationally) — a middle-class / working-renter tenant base. Strengths: crime A+, employment A+, housing A+; Watch: schools C-, amenities F, commute F.
- College Community School District (urban): math 62% / reading 70% proficiency, ranked #173 of 289 in IA (top 60%) — acceptable for families but not a draw, mixed tenant base, ~2y average lease.
- Market conditions: 42 active listings in the ZIP; 1,023 units permitted in Linn County in 2024 (456 in 5+ unit buildings).
Forward outlook
- In year one you build about $35k of equity ($2k loan paydown + $33k appreciation (10.0% local appreciation)).
- Linn County population projected at +16% by 2050 — long-run rental-demand tailwind backs the buy-and-hold thesis.
- By year 2, paydown + projected appreciation supports a ~$57k cash-out refi (75% LTV) — recoverable capital for the next deal without selling this one.
Negotiation context
- It's been on market 38 days — a 3% lower offer ($320k) is reasonable based on typical stale-listing flexibility.
- 2 sale attempts since 5y ago with the ask held roughly flat each time — persistent listings suggest the price (not the market) is what's stuck; bring a comps-based counter.
- Current owner paid $263k; 25% above their basis — modest negotiation headroom, anchor on the comps not their cost.
Questions for the listing agent
- What do current leases actually rent for vs. the listed asking? Can we see a recent rent roll and the last 12 months of T-12 income?
- It's been on market 38 days. Have you received any prior offers? Is the seller open to a 46% concession, seller financing, or rate buy-down credit?
- What does the HOA fee cover, when was the last increase, and are there any pending special assessments or reserve-fund shortfalls?
- Any open or pending special assessments — roof, HVAC, plumbing, elevator, façade? What's the per-unit balance and payoff schedule, and is the seller paying it off at close or rolling it to the buyer?
- Is there a deadline driving the sale (1031 exchange, divorce, estate, relocation)? That informs how much negotiation room exists.
- The area grade is low — what's the realistic commute time and amenity access for the typical tenant pool here? Any planned neighborhood developments (good or bad) we should know about?
- What's the average days-on-market for RENTAL listings here right now (not sales)? A rising rental-DOM trend means longer vacancies and softer asking-rent achievability than the comps imply.
- What's the recent tenant-quality profile in this submarket — average credit score on applications, eviction rate, late-payment / NSF rate, and stable-employment percentage? A property-management company in the area should have these aggregated.
- How much new apartment / multifamily construction is in the pipeline within 1–3 miles? Heavy new supply (>2% of stock underway) typically softens rents 12–24 months out; light construction supports rent growth.
Investment metrics
- 1% rule
- 0.58% ✗
- Cap rate
- 3.16%
- Cash-on-cash
- -11.19%
- DSCR
- 0.50
- GRM
- 14.3
CMA / ARV
- ARV (median comp)
- $332,022
- List price
- $330,000
- Delta
- -0.61%
- Verdict
- FAIR
- Comps
- 20 within 1.0 mi
Projected returns pro-forma
10.0% appreciation · 3.0% rent growth · sell at horizon
- IRR
- 16.5%
- Equity multiple
- 2.35×
- Total profit
- $124,942
- Equity at exit
- $297,290
- IRR
- 15.7%
- Equity multiple
- 5.45×
- Total profit
- $411,266
- Equity at exit
- $641,117
Cash invested: $92,400 (down + closing). Projections, not guarantees.
Landlord ↔ Tenant lean methodology
- Overall (STATE)
- 83 Strongly Landlord-Friendly
- State Iowa
- 83 Strongly Landlord-Friendly · R+6
- County
- — inherits STATE
- City
- — inherits STATE
ZIP-level market 52228
- Home prices YoY
- 4.7%
- Active inventory
- 42
- Price-to-rent
- 14.3×
Monthly cashflow live
- Estimated rent
- $1,922 medium interval (Pro) →
- Mortgage (P&I)
- −$1,731
- Tax from tax record
- −$367 /mo · $4,402/yr
- Insurance
- −$138
- HOA
- −$145
- Vacancy / Maint / Mgmt
- −$404
- Net cashflow
- $-862
Break-even live
UW: 25.0% down · 7.5% · 30yr · 1.5% tax · 5.0% vac · 8.0% maint · 8.0% mgmt
Financing live
Cash to close
- Down payment
- $82,500
- Closing costs
- $9,900
- Reserves months
- —
- Total cash needed
- —
Loan-product check · same deal, 3 products live
Conventional
25% down · 7.5% · 30yr
- Down + closing
- —
- Monthly P&I
- —
- Monthly cashflow
- —
- DSCR
- —
- Eligible?
- —
Personal DTI + credit; lowest rate.
DSCR
20% down · 8.5% · 30yr
- Down + closing
- —
- Monthly P&I
- —
- Monthly cashflow
- —
- DSCR
- —
- Eligible?
- —
No personal income docs; deal must DSCR.
Hard money
10% down · 12.0% · 12mo
- Down + closing
- —
- Monthly P&I
- —
- Monthly cashflow
- —
- DSCR
- —
- Eligible?
- —
Short-term bridge; refi at stabilization.
HOA detail condo
- Monthly dues
- $145 · $1,740/yr
- Likely covers
- electric
- Assessments
- None detected in remarks — confirm with the listing agent.
Listing history 18 events
-
2026-06-19days on market $330,000 Active 38 DOM
-
2026-06-18days on market $330,000 Active 37 DOM
-
2026-06-17days on market $330,000 Active 36 DOM
-
2026-06-16days on market $330,000 Active 35 DOM
-
2026-06-15days on market $330,000 Active 34 DOM
-
2026-06-14days on market $330,000 Active 32 DOM
-
2026-06-13pricedays on market $330,000 Active 31 DOM
-
2026-06-10days on market $337,500 Active 29 DOM
-
2026-06-09days on market $337,500 Active 28 DOM
-
2026-06-08days on market $337,500 Active 27 DOM
-
2026-06-07days on market $337,500 Active 26 DOM
-
2026-06-02days on market $337,500 Active 21 DOM
-
2026-06-01days on market $337,500 Active 20 DOM
-
2026-05-31days on market $337,500 Active 19 DOM
-
2026-05-30days on market $337,500 Active 18 DOM
-
2026-05-12$345,000 Active 706-char remark
-
2021-10-13soldstatus $263,000
-
2021-02-23$258,900
ⓘ Source: listings_history table (triggers on properties + properties_extension) + one-shot
backfill from property_details.listing_events for pre-trigger history.
Tax reassessment forecast IA · Partial reset (capped growth)
- Current annual tax
- $4,402 · $367/mo
- Projected year-2 tax
- $4,792 · $399/mo
- Expected delta
- +$390/yr (+$32/mo · 8.8%)
ⓘ Screening estimate from a state-policy table — verify with the county assessor before closing.
Climate risk First Street
- Flood 1/10 Low FEMA zone X (unshaded) · 0% chance over 30 yrs
- Wildfire 1/10 Low
- Heat 3/10 Moderate 7 d/yr ≥102°F today · 15 d/yr by 30 yrs out
- Wind 2/10 Low
- Air quality 2/10 Low 0 unhealthy d/yr today · 1 by 30 yrs out
Nearby sold comps map
Loading sold comps map…
Walkable amenities ~0.75 mi
Loading nearby amenities…
Taxation est. · year 1
- Rental income
- $23,063
- − Mortgage interest
- −$18,485
- − Property taxes
- −$4,402
- − Insurance
- −$1,650
- − Repairs & maintenance
- −$1,845
- − Management
- −$1,845
- − HOA
- −$1,740
- − Depreciation
- −$9,600
- Taxable loss
- −$16,504
- Est. tax savings @ 24.0%
- +$3,961
- After-tax cash flow
- $-6,378/yr
For passive investors: Depreciation is non-cash, so a rental often shows a tax loss while cash-flowing — sheltering income. Rental losses are passive: they offset passive income freely, and up to $25,000/yr can offset ordinary (W-2) income if you actively participate and your MAGI is under $100k (phasing out to $0 by $150k); unused losses carry forward. On sale, claimed depreciation is recaptured at up to 25%, and gains may owe capital-gains tax (a 1031 exchange can defer both). Figures are a year-1 estimate at your 24.0% rate — not tax advice; consult a CPA.
Schools (NCES district)
- District
- College Community School District
- NCES district ID
- 1907860
- Math proficiency
- 62% ▼ -2.00%
- Reading proficiency
- 70% ▲ 2.00%
- Median HH income
- $63,575
- Composite
- 57.32/100
- National rank
- #1086
- State rank
- #173 of 289 in IA
Livability — Fairfax
- Score
- 74/100
- State rank
- #232
- US rank
- #4402
Category grades
Schools grade is shown separately in the Schools card above.
Census & demographics
- Census place
- Fairfax, IA
- Population (ZIP)
- 3,865
Population outlook (Linn County) Hauer SSP2
- Today (2025)
- 239,589 people
- By 2030
- 248,587 · +3.8%
- By 2040
- 264,817 · +10.5%
- By 2050
- 278,685 · +16.3%
- By 2075
- 311,754 · +30.1%
- By 2100
- 336,773 · +40.6%
Race, ethnicity, and origin ACS 2023
- Neighborhood character
- Predominantly White (90%)
- Race & ethnicity
- White 90% Two or more races 5% Hispanic / Latino 4% Black 2%
- Common ancestry
- Portuguese 3% Iranian 2% English 1%
- Foreign-born
- 2% · Canada
- Languages at home
- 95% English-only · Other Asian/Pacific 1% Spanish 1% French/Haitian/Cajun 1%
Political lean MEDSL · Linn
- 2024 margin
- Lean D (+9.9) · D 54.2% · R 44.3% · Other 1.4%
- 2008→2024 swing
- -11.6pp toward R · 2008: 21.5pp · 2024: 9.9pp
- All cycles
- 2024: D+9.9 2020: D+13.7 2016: D+9.0 2012: D+17.6 2008: D+21.5
Not yet ingested
- Civics
- —
Market trends
- HPI YoY
- ▲ 12.59%
- Current HPI
- 280.74
- Rent YoY
- —
- Metro
- —
- State GDP YoY
- ▲ 2.48%
- F500 in state
- 4
Industry mix (Fortune 500 HQ in IA)
| Industry | F500 HQs | Revenue |
|---|---|---|
| Financial Services | 1 | $16B |
|
||
| Retail / Convenience | 1 | $15B |
|
||
Price history
+27.5% since first listed5 events — show timeline
- 2026-06-11 Price Changed $330,000 CRAAR, CDRMLS
- 2026-05-26 Price Changed $337,500 CRAAR, CDRMLS
- 2026-05-12 Listed $345,000 CRAAR, CDRMLS
- 2021-10-13 Sold (MLS) $263,000 CRAAR, CDRMLS
- 2021-02-23 Listed $258,900 CRAAR, CDRMLS
Property tax history
+2.3%/yrLatest (2025): $4,402 · +2.3% YoY. Source: county tax records.
Cash-flow waterfall
monthlySold comps — $/sqft
last 12 mo · ≤1 miLoading sold comps…