 30-Plex
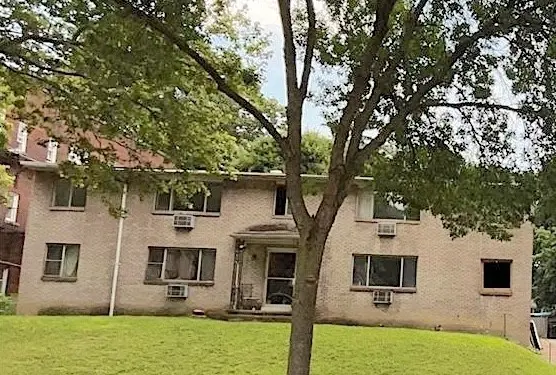
1780 Saint Paul St · Rochester, NY
Flood risk 1/10 · Minimal
- FEMA flood zone
- X (unshaded)
- Chance of flooding over 30 yrs
- 0.0%
- Est. flood insurance / yr
- $473 – $860
Fire risk 3/10 · Minor
- Est. fire insurance / yr
- $691 – $1,283
Heat risk 2/10 · Minimal
- Hot days now (above 95°F)
- 7 days/yr
- Hot days in 30 yrs
- 14 days/yr
Wind risk 1/10 · Minimal
- Chance of severe wind over 30 yrs
- —
Air-quality risk 2/10 · Minimal
- Unhealthy air days now
- 1 days/yr
- Unhealthy air days in 30 yrs
- 2 days/yr
Risk factors via First Street. Map © Google.
Why this score? — see what drove the C+ grade
The composite is a weighted blend of 9 inputs, each scored 0–100. Each bar is that input's sub-score; the figure is the points it added to the 100-point composite (weight × sub-score).
- Cash flow +30.0/30.0
- 1% rule +10.0/10.0
- DSCR +10.0/10.0
- Rent growth +4.7/5.0
- Livability +3.8/5.0
- Condition / age +2.2/5.0
- Schools +1.9/10.0
- ARV discount +0.0/15.0
- Appreciation +0.0/10.0
$1,800,000
🖨 Deal sheet (PDF) 📄 Offer letter ✓ Due diligence
Multi-family units
County records classify this as Multi-Family (5+ Unit). Listing-text estimate: 30 units. confirmed
5+ unit building — per-unit beds/baths from public records are typically unavailable; the breakdown below (if shown) is an estimate from the listing text.
Listing remarks MLS
Welcome to 1780 Saint Paul, a 30-unit apartment package that includes multiple residential buildings. This 'offered as-is' property package offers a mix of 28 one-bedroom apartments and 2 studios, with all Certificates of Occupancy in place. Monthly gross potential rent of $26,150. This investment presents a promising potential cash flow opportunity, even after accounting for estimated deferred maintenance costs. .. .. .. . Being offered ‘as is’. Sellers can NOT hold any paper. Needs some deferred maintenance. Fully rented on leases. Seller requests proof of funds and proof of financing or a bank term sheet before showings. Please allow 48 hours to schedule showings. Marketing material and rent roll available on request. .. .. .. . Trailing 12 ACTUAL expenses: Taxes $37,028; Insurance $9,898; Electric $14,016; Gas $19,428; Water $9,495; Refuse estimated $6,200. Total rents are $26,150 monthly.
Key facts
- Off street parking
- Solid financials
- 0.42 acre lot
Tags
Neighborhood map
What this means for you Summary
Snapshot
- This is a 28×1bd/1ba + 2×?bd/1ba units multifamily listed at $1.80M. Condition is rated fair.
Deal economics
- At list price, monthly cash flow is $12k ($149k/yr) — positive. Per door: $413/mo.
- The deal already cash-flows at list — no discount required.
- Meets the 1% rule at list price ($31k rent vs $1.80M).
- Recommended offer: $1.69M (6.0% below list) — sets the bar for market timing.
- Cap rate 14.5% vs local median 9.3% in Rochester — top-decile yield for the area; either an underpriced asset or a hidden risk that comps aren't pricing in. Stress-test before assuming the spread holds.
Location & tenants
- Location reads 76/100 on livability (#222 in NY, #3,482 nationally) — a middle-class / working-renter tenant base. Strengths: commute A+, cost of living A+, housing A+; Watch: crime F, employment F.
- Rochester City School District (urban): math 21% / reading 26% proficiency, ranked #589 of 590 in NY (top 100%) — low school quality limits family demand, transient renter base, plan for 1-2y turnover; 82% free/reduced lunch — lower-income household profile, screen leases tightly.
- Zoned schools: School 50-Helen Barrett Montgomery (math 2% / reading 12%, grade F, #2,087 of 2,108 statewide, top 99%, 628 students, 90% FRL); East Lower School (math 2% / reading 22%, grade F, #715 of 729 statewide, top 98%, 304 students, 86% FRL); Edison Career And Technology High School (math 44% / reading 50%, grade D-, #1,007 of 1,100 statewide, top 93%, 1,233 students, 91% FRL).
- Market conditions: Rents rising fast (+8.9%/yr); 116 active listings in the ZIP; lower-income renter base — watch delinquency; 1,169 units permitted in Monroe County in 2024 (591 in 5+ unit buildings).
- At $31,416/mo this rent would consume 1065% of the median local household income ($35k/yr) (locally 2756% of renters already pay >50% of income on rent) — very limited rent-growth headroom before tenants either downsize or default.
Forward outlook
- Local home prices are declining (-3.0%/yr); year-one equity from $12k of loan paydown is wiped out by about $54k of value loss. Plan a longer hold.
- Monroe County population projected to shrink 6% by 2050 — rents likely to lag national; underwrite the cash flow, not the appreciation.
- At projected returns (-3.0% appreciation + 8.0% rent growth), your $504k cash investment doubles in ~4 years — after that, you're playing with house money.
Negotiation context
- It's been on market 79 days — a 6% lower offer ($1.69M) is reasonable based on typical stale-listing flexibility.
- 2 sale attempts with the ask held roughly flat each time — persistent listings suggest the price (not the market) is what's stuck; bring a comps-based counter.
Questions for the listing agent
- It's been on market 79 days. Have you received any prior offers? Is the seller open to a 6% concession, seller financing, or rate buy-down credit?
- Can we see the unit-by-unit rent roll, current vacancy, and any below-market leases? What's the average tenancy length?
- What capital expenditures (roof, boiler, parking lot, exteriors) have been made in the last 5 years, and what's planned in the next 2?
- Have any recent inspections been done? Can we get a copy of the seller's disclosures and any deferred-maintenance estimates?
- Built in 1970 — when were the roof, HVAC, electrical panel, plumbing, and water heater last replaced?
- Why hasn't it sold? Are there any deal-killer items the seller is aware of (foundation, flood, title, zoning, code violations)?
- Is there a deadline driving the sale (1031 exchange, divorce, estate, relocation)? That informs how much negotiation room exists.
- Schools are D-rated, which usually means shorter tenancies and higher turnover. Who's the typical renter profile here, and what's been the actual vacancy rate?
- Crime grade is F in this area — have there been break-ins, vandalism, or insurance claims at this property in the last 3 years? What carrier currently insures it and at what premium?
- What's the average days-on-market for RENTAL listings here right now (not sales)? A rising rental-DOM trend means longer vacancies and softer asking-rent achievability than the comps imply.
- What's the recent tenant-quality profile in this submarket — average credit score on applications, eviction rate, late-payment / NSF rate, and stable-employment percentage? A property-management company in the area should have these aggregated.
- How much new apartment / multifamily construction is in the pipeline within 1–3 miles? Heavy new supply (>2% of stock underway) typically softens rents 12–24 months out; light construction supports rent growth.
Investment metrics
- 1% rule
- 1.75% ✓
- Cap rate
- 14.55%
- Cash-on-cash
- 29.47%
- DSCR
- 2.31
- GRM
- 4.8
CMA / ARV
- ARV (median comp)
- $1,444,930
- List price
- $1,800,000
- Delta
- 24.57%
- Verdict
- OVERPRICED
- Comps
- 5 within 1.0 mi
Projected returns pro-forma
-3.0% appreciation · 8.0% rent growth · sell at horizon
- IRR
- 29.5%
- Equity multiple
- 2.32×
- Total profit
- $663,264
- Equity at exit
- $268,386
- IRR
- 39.6%
- Equity multiple
- 5.66×
- Total profit
- $2,350,381
- Equity at exit
- $155,631
Cash invested: $504,000 (down + closing). Projections, not guarantees.
Landlord ↔ Tenant lean methodology
- Overall (STATE)
- 15 Strongly Tenant-Friendly
- State New York
- 15 Strongly Tenant-Friendly · D+10
- County
- — inherits STATE
- City
- — inherits STATE
ZIP-level market 14621
- Home prices YoY
- -4.0%
- Rents YoY
- 8.9%
- Active inventory
- 116
- Price-to-rent
- 142.6×
Monthly cashflow live
- Estimated rent
- $31,416 medium interval (Pro) →
- Mortgage (P&I)
- −$9,439
- Tax est. 1.5%
- −$2,250 /mo · $27,000/yr
- Insurance
- −$750
- HOA
- −$0
- Vacancy / Maint / Mgmt
- −$6,597
- Net cashflow
- $12,379
Break-even live
Sensitivity live
| Price | -10% $13,623 | -5% $13,001 | +0% $12,379 | +5% $11,757 | +10% $11,135 |
|---|---|---|---|---|---|
| Rent | -10% $9,897 | -5% $11,138 | +0% $12,379 | +5% $13,620 | +10% $14,861 |
| Rate | -1.0pp $13,286 | -0.5pp $12,837 | base $12,379 | +0.5pp $11,913 | +1.0pp $11,438 |
30-unit breakdown (identical units grouped — click to expand)
| Units | Beds | Baths | Est. rent |
|---|---|---|---|
| 28× units | 1 | 1 | $29,456 |
| #1 | 1 | 1 | $1,052 |
| #2 | 1 | 1 | $1,052 |
| #3 | 1 | 1 | $1,052 |
| #4 | 1 | 1 | $1,052 |
| #5 | 1 | 1 | $1,052 |
| #6 | 1 | 1 | $1,052 |
| #7 | 1 | 1 | $1,052 |
| #8 | 1 | 1 | $1,052 |
| #9 | 1 | 1 | $1,052 |
| #10 | 1 | 1 | $1,052 |
| #11 | 1 | 1 | $1,052 |
| #12 | 1 | 1 | $1,052 |
| #13 | 1 | 1 | $1,052 |
| #14 | 1 | 1 | $1,052 |
| #15 | 1 | 1 | $1,052 |
| #16 | 1 | 1 | $1,052 |
| #17 | 1 | 1 | $1,052 |
| #18 | 1 | 1 | $1,052 |
| #19 | 1 | 1 | $1,052 |
| #20 | 1 | 1 | $1,052 |
| #21 | 1 | 1 | $1,052 |
| #22 | 1 | 1 | $1,052 |
| #23 | 1 | 1 | $1,052 |
| #24 | 1 | 1 | $1,052 |
| #25 | 1 | 1 | $1,052 |
| #26 | 1 | 1 | $1,052 |
| #27 | 1 | 1 | $1,052 |
| #28 | 1 | 1 | $1,052 |
| 2× units | 0 | 1 | $1,958 |
| #29 | 0 | 1 | $979 |
| #30 | 0 | 1 | $979 |
| Total (30 units) | $31,416 | ||
UW: 25.0% down · 7.5% · 30yr · 1.5% tax · 5.0% vac · 8.0% maint · 8.0% mgmt
Financing live
Cash to close
- Down payment
- $450,000
- Closing costs
- $54,000
- Reserves months
- —
- Total cash needed
- —
Loan-product check · same deal, 3 products live
Conventional
25% down · 7.5% · 30yr
- Down + closing
- —
- Monthly P&I
- —
- Monthly cashflow
- —
- DSCR
- —
- Eligible?
- —
Personal DTI + credit; lowest rate.
DSCR
20% down · 8.5% · 30yr
- Down + closing
- —
- Monthly P&I
- —
- Monthly cashflow
- —
- DSCR
- —
- Eligible?
- —
No personal income docs; deal must DSCR.
Hard money
10% down · 12.0% · 12mo
- Down + closing
- —
- Monthly P&I
- —
- Monthly cashflow
- —
- DSCR
- —
- Eligible?
- —
Short-term bridge; refi at stabilization.
Listing history 18 events
-
2026-06-21days on market $1,800,000 Active 79 DOM
-
2026-06-18days on market $1,800,000 Active 76 DOM
-
2026-06-17days on market $1,800,000 Active 75 DOM
-
2026-06-16days on market $1,800,000 Active 74 DOM
-
2026-06-15days on market $1,800,000 Active 73 DOM
-
2026-06-13days on market $1,800,000 Active 71 DOM
-
2026-06-13days on market $1,800,000 Active 70 DOM
-
2026-06-10days on market $1,800,000 Active 68 DOM
-
2026-06-09days on market $1,800,000 Active 67 DOM
-
2026-06-09days on market $1,800,000 Active 66 DOM
-
2026-06-07days on market $1,800,000 Active 65 DOM
-
2026-06-05days on market $1,800,000 Active 62 DOM
-
2026-06-03days on market $1,800,000 Active 61 DOM
-
2026-06-03days on market $1,800,000 Active 60 DOM
-
2026-06-01days on market $1,800,000 Active 59 DOM
-
2026-05-31days on market $1,800,000 Active 58 DOM
-
2026-05-15status Active 925-char remark
Show marketing remark (925 chars)
Welcome to 1780 Saint Paul, a 30-unit apartment package that includes multiple residential buildings. This 'offered as-is' property package offers a mix of 28 one-bedroom apartments and 2 studios, with all Certificates of Occupancy in place. Monthly gross potential rent of $26,150. This investment presents a promising potential cash flow opportunity, even after accounting for estimated deferred maintenance costs. .. .. .. . Being offered ‘as is’. Sellers can NOT hold any paper. Needs some deferred maintenance. Fully rented on leases. Seller requests proof of funds and proof of financing or a bank term sheet before showings. Please allow 48 hours to schedule showings. Marketing material and rent roll available on request. .. .. .. . Trailing 12 ACTUAL expenses: Taxes $37,028; Insurance $9,898; Electric $14,016; Gas $19,428; Water $9,495; Refuse estimated $6,200. Total rents are $26,150 monthly.
-
2026-03-24$1,800,000 Active 925-char remark
Show marketing remark (925 chars)
Welcome to 1780 Saint Paul, a 30-unit apartment package that includes multiple residential buildings. This 'offered as-is' property package offers a mix of 28 one-bedroom apartments and 2 studios, with all Certificates of Occupancy in place. Monthly gross potential rent of $26,150. This investment presents a promising potential cash flow opportunity, even after accounting for estimated deferred maintenance costs. .. .. .. . Being offered ‘as is’. Sellers can NOT hold any paper. Needs some deferred maintenance. Fully rented on leases. Seller requests proof of funds and proof of financing or a bank term sheet before showings. Please allow 48 hours to schedule showings. Marketing material and rent roll available on request. .. .. .. . Trailing 12 ACTUAL expenses: Taxes $37,028; Insurance $9,898; Electric $14,016; Gas $19,428; Water $9,495; Refuse estimated $6,200. Total rents are $26,150 monthly.
ⓘ Source: listings_history table (triggers on properties + properties_extension) + one-shot
backfill from property_details.listing_events for pre-trigger history.
Climate risk First Street
- Flood 1/10 Low FEMA zone X (unshaded) · 0% chance over 30 yrs
- Wildfire 3/10 Moderate
- Heat 2/10 Low 7 d/yr ≥95°F today · 14 d/yr by 30 yrs out
- Wind 1/10 Low
- Air quality 2/10 Low 1 unhealthy d/yr today · 2 by 30 yrs out
Nearby sold comps map
Loading sold comps map…
Walkable amenities ~0.75 mi
Loading nearby amenities…
Taxation est. · year 1
- Rental income
- $376,992
- − Mortgage interest
- −$100,828
- − Property taxes
- −$27,000
- − Insurance
- −$9,000
- − Repairs & maintenance
- −$30,159
- − Management
- −$30,159
- − Depreciation
- −$52,364
- Taxable income
- $127,482
- Est. tax owed @ 24.0%
- −$30,596
- After-tax cash flow
- $117,955/yr
For passive investors: Depreciation is non-cash, so a rental often shows a tax loss while cash-flowing — sheltering income. Rental losses are passive: they offset passive income freely, and up to $25,000/yr can offset ordinary (W-2) income if you actively participate and your MAGI is under $100k (phasing out to $0 by $150k); unused losses carry forward. On sale, claimed depreciation is recaptured at up to 25%, and gains may owe capital-gains tax (a 1031 exchange can defer both). Figures are a year-1 estimate at your 24.0% rate — not tax advice; consult a CPA.
Condition & rehab AI · 1 photo
This 30-unit multi-family property requires moderate repairs and maintenance, particularly to the exterior and interior walls, to improve its condition and value.
Repairs flagged
- Moderate exterior walls — Weathered and discolored
- Minor interior walls — Some discoloration
Value-add opportunities
- Both paint exterior and interior walls — Enhances curb appeal and interior aesthetics
- Both repair and paint roof — Improves appearance and structural integrity
Renovation cost estimate screening
| Repair item | Severity | Est. cost |
|---|---|---|
| exterior walls · Weathered and discolored | Moderate | $3,000–15,000 |
| interior walls · Some discoloration | Minor | $500–3,000 |
| Total estimated repair cost · 2 items | $3,500–18,000 |
Value-add ROI direction
- Both paint exterior and interior walls — Enhances curb appeal and interior aesthetics ↑
- Both repair and paint roof — Improves appearance and structural integrity ↑
ⓘ Cost ranges are severity-bucket heuristics (US national rule-of-thumb). Get contractor quotes + a written scope before underwriting a rehab budget.
Schools (NCES district)
- District
- Rochester City School District
- NCES district ID
- 3624750
- Math proficiency
- 21% ▬ 0.00%
- Reading proficiency
- 26% ▲ 4.00%
- Median HH income
- $30,923
- Composite
- 18.98/100
- National rank
- #8850
- State rank
- #589 of 590 in NY
Livability — Rochester
- Score
- 76/100
- State rank
- #222
- US rank
- #3482
Category grades
Schools grade is shown separately in the Schools card above.
Census & demographics
- Census place
- Rochester, NY
- County
- Monroe County · 674,131 people
- City population
- 432,803
- Metro
- Rochester, NY
- Population (ZIP)
- 32,381
- Household income
- $35,383
- Rent vs Own
- Severe rent burden
- 2756.0
Population outlook (Monroe County) Hauer SSP2
- Today (2025)
- 759,460 people
- By 2030
- 757,154 · -0.3%
- By 2040
- 740,644 · -2.5%
- By 2050
- 714,443 · -5.9%
- By 2075
- 645,883 · -15.0%
- By 2100
- 547,084 · -28.0%
Race, ethnicity, and origin ACS 2023
- Neighborhood character
- Diverse neighborhood (Simpson 0.66)
- Race & ethnicity
- Hispanic / Latino 40% Black 40% White 14% Two or more races 12% Asian 1%
- Hispanic origin (detail)
- Mexican 1% Puerto Rican 32% Dominican 3%
- Common ancestry
- Romanian 1% Lithuanian 1% Serbian 1%
- Foreign-born
- 8% · Canada, Jamaica
- Languages at home
- 65% English-only · Spanish 30% Other Asian/Pacific 2% French/Haitian/Cajun 1%
Political lean MEDSL · Monroe
- 2024 margin
- D (+19.1) · D 59.5% · R 40.5%
- 2008→2024 swing
- +1.4pp toward D · 2008: 17.7pp · 2024: 19.1pp
- All cycles
- 2024: D+19.1 2020: D+21.0 2016: D+14.1 2012: D+17.4 2008: D+17.7
Not yet ingested
- Civics
- —
Market trends
- HPI YoY
- ▼ -10.66%
- Current HPI
- 254.1805
- Rent YoY
- ▲ 8.88%
- Metro
- Rochester, NY
- State GDP YoY
- ▲ 2.60%
- F500 in state
- 92
Industry mix (Fortune 500 HQ in NY)
| Industry | F500 HQs | Revenue |
|---|---|---|
| Financial Services | 10 | $950B |
|
||
| Consumer Goods | 9 | $162B |
|
||
| Insurance | 4 | $225B |
|
||
| Telecommunications | 2 | $144B |
|
||
| Pharmaceuticals | 2 | $112B |
|
||
| Media / Entertainment | 2 | $69B |
|
||
Price history
2 events — show timeline
- 2026-05-15 Relisted — UNYREIS
- 2026-03-24 Listed $1,800,000 UNYREIS
Cash-flow waterfall
monthlySold comps — $/sqft
last 12 mo · ≤1 miLoading sold comps…