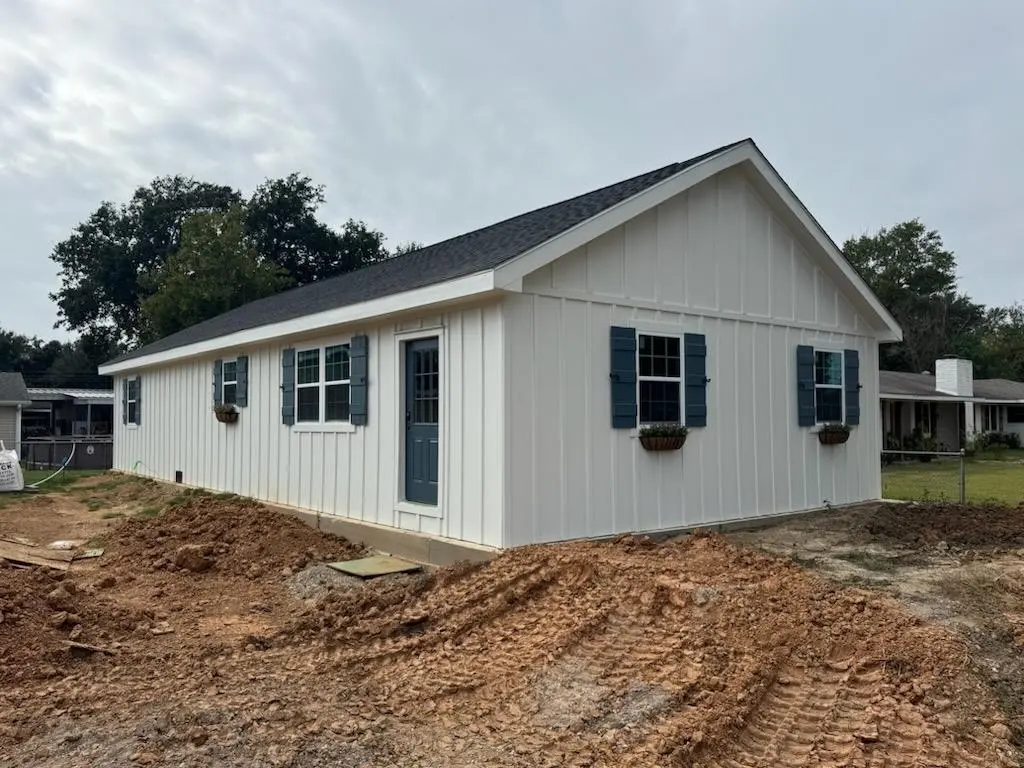
401 Glover St · Lake Charles, LA
Flood risk 5/10 · Moderate
- FEMA flood zone
- AE
- Chance of flooding over 30 yrs
- 0.48%
- Est. flood insurance / yr
- $1,737 – $8,500
Fire risk 1/10 · Minimal
- Est. fire insurance / yr
- $1,269 – $2,357
Heat risk 9/10 · Severe
- Hot days now (above 109°F)
- 7 days/yr
- Hot days in 30 yrs
- 21 days/yr
Wind risk 9/10 · Severe
- Chance of severe wind over 30 yrs
- 99.0%
Air-quality risk 2/10 · Minimal
- Unhealthy air days now
- 1 days/yr
- Unhealthy air days in 30 yrs
- 1 days/yr
Risk factors via First Street. Map © Google.
Why this score? — see what drove the B- grade
The composite is a weighted blend of 9 inputs, each scored 0–100. Each bar is that input's sub-score; the figure is the points it added to the 100-point composite (weight × sub-score).
- Cash flow +26.2/30.0
- ARV discount +15.0/15.0
- DSCR +8.9/10.0
- 1% rule +5.7/10.0
- Rent growth +5.0/5.0
- Livability +3.4/5.0
- Schools +3.1/10.0
- Condition / age +2.5/5.0
- Appreciation +0.0/10.0
$134,000
🖨 Deal sheet (PDF) 📄 Offer letter ✓ Due diligence
Listing remarks MLS
Brand-new build measuring 56x26 with modified plans completed during construction, offering an estimated 1,456 sq ft of living space. Home features 2x4 framing, Zip sheathing, Hardie siding, custom shutters, and sits 3 inches above BFE + 1 ft. Roof system includes 2x8 framing, 3/4” decking, Titanium UDL 25 underlayment, and new Tamko Titan shingles. House pad, subfloor, and framing treated with Fipronil for termite prevention. A Pex-A main water line is already run through the slab and protected inside a plastic sleeve for safe distribution throughout the home. Interior is unfinished—needs HVAC, plumbing, electrical, interior walls, and finishes, providing full customization. Property may be subdivided with city approval and meets setback requirements. Elevation certificate & plans available. Ideal investment opportunity or perfect for buyers wanting to finish their own home. Elevation Certificate and House Plans available.
Key facts
- Zip system sheathing
- Custom shutters
- Hardie siding
Tags
Neighborhood map
What this means for you Summary
Snapshot
- This is a 3-bed/2.0-bath land listed at $134k.
Deal economics
- At list price, monthly cash flow is $-84 ($-1k/yr) — negative.
- To cash-flow at today's rent, offer at most $119k (11.0% below list).
- Meets the 1% rule at list price ($1k rent vs $134k).
- Recommended offer: $118k (12.0% below list) — sets the bar for market timing.
- Cap rate 9.4% vs local median 4.3% in Lake Charles — top-decile yield for the area; either an underpriced asset or a hidden risk that comps aren't pricing in. Stress-test before assuming the spread holds.
Location & tenants
- Location reads 68/100 on livability (#95 in LA) — a middle-class / working-renter tenant base. Strengths: commute A+, cost of living A+, housing A+; Watch: crime F, amenities F, employment D-.
- Calcasieu Parish (other): math 30% / reading 44% proficiency, ranked #29 of 98 in LA (top 30%) — families likely to look elsewhere, expect single-tenant / working-renter base with shorter leases.
- Zoned schools: Dolby Elementary School (math 42% / reading 62%, grade C-, #108 of 646 statewide, top 18%, 381 students, 64% FRL); F. K. White Middle School (math 26% / reading 39%, grade F, #104 of 218 statewide, top 48%, 661 students, 67% FRL); Alfred M. Barbe High School (math 41% / reading 56%, grade D, #41 of 265 statewide, top 16%, 1,991 students, 41% FRL) — zoned schools at 57% FRL track the district average.
- Market conditions: Rents rising fast (+15.1%/yr); 464 active listings in the ZIP; 15 comparable units currently listed for rent nearby; rentals at typical pace (median 23d on market — plan ~3-4 weeks tenant-placement turnaround); 40% of comp listings sitting > 30 days — soft ceiling on asking rent; solid renter incomes; 1,298 units permitted in Calcasieu Parish in 2024 (526 in 5+ unit buildings).
Forward outlook
- Local home prices are declining (-3.0%/yr); year-one equity from $926 of loan paydown is wiped out by about $4k of value loss. Plan a longer hold.
- Calcasieu County population projected at +11% by 2050 — modest demand growth; plan on rents tracking national, not racing it.
Negotiation context
- It's been on market 182 days — a 12% lower offer ($118k) is reasonable based on typical stale-listing flexibility.
- Current owner paid $39k; list at $134k implies a 244% gain — meaningful room to come down on a strong offer.
Risks & watch-outs
- Watch-outs: flood insurance adds $427/mo.
- Climate carrying-cost: in FEMA flood zone AE (mandatory federal flood insurance); severe wind risk, 99% chance of damaging wind over 30y; extreme-heat days projected 7→21/yr by 2055 (HVAC capex compounding) — expect insurance premiums to compound above CPI over the hold.
Questions for the listing agent
- What do current leases actually rent for vs. the listed asking? Can we see a recent rent roll and the last 12 months of T-12 income?
- It's been on market 182 days. Have you received any prior offers? Is the seller open to a 12% concession, seller financing, or rate buy-down credit?
- What's the actual annual flood-insurance premium (NFIP or private), and is the property in a SFHA with mandatory coverage?
- Why hasn't it sold? Are there any deal-killer items the seller is aware of (foundation, flood, title, zoning, code violations)?
- Is there a deadline driving the sale (1031 exchange, divorce, estate, relocation)? That informs how much negotiation room exists.
- Schools are B-rated — typically a magnet for longer-tenancy family renters. What's the average tenant stay here, and is there a school-zone premium baked into asking?
- Crime grade is F in this area — have there been break-ins, vandalism, or insurance claims at this property in the last 3 years? What carrier currently insures it and at what premium?
- What's the average days-on-market for RENTAL listings here right now (not sales)? A rising rental-DOM trend means longer vacancies and softer asking-rent achievability than the comps imply.
- What's the recent tenant-quality profile in this submarket — average credit score on applications, eviction rate, late-payment / NSF rate, and stable-employment percentage? A property-management company in the area should have these aggregated.
- How much new for-sale + rental construction is in the pipeline within 1–3 miles? Heavy new supply typically softens prices + rents 12–24 months out; constrained supply supports both.
Investment metrics
- 1% rule
- 1.07% ✓
- Cap rate
- 9.36%
- Cash-on-cash
- 10.96%
- DSCR
- 1.49
- GRM
- 7.8
CMA / ARV
- ARV (median comp)
- $178,912
- List price
- $134,000
- Delta
- -25.10%
- Verdict
- UNDERPRICED
- Comps
- 2 within 2.0 mi
Projected returns pro-forma
-3.0% appreciation · 8.0% rent growth · sell at horizon
- IRR
- -13.5%
- Equity multiple
- 0.49×
- Total profit
- $-19,289
- Equity at exit
- $19,980
- IRR
- 3.3%
- Equity multiple
- 1.31×
- Total profit
- $11,566
- Equity at exit
- $11,586
Cash invested: $37,520 (down + closing). Projections, not guarantees.
Landlord ↔ Tenant lean methodology
- Overall (STATE)
- 90 Strongly Landlord-Friendly
- State Louisiana
- 90 Strongly Landlord-Friendly · R+12
- County
- — inherits STATE
- City
- — inherits STATE
ZIP-level market 70605
- Rents YoY
- 15.1%
- Active inventory
- 464
- Price-to-rent
- 7.8×
Monthly cashflow live
- Estimated rent
- $1,431 high interval (Pro) →
- Mortgage (P&I)
- −$703
- Tax from tax record
- −$29 /mo · $354/yr
- Insurance
- −$56
- Flood insurance flood zone
- −$427 /mo · $5,118/yr
- HOA
- −$0
- Vacancy / Maint / Mgmt
- −$301
- Net cashflow
- $-84
Break-even live
Sensitivity live
| Price | -10% $-8 | -5% $-46 | +0% $-84 | +5% $-122 | +10% $-160 |
|---|---|---|---|---|---|
| Rent | -10% $-197 | -5% $-140 | +0% $-84 | +5% $-27 | +10% $29 |
| Rate | -1.0pp $-16 | -0.5pp $-50 | base $-84 | +0.5pp $-119 | +1.0pp $-154 |
UW: 25.0% down · 7.5% · 30yr · 1.5% tax · 5.0% vac · 8.0% maint · 8.0% mgmt
Financing live
Cash to close
- Down payment
- $33,500
- Closing costs
- $4,020
- Reserves months
- —
- Total cash needed
- —
Loan-product check · same deal, 3 products live
Conventional
25% down · 7.5% · 30yr
- Down + closing
- —
- Monthly P&I
- —
- Monthly cashflow
- —
- DSCR
- —
- Eligible?
- —
Personal DTI + credit; lowest rate.
DSCR
20% down · 8.5% · 30yr
- Down + closing
- —
- Monthly P&I
- —
- Monthly cashflow
- —
- DSCR
- —
- Eligible?
- —
No personal income docs; deal must DSCR.
Hard money
10% down · 12.0% · 12mo
- Down + closing
- —
- Monthly P&I
- —
- Monthly cashflow
- —
- DSCR
- —
- Eligible?
- —
Short-term bridge; refi at stabilization.
Rent comps 15 comps
| Address | Beds | Baths | Sqft | Rent | $/sqft | DOM | Units | Dist |
|---|---|---|---|---|---|---|---|---|
| 155 Heather St Lake Charles, LA | 3.0 | 2.0 | 1316 | $1,650 | $1.25 | 14d | 1 | 0.72mi |
| 615 Cusic St Unit 615-1 Lake Charles, LA | 2.0 | 1.5 | 950 | $1,200 | $1.26 | 14d | 1 | 0.73mi |
| 617 Cusic St Unit 617-1 Lake Charles, LA | 2.0 | 1.5 | 1000 | $1,200 | $1.20 | 14d | 1 | 0.74mi |
| 5014 Desoto St Apt C Lake Charles, LA | 2.0 | 2.0 | 962 | $1,175 | $1.22 | 14d | 1 | 0.96mi |
| 5018 Desoto St Apt C Lake Charles, LA | 2.0 | 2.0 | 962 | $1,175 | $1.22 | 45d | 1 | 0.97mi |
| 417 E Claude St Lake Charles, LA | 4.0 | 1.0 | 1610 | $1,400 | $0.87 | 45d | 1 | 1.04mi |
| 4326 Christina St Lake Charles, LA | 3.0 | 2.0 | 1600 | $1,770 | $1.11 | 22d | 1 | 1.07mi |
| 3715 Common St Unit B1 Lake Charles, LA | 2.0 | 2.0 | 900 | $1,395 | $1.55 | 14d | 1 | 1.20mi |
| 801 Sundale Dr Lake Charles, LA | 3.0 | 1.0 | 1144 | $1,195 | $1.04 | 45d | 1 | 1.29mi |
| 617 E School St Unit A Lake Charles, LA | 3.0 | 2.0 | 1800 | $2,500 | $1.39 | 45d | 1 | 1.30mi |
| 422 W Lagrange St Lake Charles, LA | 2.0 | 2.0 | 995 | $1,050 | $1.06 | 45d | 1 | 1.39mi |
| 114 W Lagrange St Apt 18 Lake Charles, LA | 2.0 | 1.0 | 1200 | $1,300 | $1.08 | 22d | 1 | 1.40mi |
| 3506 Common St Unit 11 Lake Charles, LA | 2.0 | 1.0 | 910 | $950 | $1.04 | 14d | 1 | 1.41mi |
| 1032 Link Rd Unit B Lake Charles, LA | 2.0 | 1.0 | 1000 | $1,195 | $1.20 | 14d | 1 | 1.42mi |
| 1711 Mignonette Ln Unit 13-C Lake Charles, LA | 2.0 | 1.5 | 1275 | $1,095 | $0.86 | 45d | 1 | 1.49mi |
Listing history 7 events
-
2026-06-01days on market $134,000 Active 182 DOM
-
2026-05-31days on market $134,000 Active 181 DOM
-
2026-05-30days on market $134,000 Active 180 DOM
-
2026-01-12price $134,000 955-char remark
Show marketing remark (955 chars)
Brand-new build measuring 56x26 with modified plans completed during construction, offering an estimated 1,456 sq ft of living space. Home features 2x4 framing, Zip sheathing, Hardie siding, custom shutters, and sits 3 inches above BFE + 1 ft. Roof system includes 2x8 framing, 3/4” decking, Titanium UDL 25 underlayment, and new Tamko Titan shingles. House pad, subfloor, and framing treated with Fipronil for termite prevention. A Pex-A main water line is already run through the slab and protected inside a plastic sleeve for safe distribution throughout the home. Interior is unfinished—needs HVAC, plumbing, electrical, interior walls, and finishes, providing full customization. Property may be subdivided with city approval and meets setback requirements. Elevation certificate & plans available. Ideal investment opportunity or perfect for buyers wanting to finish their own home. Elevation Certificate and House Plans available.
-
2025-12-01$139,000 Active 955-char remark
Show marketing remark (955 chars)
Brand-new build measuring 56x26 with modified plans completed during construction, offering an estimated 1,456 sq ft of living space. Home features 2x4 framing, Zip sheathing, Hardie siding, custom shutters, and sits 3 inches above BFE + 1 ft. Roof system includes 2x8 framing, 3/4” decking, Titanium UDL 25 underlayment, and new Tamko Titan shingles. House pad, subfloor, and framing treated with Fipronil for termite prevention. A Pex-A main water line is already run through the slab and protected inside a plastic sleeve for safe distribution throughout the home. Interior is unfinished—needs HVAC, plumbing, electrical, interior walls, and finishes, providing full customization. Property may be subdivided with city approval and meets setback requirements. Elevation certificate & plans available. Ideal investment opportunity or perfect for buyers wanting to finish their own home. Elevation Certificate and House Plans available.
-
2025-04-04soldstatus $39,000
-
2014-02-20soldstatus $35,000
ⓘ Source: listings_history table (triggers on properties + properties_extension) + one-shot
backfill from property_details.listing_events for pre-trigger history.
Tax reassessment forecast LA · Resets to sale price
- Current annual tax
- $354 · $29/mo
- Projected year-2 tax
- $737 · $61/mo
- Expected delta
- +$383/yr (+$32/mo · 108.4%)
ⓘ Screening estimate from a state-policy table — verify with the county assessor before closing.
Climate risk First Street
- Flood 5/10 Major FEMA zone AE · 48% chance over 30 yrs
- Wildfire 1/10 Low
- Heat 9/10 Extreme 7 d/yr ≥109°F today · 21 d/yr by 30 yrs out
- Wind 9/10 Extreme 99% chance of damaging wind over 30 yrs
- Air quality 2/10 Low 1 unhealthy d/yr today · 1 by 30 yrs out
Nearby sold comps map
Loading sold comps map…
Walkable amenities ~0.75 mi
Loading nearby amenities…
Taxation est. · year 1
- Rental income
- $17,176
- − Mortgage interest
- −$7,506
- − Property taxes
- −$354
- − Insurance
- −$5,788
- − Repairs & maintenance
- −$1,374
- − Management
- −$1,374
- − Depreciation
- −$3,898
- Taxable loss
- −$3,119
- Est. tax savings @ 24.0%
- +$748
- After-tax cash flow
- $-257/yr
For passive investors: Depreciation is non-cash, so a rental often shows a tax loss while cash-flowing — sheltering income. Rental losses are passive: they offset passive income freely, and up to $25,000/yr can offset ordinary (W-2) income if you actively participate and your MAGI is under $100k (phasing out to $0 by $150k); unused losses carry forward. On sale, claimed depreciation is recaptured at up to 25%, and gains may owe capital-gains tax (a 1031 exchange can defer both). Figures are a year-1 estimate at your 24.0% rate — not tax advice; consult a CPA.
Schools (NCES district)
- District
- Calcasieu Parish
- NCES district ID
- 2200330
- Math proficiency
- 30% ▼ -39.00%
- Reading proficiency
- 44% ▼ -33.00%
- Median HH income
- $44,700
- Composite
- 31.45/100
- National rank
- #5979
- State rank
- #29 of 98 in LA
Livability — Lake Charles
- Score
- 68/100
- State rank
- #95
- US rank
- #9820
Category grades
Schools grade is shown separately in the Schools card above.
Census & demographics
- Census place
- Lake Charles, LA
- County
- Calcasieu Parish · 170,889 people
- City population
- 133,538
- Metro
- Lake Charles, LA
- Population (ZIP)
- 40,482
- Household income
- $86,015
- Rent vs Own
- Severe rent burden
- 1328.0
Population outlook (Calcasieu County) Hauer SSP2
- Today (2025)
- 212,179 people
- By 2030
- 218,199 · +2.8%
- By 2040
- 228,486 · +7.7%
- By 2050
- 236,208 · +11.3%
- By 2075
- 251,696 · +18.6%
- By 2100
- 247,848 · +16.8%
Race, ethnicity, and origin ACS 2023
- Neighborhood character
- Predominantly White (79%)
- Race & ethnicity
- White 79% Black 10% Hispanic / Latino 6% Two or more races 6% Asian 3%
- Hispanic origin (detail)
- Mexican 2%
- Common ancestry
- Lithuanian 12% Italian 3% Slovak 2%
- Foreign-born
- 6% · Canada, Jamaica
- Languages at home
- 92% English-only · Spanish 4% Other Indo-European 2% Other Asian/Pacific 1%
Political lean MEDSL · Calcasieu
- 2024 margin
- Solid R (+39.6) · D 29.5% · R 69.0% · Other 1.5%
- 2008→2024 swing
- -15.0pp toward R · 2008: -24.6pp · 2024: -39.6pp
- All cycles
- 2024: R+39.6 2020: R+35.2 2016: R+33.3 2012: R+28.7 2008: R+24.6
Not yet ingested
- Civics
- —
Market trends
- HPI YoY
- ▼ -102.68%
- Current HPI
- 105.1903
- Rent YoY
- ▲ 15.10%
- Metro
- Lake Charles, LA
- State GDP YoY
- ▲ 3.29%
- F500 in state
- 10
Industry mix (Fortune 500 HQ in LA)
| Industry | F500 HQs | Revenue |
|---|---|---|
| Telecommunications | 2 | $23B |
|
||
| Utilities | 1 | $12B |
|
||
| Wholesale / Distribution | 1 | $5B |
|
||
| Advertising | 1 | $2B |
|
||
Price history
+282.9% since first listed4 events — show timeline
- 2026-01-12 Price Changed $134,000 SWLAR
- 2025-12-01 Listed $139,000 SWLAR
- 2025-04-04 Sold (Public Records) $39,000 Public Records
- 2014-02-20 Sold (Public Records) $35,000 Public Records
Property tax history
+0.7%/yrLatest (2025): $354 · +2.5% YoY. Source: county tax records.
Cash-flow waterfall
monthlySold comps — $/sqft
last 12 mo · ≤1 miLoading sold comps…