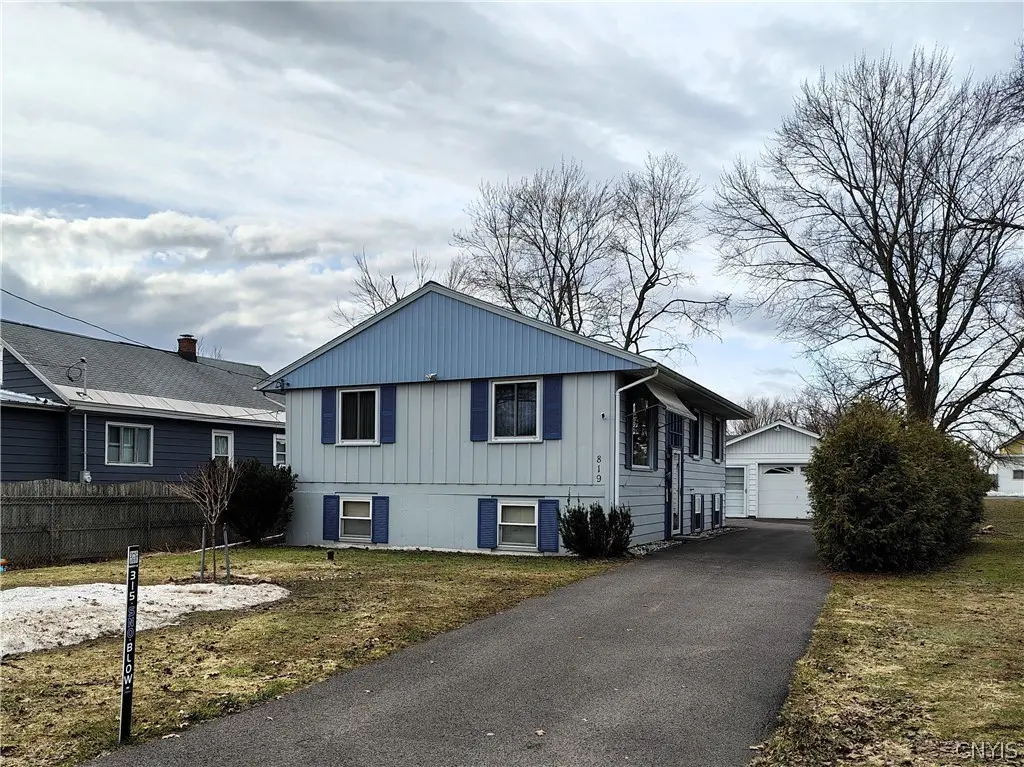
819 W Liberty St · Rome, NY
Flood risk 1/10 · Minimal
- FEMA flood zone
- X (unshaded)
- Chance of flooding over 30 yrs
- 0.0%
- Est. flood insurance / yr
- $473 – $860
Fire risk 2/10 · Minimal
- Est. fire insurance / yr
- $691 – $1,283
Heat risk 3/10 · Minor
- Hot days now (above 94°F)
- 7 days/yr
- Hot days in 30 yrs
- 17 days/yr
Wind risk 1/10 · Minimal
- Chance of severe wind over 30 yrs
- 0.0%
Air-quality risk 2/10 · Minimal
- Unhealthy air days now
- 0 days/yr
- Unhealthy air days in 30 yrs
- 1 days/yr
Risk factors via First Street. Map © Google.
Why this score? — see what drove the D- grade
The composite is a weighted blend of 9 inputs, each scored 0–100. Each bar is that input's sub-score; the figure is the points it added to the 100-point composite (weight × sub-score).
- Cash flow +14.0/30.0
- ARV discount +5.5/15.0
- DSCR +4.3/10.0
- Schools +3.5/10.0
- 1% rule +3.4/10.0
- Livability +3.2/5.0
- Rent growth +2.5/5.0
- Condition / age +2.5/5.0
- Appreciation +0.0/10.0
$214,900
🖨 Deal sheet (PDF) 📄 Offer letter ✓ Due diligence
Listing remarks MLS
NOT A DRIVE-BY; OWNERS PRIDE SHOWS; NEW WINDOWS ROOF; NEWER FURNACE W/ AC; NEWER CARPETING THRU-OUT; TASTEFULLY DECORATED INSIDE; FINISHED 22 X 24 FAMILY ROOM ON LOWER LEVEL; FORMAL DINING; BEAUTIFULLY MAINTAINED; LARGE DEEP LOT; NO BACK NEIGHBORS; DRIVE-THRU GARAGE; PRICED TO SELL!
Key facts
- Formal dining room
- Generously sized lot
- Bright living room
Tags
Property features AI
Exterior
- Parking: Detached garage with electricity and garage door opener; Garage has 1 parking space
- Utilities: Electricity connected (circuit breakers); Public water connected; Sewer connected; Cable available; High-speed internet available
- Home design: Single-story property; Existing structure; Pitched shingle roof; Vinyl siding; Main entry at first/ground level
- Construction: Built previously (existing); Vinyl siding exterior; Copper plumbing; Block foundation
- Exterior features: Blacktop driveway; Near public transit; Rectangular residential lot; City street frontage
Interior
- Kitchen: Eat-in kitchen; Second kitchen; Free-standing range; Oven; Microwave; Refrigerator
- Bedrooms: Three main-level bedrooms; Additional bedrooms located on lower and first levels (multiple bedrooms across levels)
- Flooring: Carpet; Hardwood; Tile; Varies
- Bathrooms: Two full bathrooms; One main-level bathroom
- Heating & cooling: Gas forced-air heating; Central air conditioning
- Interior features: Ceiling fans; Separate/formal dining room; Entrance foyer; Eat-in kitchen; Separate/formal living room; Second kitchen; Natural woodwork; Main level primary bedroom; Bedroom on main level; Thermal windows
- Laundry & utility: Washer; Dryer; Laundry located in basement; Gas water heater
Neighborhood map
What this means for you Summary
Snapshot
- This is a 3-bed/1.5-bath single-family listed at $215k.
Deal economics
- At list price, monthly cash flow is $29 ($346/yr) — positive.
- The deal already cash-flows at list — no discount required.
- To meet the 1% rule (rent ≥ 1% of price), the offer needs to be $180k (16.3% below list).
- Recommended offer: $180k (16.3% below list) — sets the bar for 1% rule.
Location & tenants
- Location reads 64/100 on livability (#722 in NY) — a middle-class / working-renter tenant base. Strengths: cost of living A+, housing A+; Watch: health & safety C-, amenities F, commute F.
- Rome City School District (town): math 35% / reading 46% proficiency, ranked #516 of 590 in NY (top 88%) — families likely to look elsewhere, expect single-tenant / working-renter base with shorter leases.
- Zoned schools: Gansevoort Elementary School (math 12% / reading 22%, grade F, #2,011 of 2,108 statewide, top 96%, 443 students, 78% FRL); Lyndon H Strough Middle School (math 20% / reading 40%, grade F, #539 of 729 statewide, top 74%, 829 students, 59% FRL); Rome Free Academy (math 85% / reading 98%, grade A+, #201 of 1,100 statewide, top 18%, 1,511 students, 51% FRL).
- Market conditions: 282 active listings in the ZIP; 5 comparable units currently listed for rent nearby; rentals lingering (median 46d on market — plan ~5-8 weeks vacancy on turnover, expect pricing pressure); 100% of comp listings sitting > 30 days — soft ceiling on asking rent; 204 units permitted in Oneida County in 2024 (68 in 5+ unit buildings).
Forward outlook
- Local home prices are declining (-3.0%/yr); year-one equity from $1k of loan paydown is wiped out by about $6k of value loss. Plan a longer hold.
- Oneida County population projected at -12% by 2050 — secular population decline; favor cash flow + early exit over multi-decade hold.
Negotiation context
- It's been on market 68 days — a 6% lower offer ($202k) is reasonable based on typical stale-listing flexibility.
- 2 sale attempts since 21y ago with the ask held roughly flat each time — persistent listings suggest the price (not the market) is what's stuck; bring a comps-based counter.
- Current owner paid $84k; list at $215k implies a 155% gain — meaningful room to come down on a strong offer.
Questions for the listing agent
- It's been on market 68 days. Have you received any prior offers? Is the seller open to a 16% concession, seller financing, or rate buy-down credit?
- Built in 1966 — when were the roof, HVAC, electrical panel, plumbing, and water heater last replaced?
- Why hasn't it sold? Are there any deal-killer items the seller is aware of (foundation, flood, title, zoning, code violations)?
- Is there a deadline driving the sale (1031 exchange, divorce, estate, relocation)? That informs how much negotiation room exists.
- Schools are F-rated, which usually means shorter tenancies and higher turnover. Who's the typical renter profile here, and what's been the actual vacancy rate?
- The area grade is low — what's the realistic commute time and amenity access for the typical tenant pool here? Any planned neighborhood developments (good or bad) we should know about?
- What's the average days-on-market for RENTAL listings here right now (not sales)? A rising rental-DOM trend means longer vacancies and softer asking-rent achievability than the comps imply.
- What's the recent tenant-quality profile in this submarket — average credit score on applications, eviction rate, late-payment / NSF rate, and stable-employment percentage? A property-management company in the area should have these aggregated.
- How much new for-sale + rental construction is in the pipeline within 1–3 miles? Heavy new supply typically softens prices + rents 12–24 months out; constrained supply supports both.
Investment metrics
- 1% rule
- 0.84% ✗
- Cap rate
- 6.45%
- Cash-on-cash
- 0.57%
- DSCR
- 1.03
- GRM
- 10.0
CMA / ARV
- ARV (on-the-fly)
- $205,700
- Comps found
- 12
Show comp detail 12 sales within ~0.75 mi
| Address | Dist | Beds/Ba | Sqft | Sold | Price | $/sf | Match |
|---|---|---|---|---|---|---|---|
| 743 W Court St | 0.19mi | 3/2.5 | 1,712 (+1%) | 2mo | $80,000 | $47 | 84 |
| 901 W Dominick St | 0.13mi | 4/— (+1) | 1,740 (+2%) | 7mo | $147,000 | $84 | 79 |
| 818 Erie Blvd W | 0.19mi | 4/1.0 (+1) | 1,670 (-2%) | 6mo | $140,000 | $84 | 76 |
| 325 Mcrae St | 0.37mi | 3/1.0 | 1,582 (-7%) | 5mo | $201,000 | $127 | 65 |
| 402 N Jay St | 0.69mi | 3/1.5 | 1,737 (+2%) | 3mo | $149,900 | $86 | 61 |
| 737 W Thomas St | 0.54mi | 2/1.5 (-1) | 1,663 (-2%) | 6mo | $207,000 | $124 | 61 |
| 221 S Jay St | 0.69mi | 3/1.0 | 1,804 (+6%) | 7mo | $102,000 | $57 | 50 |
| 904 W Thomas St | 0.65mi | 4/2.0 (+1) | 1,758 (+3%) | 10mo | $220,000 | $125 | 49 |
| 901 W Thomas St | 0.61mi | 4/2.0 (+1) | 1,859 (+9%) | 3mo | $240,000 | $129 | 46 |
| 533 William St | 0.60mi | 3/1.0 | 1,484 (-13%) | 8mo | $179,900 | $121 | 42 |
| 104 S Madison St | 0.74mi | 2/1.0 (-1) | 1,896 (+12%) | 1mo | $24,000 | $13 | 39 |
| 926 W Thomas St | 0.75mi | 3/1.0 | 1,476 (-13%) | 4mo | $193,000 | $131 | 38 |
Match score weights: distance 35% · size 25% · config 20% · recency 20%. Top-matched comps best support the ARV.
Projected returns pro-forma
-3.0% appreciation · 3.0% rent growth · sell at horizon
- IRR
- -15.4%
- Equity multiple
- 0.45×
- Total profit
- $-33,017
- Equity at exit
- $32,042
- IRR
- -6.9%
- Equity multiple
- 0.56×
- Total profit
- $-26,508
- Equity at exit
- $18,581
Cash invested: $60,172 (down + closing). Projections, not guarantees.
Landlord ↔ Tenant lean methodology
- Overall (STATE)
- 15 Strongly Tenant-Friendly
- State New York
- 15 Strongly Tenant-Friendly · D+10
- County
- — inherits STATE
- City
- — inherits STATE
ZIP-level market 13440
- Home prices YoY
- -8.0%
- Active inventory
- 282
- Price-to-rent
- 10.0×
Monthly cashflow live
- Estimated rent
- $1,799 medium interval (Pro) →
- Mortgage (P&I)
- −$1,127
- Tax from tax record
- −$176 /mo · $2,110/yr
- Insurance
- −$90
- HOA
- −$0
- Vacancy / Maint / Mgmt
- −$378
- Net cashflow
- $29
Break-even live
Sensitivity live
| Price | -10% $150 | -5% $90 | +0% $29 | +5% $-32 | +10% $-93 |
|---|---|---|---|---|---|
| Rent | -10% $-113 | -5% $-42 | +0% $29 | +5% $100 | +10% $171 |
| Rate | -1.0pp $137 | -0.5pp $83 | base $29 | +0.5pp $-27 | +1.0pp $-84 |
UW: 25.0% down · 7.5% · 30yr · 1.5% tax · 5.0% vac · 8.0% maint · 8.0% mgmt
Financing live
Cash to close
- Down payment
- $53,725
- Closing costs
- $6,447
- Reserves months
- —
- Total cash needed
- —
Loan-product check · same deal, 3 products live
Conventional
25% down · 7.5% · 30yr
- Down + closing
- —
- Monthly P&I
- —
- Monthly cashflow
- —
- DSCR
- —
- Eligible?
- —
Personal DTI + credit; lowest rate.
DSCR
20% down · 8.5% · 30yr
- Down + closing
- —
- Monthly P&I
- —
- Monthly cashflow
- —
- DSCR
- —
- Eligible?
- —
No personal income docs; deal must DSCR.
Hard money
10% down · 12.0% · 12mo
- Down + closing
- —
- Monthly P&I
- —
- Monthly cashflow
- —
- DSCR
- —
- Eligible?
- —
Short-term bridge; refi at stabilization.
Rent comps 5 comps
| Address | Beds | Baths | Sqft | Rent | $/sqft | DOM | Units | Dist |
|---|---|---|---|---|---|---|---|---|
| 1027 Elwood St Rome, NY | 3.0 | 2.0 | 1200 | $1,500 | $1.25 | 45d | 1 | 0.33mi |
| 218 N George St Rome, NY | 2.0 | 1.0 | 2200 | $1,200 | $0.55 | 45d | 1 | 0.89mi |
| 251 Liam Ln Unit 251 Rome, NY | 3.0 | 2.0 | 1577 | $2,750 | $1.74 | 45d | 1 | 1.28mi |
| 149 River St Unit 2 Rome, NY | 3.0 | 1.0 | 1160 | $1,500 | $1.29 | 46d | 1 | 1.35mi |
| 7805 Merrick Rd Unit 201 Rome, NY | 2.0 | 2.0 | 1200 | $2,000 | $1.67 | 45d | 1 | 1.48mi |
Listing history 6 events
-
2026-04-25historical Active Under Contract
-
2026-04-07price $214,900
-
2026-03-18$219,014 Active
-
2006-02-15soldstatus $84,200
-
2006-02-14soldstatus $84,200 377-char remark
Show marketing remark (377 chars)
NOT A DRIVE-BY; OWNERS PRIDE SHOWS; NEW WINDOWS ROOF; NEWER FURNACE W/ AC; NEWER CARPETING THRU-OUT; TASTEFULLY DECORATED INSIDE; FINISHED 22 X 24 FAMILY ROOM ON LOWER LEVEL; FORMAL DINING; BEAUTIFULLY MAINTAINED; LARGE DEEP LOT; NO BACK NEIGHBORS; DRIVE-THRU GARAGE; PRICED TO‌‌‌‌‌‌‌‌‌‌‌‌ SELL!
-
2005-08-02$82,900 377-char remark
Show marketing remark (377 chars)
NOT A DRIVE-BY; OWNERS PRIDE SHOWS; NEW WINDOWS ROOF; NEWER FURNACE W/ AC; NEWER CARPETING THRU-OUT; TASTEFULLY DECORATED INSIDE; FINISHED 22 X 24 FAMILY ROOM ON LOWER LEVEL; FORMAL DINING; BEAUTIFULLY MAINTAINED; LARGE DEEP LOT; NO BACK NEIGHBORS; DRIVE-THRU GARAGE; PRICED TO‌‌‌‌‌‌‌‌‌‌‌‌ SELL!
ⓘ Source: listings_history table (triggers on properties + properties_extension) + one-shot
backfill from property_details.listing_events for pre-trigger history.
Tax reassessment forecast NY · Partial reset (capped growth)
- Current annual tax
- $2,110 · $176/mo
- Projected year-2 tax
- $2,871 · $239/mo
- Expected delta
- +$761/yr (+$63/mo · 36.1%)
ⓘ Screening estimate from a state-policy table — verify with the county assessor before closing.
Climate risk First Street
- Flood 1/10 Low FEMA zone X (unshaded) · 0% chance over 30 yrs
- Wildfire 2/10 Low
- Heat 3/10 Moderate 7 d/yr ≥94°F today · 17 d/yr by 30 yrs out
- Wind 1/10 Low 0% chance of damaging wind over 30 yrs
- Air quality 2/10 Low 0 unhealthy d/yr today · 1 by 30 yrs out
Nearby sold comps map
Loading sold comps map…
Walkable amenities ~0.75 mi
Loading nearby amenities…
Taxation est. · year 1
- Rental income
- $21,587
- − Mortgage interest
- −$12,038
- − Property taxes
- −$2,110
- − Insurance
- −$1,074
- − Repairs & maintenance
- −$1,727
- − Management
- −$1,727
- − Depreciation
- −$6,252
- Taxable loss
- −$3,341
- Est. tax savings @ 24.0%
- +$802
- After-tax cash flow
- $1,148/yr
For passive investors: Depreciation is non-cash, so a rental often shows a tax loss while cash-flowing — sheltering income. Rental losses are passive: they offset passive income freely, and up to $25,000/yr can offset ordinary (W-2) income if you actively participate and your MAGI is under $100k (phasing out to $0 by $150k); unused losses carry forward. On sale, claimed depreciation is recaptured at up to 25%, and gains may owe capital-gains tax (a 1031 exchange can defer both). Figures are a year-1 estimate at your 24.0% rate — not tax advice; consult a CPA.
Schools (NCES district)
- District
- Rome City School District
- NCES district ID
- 3624900
- Math proficiency
- 35% ▼ -4.00%
- Reading proficiency
- 46% ▲ 10.00%
- Median HH income
- $46,406
- Composite
- 34.52/100
- National rank
- #5178
- State rank
- #516 of 590 in NY
Livability — Rome
- Score
- 64/100
- State rank
- #722
- US rank
- #13676
Category grades
Schools grade is shown separately in the Schools card above.
Census & demographics
- Census place
- Rome, NY
- City population
- 41,418
- Population (ZIP)
- 41,273
Population outlook (Oneida County) Hauer SSP2
- Today (2025)
- 225,223 people
- By 2030
- 220,384 · -2.1%
- By 2040
- 209,071 · -7.2%
- By 2050
- 197,920 · -12.1%
- By 2075
- 175,541 · -22.1%
- By 2100
- 148,491 · -34.1%
Race, ethnicity, and origin ACS 2023
- Neighborhood character
- Predominantly White (82%)
- Race & ethnicity
- White 82% Hispanic / Latino 7% Two or more races 6% Black 4% Asian 1%
- Hispanic origin (detail)
- Mexican 1% Puerto Rican 4%
- Common ancestry
- Romanian 9% Lithuanian 4% Slovak 1%
- Foreign-born
- 3% · Canada, China
- Languages at home
- 94% English-only · Spanish 3% Other Indo-European 1%
Political lean MEDSL · Oneida
- 2024 margin
- Strong R (+21.3) · D 39.4% · R 60.6%
- 2008→2024 swing
- -15.2pp toward R · 2008: -6.1pp · 2024: -21.3pp
- All cycles
- 2024: R+21.3 2020: R+15.5 2016: R+21.1 2012: R+5.3 2008: R+6.1
Not yet ingested
- Civics
- —
Market trends
- HPI YoY
- ▼ -29.58%
- Current HPI
- 339.3589
- Rent YoY
- —
- Metro
- —
- State GDP YoY
- ▲ 2.60%
- F500 in state
- 92
Industry mix (Fortune 500 HQ in NY)
| Industry | F500 HQs | Revenue |
|---|---|---|
| Financial Services | 10 | $950B |
|
||
| Consumer Goods | 9 | $162B |
|
||
| Insurance | 4 | $225B |
|
||
| Telecommunications | 2 | $144B |
|
||
| Pharmaceuticals | 2 | $112B |
|
||
| Media / Entertainment | 2 | $69B |
|
||
Price history
+159.2% since first listed6 events — show timeline
- 2026-04-25 Contingent — CNYIS
- 2026-04-07 Price Changed $214,900 CNYIS
- 2026-03-18 Listed $219,014 CNYIS
- 2006-02-15 Sold (Public Records) $84,200 Public Records
- 2006-02-14 Sold (MLS) $84,200 CNYIS
- 2005-08-02 Listed $82,900 CNYIS
Property tax history
+0.2%/yrLatest (2025): $2,110 · +3.3% YoY. Source: county tax records.
Cash-flow waterfall
monthlySold comps — $/sqft
last 12 mo · ≤1 miLoading sold comps…