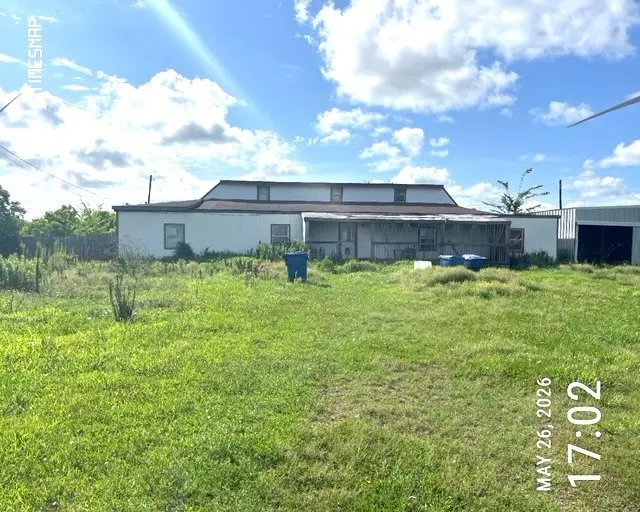
691 County Road 174 · Wadsworth, TX
Flood risk 7/10 · Major
- FEMA flood zone
- X (unshaded)
- Chance of flooding over 30 yrs
- 0.99%
- Est. flood insurance / yr
- $507 – $1,088
Fire risk 5/10 · Moderate
- Est. fire insurance / yr
- $1,222 – $2,270
Heat risk 10/10 · Severe
- Hot days now (above 113°F)
- 7 days/yr
- Hot days in 30 yrs
- 24 days/yr
Wind risk 9/10 · Severe
- Chance of severe wind over 30 yrs
- 99.0%
Air-quality risk 1/10 · Minimal
- Unhealthy air days now
- 0 days/yr
- Unhealthy air days in 30 yrs
- 0 days/yr
Risk factors via First Street. Map © Google.
Why this score? — see what drove the B- grade
The composite is a weighted blend of 9 inputs, each scored 0–100. Each bar is that input's sub-score; the figure is the points it added to the 100-point composite (weight × sub-score).
- Cash flow +29.2/30.0
- 1% rule +10.0/10.0
- DSCR +10.0/10.0
- ARV discount +7.5/15.0
- Rent growth +3.3/5.0
- Schools +3.1/10.0
- Livability +2.5/5.0
- Condition / age +2.5/5.0
- Appreciation +0.0/10.0
$84,900
🖨 Deal sheet (PDF) 📄 Offer letter ✓ Due diligence
Listing remarks
The subject property is a country home situated on a spacious lot, offering a rural setting with convenient access to outdoor activities. The residence provides ample living space and presents an opportunity for updates and improvements to enhance its overall condition and appeal.
Key facts
- Ample living space
- Spacious lot
- Rural setting
Tags
Property features AI
Finance
- Financial info: Lease not considered
Exterior
- Parking: No designated parking
- Utilities: Well water
- Home design: Residential property
- Construction: Built in 1996; Wood siding; Block foundation; Composition roof
- Exterior features: Cleared lot; Asphalt road access
Interior
- Kitchen: Kitchen on the first floor
- Bedrooms: Three bedrooms on the first floor (primary bedroom 10x10; two bedrooms 8x8)
- Bathrooms: Two full bathrooms on the first floor
- Heating & cooling: Propane heating; Window unit(s) for cooling; Has heating and cooling
- Interior features: Dining room; Family room
Neighborhood map
What this means for you Summary
Snapshot
- This is a 3-bed/1.0-bath single-family listed at $85k.
Deal economics
- At list price, monthly cash flow is $231 ($3k/yr) — positive.
- The deal already cash-flows at list — no discount required.
- Meets the 1% rule at list price ($1k rent vs $85k).
- Recommended offer: $84k (1.5% below list) — sets the bar for market timing.
Location & tenants
- Location reads: area grade B — affects rentability + tenant quality, not the cash-flow math above.
- Van Vleck ISD (town): math 36% / reading 37% proficiency, ranked #492 of 826 in TX (top 60%) — families likely to look elsewhere, expect single-tenant / working-renter base with shorter leases.
- Zoned schools: Van Vleck El (math 42% / reading 37%, grade F, #1,545 of 4,322 statewide, top 38%, 303 students, 58% FRL); Van Vleck Jr H S (math 29% / reading 38%, grade F, #911 of 1,662 statewide, top 56%, 243 students, 59% FRL); Van Vleck H S (math 57% / reading 42%, grade D, #509 of 1,632 statewide, top 34%, 355 students, 50% FRL) — zoned schools at 55% FRL track the district average.
- Market conditions: Rents rising (+3.3%/yr); 626 active listings in the ZIP; 153 units permitted in Matagorda County in 2024 (0 in 5+ unit buildings).
Forward outlook
- Local home prices are declining (-3.0%/yr); year-one equity from $587 of loan paydown is wiped out by about $3k of value loss. Plan a longer hold.
- At projected returns (-3.0% appreciation + 3.3% rent growth), your $24k cash investment doubles in ~10 years — after that, you're playing with house money.
Negotiation context
- It's been on market 27 days — a 2% lower offer ($84k) is reasonable based on typical stale-listing flexibility.
Risks & watch-outs
- Watch-outs: property tax is 3.6% of price; flood insurance adds $66/mo.
- Climate carrying-cost: major flood risk; severe wind risk, 99% chance of damaging wind over 30y; moderate wildfire risk; extreme-heat days projected 7→24/yr by 2055 (HVAC capex compounding) — expect insurance premiums to compound above CPI over the hold.
Questions for the listing agent
- Property tax is high relative to price — has the assessment been appealed recently, and will the sale trigger a re-assessment?
- What's the actual annual flood-insurance premium (NFIP or private), and is the property in a SFHA with mandatory coverage?
- Is there a deadline driving the sale (1031 exchange, divorce, estate, relocation)? That informs how much negotiation room exists.
- What's the average days-on-market for RENTAL listings here right now (not sales)? A rising rental-DOM trend means longer vacancies and softer asking-rent achievability than the comps imply.
- What's the recent tenant-quality profile in this submarket — average credit score on applications, eviction rate, late-payment / NSF rate, and stable-employment percentage? A property-management company in the area should have these aggregated.
- How much new for-sale + rental construction is in the pipeline within 1–3 miles? Heavy new supply typically softens prices + rents 12–24 months out; constrained supply supports both.
Investment metrics
- 1% rule
- 1.54% ✓
- Cap rate
- 10.49%
- Cash-on-cash
- 14.99%
- DSCR
- 1.67
- GRM
- 5.4
CMA / ARV
No comps found within radius.
Projected returns pro-forma
-3.0% appreciation · 3.28% rent growth · sell at horizon
- IRR
- 1.6%
- Equity multiple
- 1.06×
- Total profit
- $1,444
- Equity at exit
- $12,659
- IRR
- 11.7%
- Equity multiple
- 1.94×
- Total profit
- $22,298
- Equity at exit
- $7,341
Cash invested: $23,772 (down + closing). Projections, not guarantees.
Landlord ↔ Tenant lean methodology
- Overall (STATE)
- 87 Strongly Landlord-Friendly
- State Texas
- 87 Strongly Landlord-Friendly · R+5
- County
- — inherits STATE
- City
- — inherits STATE
ZIP-level market 77414
- Home prices YoY
- -17.7%
- Rents YoY
- 3.3%
- Active inventory
- 626
- Price-to-rent
- 5.4×
Monthly cashflow live
- Estimated rent
- $1,305 medium interval (Pro) →
- Mortgage (P&I)
- −$445
- Tax from tax record
- −$254 /mo · $3,043/yr
- Insurance
- −$35
- Flood insurance flood zone
- −$66 /mo · $798/yr
- HOA
- −$0
- Lot rent
- −$0
- Vacancy / Maint / Mgmt
- −$274
- Net cashflow
- $231
Break-even live
Sensitivity live
| Price | -10% $279 | -5% $255 | +0% $231 | +5% $206 | +10% $182 |
|---|---|---|---|---|---|
| Rent | -10% $127 | -5% $179 | +0% $231 | +5% $282 | +10% $334 |
| Rate | -1.0pp $273 | -0.5pp $252 | base $231 | +0.5pp $209 | +1.0pp $186 |
UW: 25.0% down · 7.5% · 30yr · 1.5% tax · 5.0% vac · 8.0% maint · 8.0% mgmt
Financing live
Cash to close
- Down payment
- $21,225
- Closing costs
- $2,547
- Reserves months
- —
- Total cash needed
- —
Loan-product check · same deal, 3 products live
Conventional
25% down · 7.5% · 30yr
- Down + closing
- —
- Monthly P&I
- —
- Monthly cashflow
- —
- DSCR
- —
- Eligible?
- —
Personal DTI + credit; lowest rate.
DSCR
20% down · 8.5% · 30yr
- Down + closing
- —
- Monthly P&I
- —
- Monthly cashflow
- —
- DSCR
- —
- Eligible?
- —
No personal income docs; deal must DSCR.
Hard money
10% down · 12.0% · 12mo
- Down + closing
- —
- Monthly P&I
- —
- Monthly cashflow
- —
- DSCR
- —
- Eligible?
- —
Short-term bridge; refi at stabilization.
Listing history 21 events
-
2026-06-22days on market $84,900 Active 27 DOM
-
2026-06-19days on market $84,900 Active 24 DOM
-
2026-06-18days on market $84,900 Active 23 DOM
-
2026-06-17price $84,900 Active 22 DOM
-
2026-06-17days on market $99,900 Active 22 DOM
-
2026-06-16days on market $99,900 Active 21 DOM
-
2026-06-15days on market $99,900 Active 20 DOM
-
2026-06-14days on market $99,900 Active 18 DOM
-
2026-06-13price $99,900 Active 17 DOM
-
2026-06-12days on market $124,900 Active 17 DOM
-
2026-06-09days on market $124,900 Active 14 DOM
-
2026-06-08days on market $124,900 Active 13 DOM
-
2026-06-07days on market $124,900 Active 12 DOM
-
2026-06-07pricedays on market $124,900 Active 11 DOM
-
2026-06-03days on market $214,900 Active 8 DOM
-
2026-06-02days on market $214,900 Active 7 DOM
-
2026-06-01days on market $214,900 Active 6 DOM
-
2026-05-31days on market $214,900 Active 5 DOM
-
2026-05-30days on market $214,900 Active 4 DOM
-
2026-05-27$214,900 Active
-
2006-09-01soldstatus
ⓘ Source: listings_history table (triggers on properties + properties_extension) + one-shot
backfill from property_details.listing_events for pre-trigger history.
Tax reassessment forecast TX · Resets to sale price
- Current annual tax
- $3,043 · $254/mo
- Projected year-2 tax
- $3,043 · $254/mo
- Expected delta
- $0/yr ($0/mo · 0.0%)
ⓘ Screening estimate from a state-policy table — verify with the county assessor before closing.
Climate risk First Street
- Flood 7/10 Severe FEMA zone X (unshaded) · 99% chance over 30 yrs
- Wildfire 5/10 Major
- Heat 10/10 Extreme 7 d/yr ≥113°F today · 24 d/yr by 30 yrs out
- Wind 9/10 Extreme 99% chance of damaging wind over 30 yrs
- Air quality 1/10 Low 0 unhealthy d/yr today · 0 by 30 yrs out
Nearby sold comps map
Loading sold comps map…
Walkable amenities ~0.75 mi
Loading nearby amenities…
Taxation est. · year 1
- Rental income
- $15,663
- − Mortgage interest
- −$4,756
- − Property taxes
- −$3,043
- − Insurance
- −$1,222
- − Repairs & maintenance
- −$1,253
- − Management
- −$1,253
- − Depreciation
- −$2,470
- Taxable income
- $1,666
- Est. tax owed @ 24.0%
- −$400
- After-tax cash flow
- $2,366/yr
For passive investors: Depreciation is non-cash, so a rental often shows a tax loss while cash-flowing — sheltering income. Rental losses are passive: they offset passive income freely, and up to $25,000/yr can offset ordinary (W-2) income if you actively participate and your MAGI is under $100k (phasing out to $0 by $150k); unused losses carry forward. On sale, claimed depreciation is recaptured at up to 25%, and gains may owe capital-gains tax (a 1031 exchange can defer both). Figures are a year-1 estimate at your 24.0% rate — not tax advice; consult a CPA.
Schools (NCES district)
- District
- Van Vleck ISD
- NCES district ID
- 4843950
- Math proficiency
- 36% ▼ -14.00%
- Reading proficiency
- 37% ▼ -8.00%
- Median HH income
- $43,348
- Composite
- 30.96/100
- National rank
- #6106
- State rank
- #492 of 826 in TX
Livability — Wadsworth
No livability data for this city. (Only ~50 U.S. cities are tracked.)
Census & demographics
- County
- Matagorda County · 24,334 people
- Metro
- Bay City, TX
- Population (ZIP)
- 24,334
- Household income
- $59,128
- Rent vs Own
- Severe rent burden
- 1228.0
Population outlook (Matagorda County) Hauer SSP2
- Today (2025)
- 37,148 people
- By 2030
- 37,082 · -0.2%
- By 2040
- 36,987 · -0.4%
- By 2050
- 36,934 · -0.6%
- By 2075
- 37,178 · +0.1%
- By 2100
- 35,184 · -5.3%
Race, ethnicity, and origin ACS 2023
- Neighborhood character
- Diverse neighborhood (Simpson 0.65)
- Race & ethnicity
- Hispanic / Latino 43% White 39% Black 13% Two or more races 13% Asian 2%
- Hispanic origin (detail)
- Mexican 37% Puerto Rican 1%
- Common ancestry
- Lithuanian 1% Slovak 1% Serbian 1%
- Foreign-born
- 12% · Canada
- Languages at home
- 71% English-only · Spanish 26% Other Indo-European 2% German/W. Germanic 1%
Political lean MEDSL · Matagorda
- 2024 margin
- Solid R (+50.5) · D 24.3% · R 74.8%
- 2008→2024 swing
- -23.1pp toward R · 2008: -27.4pp · 2024: -50.5pp
- All cycles
- 2024: R+50.5 2020: R+44.5 2016: R+40.7 2012: R+33.5 2008: R+27.4
Not yet ingested
- Civics
- —
Market trends
- HPI YoY
- ▼ -36.31%
- Current HPI
- 168.9985
- Rent YoY
- ▲ 3.28%
- Metro
- Bay City, TX
- State GDP YoY
- ▲ 3.95%
- F500 in state
- 110
Industry mix (Fortune 500 HQ in TX)
| Industry | F500 HQs | Revenue |
|---|---|---|
| Energy | 16 | $1,198B |
|
||
| Technology | 5 | $198B |
|
||
| Engineering / Construction | 4 | $72B |
|
||
| Energy Services | 3 | $60B |
|
||
| Utilities | 3 | $41B |
|
||
| Healthcare | 2 | $330B |
|
||
Price history
2 events — show timeline
- 2026-05-27 Listed $214,900 HARMLS
- 2006-09-01 Sold (Public Records) — Public Records
Property tax history
+5.0%/yrLatest (2025): $3,043 · +8.1% YoY. Source: county tax records.
Cash-flow waterfall
monthlySold comps — $/sqft
last 12 mo · ≤1 miLoading sold comps…