411 5th Ave · Dayton, KY
Flood risk 8/10 · Major
- FEMA flood zone
- X (unshaded)
- Chance of flooding over 30 yrs
- 0.99%
- Est. flood insurance / yr
- $507 – $1,088
Fire risk 1/10 · Minimal
- Est. fire insurance / yr
- $839 – $1,559
Heat risk 5/10 · Moderate
- Hot days now (above 103°F)
- 7 days/yr
- Hot days in 30 yrs
- 19 days/yr
Wind risk 2/10 · Minimal
- Chance of severe wind over 30 yrs
- 1.0%
Air-quality risk 3/10 · Minor
- Unhealthy air days now
- 2 days/yr
- Unhealthy air days in 30 yrs
- 3 days/yr
Risk factors via First Street. Map © Google.
Why this score? — see what drove the B grade
The composite is a weighted blend of 9 inputs, each scored 0–100. Each bar is that input's sub-score; the figure is the points it added to the 100-point composite (weight × sub-score).
- Cash flow +30.0/30.0
- 1% rule +10.0/10.0
- DSCR +10.0/10.0
- ARV discount +7.5/15.0
- Rent growth +4.3/5.0
- Livability +4.0/5.0
- Condition / age +2.5/5.0
- Schools +2.3/10.0
- Appreciation +0.0/10.0
$149,000
🖨 Deal sheet 📄 Offer letter ✓ Due diligence
Listing remarks
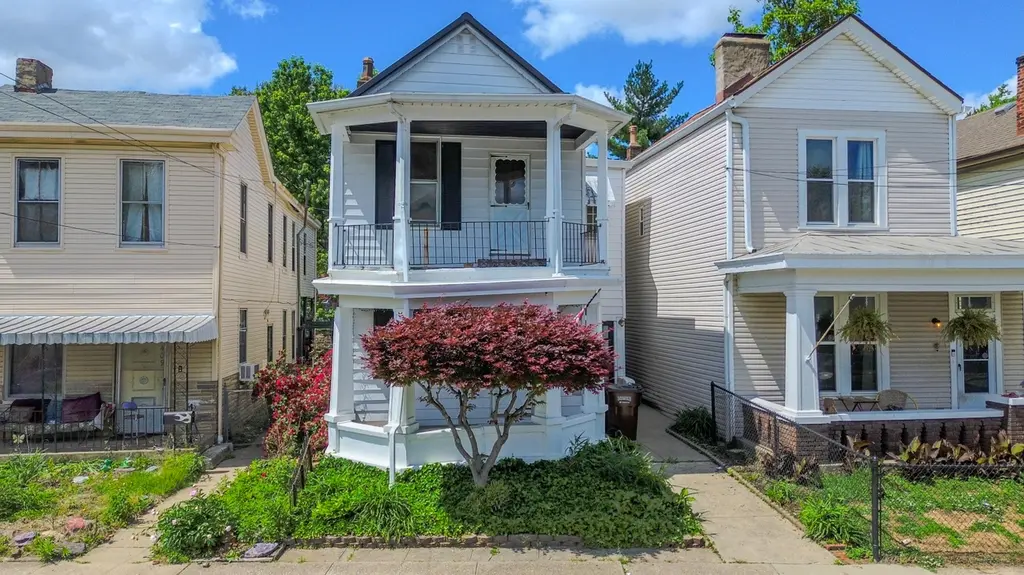
BEING SOLD AS-IS, WHERE IS BUYER MUST SEE PROPERTY BEFORE MAKING AN OFFER New Metal Roof Installed 3 Years Ago! Investor Special - Duplex in Dayton, Kentucky with Garage & Strong Upside Potential Near Cincinnati Investor opportunity in the heart of Dayton, Kentucky! This multi-family duplex at 411 5th Ave offers two 1-bedroom, 1-bath units, each with a living room and kitchen--perfect for rental income or a creative renovation. The lower unit features a covered front porch, while the upper unit enjoys a private covered balcony. A rare two-car garage is tucked behind the property off a quiet rear alley, adding convenience and value. This property is an investor's special an
Key facts
- Covered front porch
- Two 1 bedroom units
- Two car garage
Tags
Property features AI
Exterior
- Parking: Detached parking; On-street parking; 2-car garage
- Utilities: Public water; Public sewer; Cable available; Natural gas available; Sewer available; Water available
- Home design: Duplex; Two levels; Multi-family property; Existing structure; Built in 1890
- Construction: Aluminum siding; Metal roof; Block foundation; Stone foundation
- Exterior features: Covered porch; Awning(s); Balcony; Has a view
Interior
- Kitchen: Gas Range; Gas Oven
- Bathrooms: Two full bathrooms
- Heating & cooling: Forced air heating
- Interior features: Gas Range; Gas Oven; Partial basement
Neighborhood map
What this means for you Summary
Snapshot
- This is a 4-bed/4.0-bath other listed at $149k.
Deal economics
- At list price, monthly cash flow is $974 ($12k/yr) — positive.
- The deal already cash-flows at list — no discount required.
- Meets the 1% rule at list price ($3k rent vs $149k).
- Recommended offer: $145k (3.0% below list) — sets the bar for market timing.
- Cap rate 14.7% vs local median 6.9% in Dayton — top-decile yield for the area; either an underpriced asset or a hidden risk that comps aren't pricing in. Stress-test before assuming the spread holds.
Location & tenants
- Location reads 81/100 on livability (#67 in KY, #1,485 nationally) — a professional / high-income tenant draw. Strengths: commute A+, cost of living A+, housing A+; Watch: employment D+.
- Dayton Independent (suburban): math 23% / reading 32% proficiency, ranked #129 of 165 in KY (top 78%) — low school quality limits family demand, transient renter base, plan for 1-2y turnover; 71% free/reduced lunch — lower-income household profile, screen leases tightly.
- Zoned schools: Lincoln Elementary School (math 20% / reading 29%, grade F, #489 of 676 statewide, top 76%, 487 students, 82% FRL); Dayton High School (math 27% / reading 37%, grade F, #97 of 254 statewide, top 46%, 372 students, 78% FRL).
- Market conditions: Rents rising fast (+7.2%/yr); 53 active listings in the ZIP; 14 comparable units currently listed for rent nearby; rentals at typical pace (median 15d on market — plan ~3-4 weeks tenant-placement turnaround); 247 units permitted in Campbell County in 2024 (77 in 5+ unit buildings).
- At $2,622/mo this rent would consume 48% of the median local household income ($66k/yr) (locally 215% of renters already pay >50% of income on rent) — very limited rent-growth headroom before tenants either downsize or default.
Forward outlook
- Local home prices are declining (-3.0%/yr); year-one equity from $1k of loan paydown is wiped out by about $4k of value loss. Plan a longer hold.
- At projected returns (-3.0% appreciation + 7.2% rent growth), your $42k cash investment doubles in ~4 years — after that, you're playing with house money.
Negotiation context
- It's been on market 45 days — a 3% lower offer ($145k) is reasonable based on typical stale-listing flexibility.
Risks & watch-outs
- Watch-outs: flood insurance adds $66/mo; built in 1890 — expect roof / HVAC / electrical / plumbing capex.
- Climate carrying-cost: severe flood risk; extreme-heat days projected 7→19/yr by 2055 (HVAC capex compounding) — expect insurance premiums to compound above CPI over the hold.
Questions for the listing agent
- It's been on market 45 days. Have you received any prior offers? Is the seller open to a 3% concession, seller financing, or rate buy-down credit?
- Built in 1890 — when were the roof, HVAC, electrical panel, plumbing, and water heater last replaced?
- What's the actual annual flood-insurance premium (NFIP or private), and is the property in a SFHA with mandatory coverage?
- Is there a deadline driving the sale (1031 exchange, divorce, estate, relocation)? That informs how much negotiation room exists.
- Schools are D-rated, which usually means shorter tenancies and higher turnover. Who's the typical renter profile here, and what's been the actual vacancy rate?
- What's the average days-on-market for RENTAL listings here right now (not sales)? A rising rental-DOM trend means longer vacancies and softer asking-rent achievability than the comps imply.
- What's the recent tenant-quality profile in this submarket — average credit score on applications, eviction rate, late-payment / NSF rate, and stable-employment percentage? A property-management company in the area should have these aggregated.
- How much new for-sale + rental construction is in the pipeline within 1–3 miles? Heavy new supply typically softens prices + rents 12–24 months out; constrained supply supports both.
Investment metrics
- 1% rule
- 1.76% ✓
- Cap rate
- 14.67%
- Cash-on-cash
- 29.93%
- DSCR
- 2.33
- GRM
- 4.7
CMA / ARV
No comps found within radius.
Projected returns pro-forma
-3.0% appreciation · 7.15% rent growth · sell at horizon
- IRR
- 27.0%
- Equity multiple
- 2.18×
- Total profit
- $49,390
- Equity at exit
- $22,216
- IRR
- 37.0%
- Equity multiple
- 5.18×
- Total profit
- $174,215
- Equity at exit
- $12,883
Cash invested: $41,720 (down + closing). Projections, not guarantees.
Landlord ↔ Tenant lean methodology
- Overall (STATE)
- 83 Strongly Landlord-Friendly
- State Kentucky
- 83 Strongly Landlord-Friendly · R+16
- County
- — inherits STATE
- City
- — inherits STATE
ZIP-level market 41074
- Rents YoY
- 7.2%
- Active inventory
- 53
- Price-to-rent
- 4.7×
Monthly cashflow live
- Estimated rent
- $2,622 high interval (Pro) →
- Mortgage (P&I)
- −$781
- Tax from tax record
- −$187 /mo · $2,242/yr
- Insurance
- −$62
- Flood insurance flood zone
- −$66 /mo · $798/yr
- HOA
- −$0
- Vacancy / Maint / Mgmt
- −$551
- Net cashflow
- $974
Break-even live
UW: 25.0% down · 7.5% · 30yr · 1.5% tax · 5.0% vac · 8.0% maint · 8.0% mgmt
Financing live
Cash to close
- Down payment
- $37,250
- Closing costs
- $4,470
- Reserves months
- —
- Total cash needed
- —
Loan-product check · same deal, 3 products live
Conventional
25% down · 7.5% · 30yr
- Down + closing
- —
- Monthly P&I
- —
- Monthly cashflow
- —
- DSCR
- —
- Eligible?
- —
Personal DTI + credit; lowest rate.
DSCR
20% down · 8.5% · 30yr
- Down + closing
- —
- Monthly P&I
- —
- Monthly cashflow
- —
- DSCR
- —
- Eligible?
- —
No personal income docs; deal must DSCR.
Hard money
10% down · 12.0% · 12mo
- Down + closing
- —
- Monthly P&I
- —
- Monthly cashflow
- —
- DSCR
- —
- Eligible?
- —
Short-term bridge; refi at stabilization.
Rent comps 14 comps
| Address | Beds | Baths | Sqft | Rent | $/sqft | DOM | Units | Dist |
|---|---|---|---|---|---|---|---|---|
| 236 Ward Ave Bellevue, KY | 3.0 | 2.0 | 1500 | $2,585 | $1.72 | 12d | 1 | 0.49mi |
| 1065 Manhattan Blvd Dayton, KY | 1.0–3.0 | 1.0–2.0 | 1038 | $2,749 | $2.65 | 2d | 19 | 0.70mi |
| 2331 Park Ave Unit 1 Cincinnati, OH | 3.0 | 2.5 | 2200 | $2,350 | $1.07 | 2d | 1 | 0.92mi |
| 2533 Woodburn Ave Cincinnati, OH | 3.0 | 1.0–3.0 | 912 | $3,320 | $3.64 | 2d | 39 | 0.95mi |
| 923 Rogers Pl Cincinnati, OH | 3.0 | 1.0 | 2061 | $1,600 | $0.78 | 23d | 1 | 1.05mi |
| 749 Morgan St Cincinnati, OH | 3.0 | 2.0 | 1488 | $1,745 | $1.17 | 14d | 1 | 1.20mi |
| 118 Beech St Newport, KY | 3.0 | 2.0 | 1610 | $2,400 | $1.49 | 2d | 1 | 1.20mi |
| 923 Paradrome St Cincinnati, OH | 3.0 | 2.5 | 2098 | $3,000 | $1.43 | 23d | 1 | 1.22mi |
| 1055 St Paul Pl Cincinnati, OH | 3.0 | 1.0–2.0 | 975 | $2,995 | $3.07 | 2d | 10 | 1.29mi |
| 808 William Howard Taft Rd Cincinnati, OH | 3.0 | 2.0 | 1178 | $2,050 | $1.74 | 21d | 1 | 1.34mi |
| 704 Wayne St Unit 1056107P Cincinnati, OH | 3.0 | 2.0 | 1291 | $3,898 | $3.02 | 14d | 1 | 1.34mi |
| 2612 Stanton Ave Unit 1 Cincinnati, OH | 3.0 | 1.0 | 1080 | $1,599 | $1.48 | 23d | 1 | 1.36mi |
| 2517 May St Cincinnati, OH | 3.0 | 3.5 | 2014 | $3,420 | $1.70 | 21d | 1 | 1.42mi |
| 2601 May St Cincinnati, OH | 2.0–3.0 | 2.5–3.5 | 1737 | $3,325 | $1.91 | 2d | 12 | 1.44mi |
Listing history 14 events
-
2026-06-18days on market $149,000 Active 45 DOM
-
2026-06-17days on market $149,000 Active 44 DOM
-
2026-06-16days on market $149,000 Active 43 DOM
-
2026-06-15days on market $149,000 Active 42 DOM
-
2026-06-13days on market $149,000 Active 40 DOM
-
2026-06-09days on market $149,000 Active 36 DOM
-
2026-06-08pricedays on market $149,000 Active 35 DOM
-
2026-06-07days on market $159,000 Active 34 DOM
-
2026-06-03days on market $159,000 Active 30 DOM
-
2026-06-02days on market $159,000 Active 29 DOM
-
2026-06-01days on market $159,000 Active 28 DOM
-
2026-05-31days on market $159,000 Active 27 DOM
-
2026-05-21price $159,000
-
2026-05-04$169,000 Active
ⓘ Source: listings_history table (triggers on properties + properties_extension) + one-shot
backfill from property_details.listing_events for pre-trigger history.
Tax reassessment forecast KY · Resets to sale price
- Current annual tax
- $2,242 · $187/mo
- Projected year-2 tax
- $2,242 · $187/mo
- Expected delta
- $0/yr ($0/mo · 0.0%)
ⓘ Screening estimate from a state-policy table — verify with the county assessor before closing.
Climate risk First Street
- Flood 8/10 Severe FEMA zone X (unshaded) · 99% chance over 30 yrs
- Wildfire 1/10 Low
- Heat 5/10 Major 7 d/yr ≥103°F today · 19 d/yr by 30 yrs out
- Wind 2/10 Low 100% chance of damaging wind over 30 yrs
- Air quality 3/10 Moderate 2 unhealthy d/yr today · 3 by 30 yrs out
Nearby sold comps map
Loading sold comps map…
Walkable amenities ~0.75 mi
Loading nearby amenities…
Taxation est. · year 1
- Rental income
- $31,459
- − Mortgage interest
- −$8,346
- − Property taxes
- −$2,242
- − Insurance
- −$1,542
- − Repairs & maintenance
- −$2,517
- − Management
- −$2,517
- − Depreciation
- −$4,335
- Taxable income
- $9,959
- Est. tax owed @ 24.0%
- −$2,390
- After-tax cash flow
- $9,301/yr
For passive investors: Depreciation is non-cash, so a rental often shows a tax loss while cash-flowing — sheltering income. Rental losses are passive: they offset passive income freely, and up to $25,000/yr can offset ordinary (W-2) income if you actively participate and your MAGI is under $100k (phasing out to $0 by $150k); unused losses carry forward. On sale, claimed depreciation is recaptured at up to 25%, and gains may owe capital-gains tax (a 1031 exchange can defer both). Figures are a year-1 estimate at your 24.0% rate — not tax advice; consult a CPA.
Schools (NCES district)
- District
- Dayton Independent
- NCES district ID
- 2101530
- Math proficiency
- 23% ▼ -13.00%
- Reading proficiency
- 32% ▼ -12.00%
- Median HH income
- $38,533
- Composite
- 23.0/100
- National rank
- #7978
- State rank
- #129 of 165 in KY
Livability — Dayton
- Score
- 81/100
- State rank
- #67
- US rank
- #1485
Category grades
Schools grade is shown separately in the Schools card above.
Census & demographics
- Census place
- Dayton, KY
- County
- Campbell County · 84,793 people
- City population
- 5,756
- Metro
- Cincinnati, OH-KY-IN
- Population (ZIP)
- 5,756
- Household income
- $66,087
- Rent vs Own
- Severe rent burden
- 215.0
Population outlook (Campbell County) Hauer SSP2
- Today (2025)
- 95,668 people
- By 2030
- 96,886 · +1.3%
- By 2040
- 97,734 · +2.2%
- By 2050
- 96,413 · +0.8%
- By 2075
- 90,211 · -5.7%
- By 2100
- 79,434 · -17.0%
Race, ethnicity, and origin ACS 2023
- Neighborhood character
- Predominantly White (89%)
- Race & ethnicity
- White 89% Two or more races 7% Hispanic / Latino 3% Black 1%
- Common ancestry
- Slovak 5% Italian 3% Lithuanian 2%
- Foreign-born
- 2% · Canada
- Languages at home
- 98% English-only · Spanish 1%
Political lean MEDSL · Campbell
- 2024 margin
- R (+19.7) · D 39.2% · R 58.9% · Other 1.9%
- 2008→2024 swing
- +1.2pp toward D · 2008: -20.9pp · 2024: -19.7pp
- All cycles
- 2024: R+19.7 2020: R+18.6 2016: R+24.5 2012: R+22.8 2008: R+20.9
Not yet ingested
- Civics
- —
Market trends
- HPI YoY
- ▼ -171.48%
- Current HPI
- 235.1437
- Rent YoY
- ▲ 7.15%
- Metro
- Cincinnati, OH-KY-IN
- State GDP YoY
- ▲ 1.81%
- F500 in state
- 4
Industry mix (Fortune 500 HQ in KY)
| Industry | F500 HQs | Revenue |
|---|---|---|
| Healthcare | 1 | $118B |
|
||
| Food / Beverage | 1 | $7B |
|
||
Price history
-5.9% since first listed2 events — show timeline
- 2026-05-21 Price Changed $159,000 NKMLS
- 2026-05-04 Listed $169,000 NKMLS
Property tax history
+5.1%/yrLatest (2025): $2,242 · +0.5% YoY. Source: county tax records.
Cash-flow waterfall
monthlySold comps — $/sqft
last 12 mo · ≤1 miLoading sold comps…