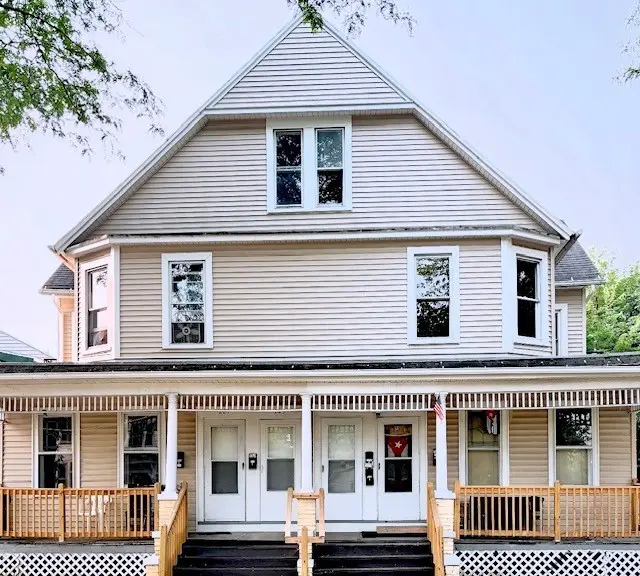
 5-Plex
221-227 Spencer St · Rochester, NY
Flood risk 1/10 · Minimal
- FEMA flood zone
- X (unshaded)
- Chance of flooding over 30 yrs
- 0.0%
- Est. flood insurance / yr
- $473 – $860
Fire risk 1/10 · Minimal
- Est. fire insurance / yr
- $691 – $1,283
Heat risk 2/10 · Minimal
- Hot days now (above 95°F)
- 7 days/yr
- Hot days in 30 yrs
- 15 days/yr
Wind risk 1/10 · Minimal
- Chance of severe wind over 30 yrs
- —
Air-quality risk 2/10 · Minimal
- Unhealthy air days now
- 1 days/yr
- Unhealthy air days in 30 yrs
- 2 days/yr
Risk factors via First Street. Map © Google.
Why this score? — see what drove the B- grade
The composite is a weighted blend of 9 inputs, each scored 0–100. Each bar is that input's sub-score; the figure is the points it added to the 100-point composite (weight × sub-score).
- Cash flow +30.0/30.0
- 1% rule +10.0/10.0
- DSCR +10.0/10.0
- Appreciation +6.8/10.0
- Rent growth +4.2/5.0
- Livability +3.8/5.0
- Condition / age +2.5/5.0
- Schools +1.9/10.0
- ARV discount +0.0/15.0
$279,900
🖨 Deal sheet (PDF) 📄 Offer letter ✓ Due diligence
Multi-family units
County records classify this as Multi-Family (5+ Unit). Listing-text estimate: 5 units. confirmed
5+ unit building — per-unit beds/baths from public records are typically unavailable; the breakdown below (if shown) is an estimate from the listing text.
Listing remarks MLS
221 Spencer Street, Rochester, NY presents an opportunity to acquire a 5-unit multifamily asset in Rochester’s Edgerton neighborhood, offered at $299,900. This income-producing property features four 2-bedroom apartments and one 1-bedroom apartment, with all utilities separately metered for streamlined management and expense control. Currently generating $4,375 per month in gross rental income, the property offers immediate cash flow with a defined rent roll in place. The Certificate of Occupancy transfers with the sale and is valid through December 2028. Annual operating expenses are reported at approximately $5,403 for taxes, $3,500 for insurance, $632 for water, and $832 for refuse. Please allow 48 hours for showing requests to notify tenants. Please provide a proof of funds statement or a bank term sheet for financing before showings. Showings are weekdays 10 to 3.
Key facts
- Immediate cash flow
- Multifamily asset
- 6,098 sq ft lot
Tags
Neighborhood map
What this means for you Summary
Snapshot
- This is a 4×2bd/1ba + 1×1bd/1ba units multifamily listed at $280k.
Deal economics
- At list price, monthly cash flow is $5k ($60k/yr) — positive. Per door: $1k/mo.
- The deal already cash-flows at list — no discount required.
- Meets the 1% rule at list price ($9k rent vs $280k).
- Recommended offer: $276k (1.5% below list) — sets the bar for market timing.
- Cap rate 27.8% vs local median 9.3% in Rochester — top-decile yield for the area; either an underpriced asset or a hidden risk that comps aren't pricing in. Stress-test before assuming the spread holds.
Location & tenants
- Location reads 76/100 on livability (#222 in NY, #3,482 nationally) — a middle-class / working-renter tenant base. Strengths: commute A+, cost of living A+, housing A+; Watch: schools D+, crime F, employment F.
- Rochester City School District (urban): math 21% / reading 26% proficiency, ranked #589 of 590 in NY (top 100%) — low school quality limits family demand, transient renter base, plan for 1-2y turnover; 82% free/reduced lunch — lower-income household profile, screen leases tightly.
- Market conditions: Rents rising fast (+6.6%/yr); 51 active listings in the ZIP; lower-income renter base — watch delinquency; 1,169 units permitted in Monroe County in 2024 (591 in 5+ unit buildings).
- At $8,556/mo this rent would consume 253% of the median local household income ($41k/yr) (locally 1300% of renters already pay >50% of income on rent) — very limited rent-growth headroom before tenants either downsize or default.
Forward outlook
- In year one you build about $12k of equity ($2k loan paydown + $10k appreciation (3.7% local appreciation)).
- Monroe County population projected to shrink 6% by 2050 — rents likely to lag national; underwrite the cash flow, not the appreciation.
- At projected returns (3.7% appreciation + 6.6% rent growth), your $78k cash investment doubles in ~2 years — after that, you're playing with house money.
- By year 3, paydown + projected appreciation supports a ~$30k cash-out refi (75% LTV) — recoverable capital for the next deal without selling this one.
Negotiation context
- It's been on market 27 days — a 2% lower offer ($276k) is reasonable based on typical stale-listing flexibility.
- Current owner paid $166k; list at $280k implies a 69% gain — meaningful room to come down on a strong offer.
Risks & watch-outs
- Watch-outs: built in 1920 — expect roof / HVAC / electrical / plumbing capex.
Questions for the listing agent
- Can we see the unit-by-unit rent roll, current vacancy, and any below-market leases? What's the average tenancy length?
- What capital expenditures (roof, boiler, parking lot, exteriors) have been made in the last 5 years, and what's planned in the next 2?
- Built in 1920 — when were the roof, HVAC, electrical panel, plumbing, and water heater last replaced?
- Is there a deadline driving the sale (1031 exchange, divorce, estate, relocation)? That informs how much negotiation room exists.
- Schools are D-rated, which usually means shorter tenancies and higher turnover. Who's the typical renter profile here, and what's been the actual vacancy rate?
- Crime grade is F in this area — have there been break-ins, vandalism, or insurance claims at this property in the last 3 years? What carrier currently insures it and at what premium?
- What's the average days-on-market for RENTAL listings here right now (not sales)? A rising rental-DOM trend means longer vacancies and softer asking-rent achievability than the comps imply.
- What's the recent tenant-quality profile in this submarket — average credit score on applications, eviction rate, late-payment / NSF rate, and stable-employment percentage? A property-management company in the area should have these aggregated.
- How much new apartment / multifamily construction is in the pipeline within 1–3 miles? Heavy new supply (>2% of stock underway) typically softens rents 12–24 months out; light construction supports rent growth.
Investment metrics
- 1% rule
- 3.06% ✓
- Cap rate
- 27.85%
- Cash-on-cash
- 76.98%
- DSCR
- 4.43
- GRM
- 2.7
CMA / ARV
- ARV (median comp)
- $235,891
- List price
- $279,900
- Delta
- 18.66%
- Verdict
- OVERPRICED
- Comps
- 20 within 1.0 mi
Show comp detail 3 sales within ~0.75 mi
| Address | Dist | Beds/Ba | Sqft | Sold | Price | $/sf | Match |
|---|---|---|---|---|---|---|---|
| 856-858 Plymouth Ave N #856 | 0.19mi | 8/4.0 | 6,906 (+10%) | 4mo | $254,400 | $37 | 71 |
| 1099 Saint Paul St | 0.73mi | 4/— | 6,739 (+8%) | 14mo | $300,000 | $45 | 41 |
| 35 Myrtle Hill Park | 0.51mi | 4/— | 7,100 (+14%) | 22mo | $119,000 | $17 | 35 |
Match score weights: distance 35% · size 25% · config 20% · recency 20%. Top-matched comps best support the ARV.
Projected returns pro-forma
3.69% appreciation · 6.61% rent growth · sell at horizon
- IRR
- 85.5%
- Equity multiple
- 6.06×
- Total profit
- $396,499
- Equity at exit
- $136,886
- IRR
- 85.6%
- Equity multiple
- 13.84×
- Total profit
- $1,006,078
- Equity at exit
- $219,969
Cash invested: $78,372 (down + closing). Projections, not guarantees.
Landlord ↔ Tenant lean methodology
- Overall (STATE)
- 15 Strongly Tenant-Friendly
- State New York
- 15 Strongly Tenant-Friendly · D+10
- County
- — inherits STATE
- City
- — inherits STATE
ZIP-level market 14608
- Home prices YoY
- 1.3%
- Rents YoY
- 6.6%
- Active inventory
- 51
- Price-to-rent
- 13.4×
Monthly cashflow live
- Estimated rent
- $8,556 high interval (Pro) →
- Mortgage (P&I)
- −$1,468
- Tax from tax record
- −$147 /mo · $1,768/yr
- Insurance
- −$117
- HOA
- −$0
- Vacancy / Maint / Mgmt
- −$1,797
- Net cashflow
- $5,027
Break-even live
Sensitivity live
| Price | -10% $5,186 | -5% $5,107 | +0% $5,027 | +5% $4,948 | +10% $4,869 |
|---|---|---|---|---|---|
| Rent | -10% $4,352 | -5% $4,690 | +0% $5,027 | +5% $5,365 | +10% $5,703 |
| Rate | -1.0pp $5,168 | -0.5pp $5,099 | base $5,027 | +0.5pp $4,955 | +1.0pp $4,881 |
5-unit breakdown (identical units grouped — click to expand)
| Units | Beds | Baths | Est. rent |
|---|---|---|---|
| 4× units | 2 | 1 | $6,984 |
| #1 | 2 | 1 | $1,746 |
| #2 | 2 | 1 | $1,746 |
| #3 | 2 | 1 | $1,746 |
| #4 | 2 | 1 | $1,746 |
| 1× unit | 1 | 1 | $1,571 |
| Total (5 units) | $8,556 | ||
UW: 25.0% down · 7.5% · 30yr · 1.5% tax · 5.0% vac · 8.0% maint · 8.0% mgmt
Financing live
Cash to close
- Down payment
- $69,975
- Closing costs
- $8,397
- Reserves months
- —
- Total cash needed
- —
Loan-product check · same deal, 3 products live
Conventional
25% down · 7.5% · 30yr
- Down + closing
- —
- Monthly P&I
- —
- Monthly cashflow
- —
- DSCR
- —
- Eligible?
- —
Personal DTI + credit; lowest rate.
DSCR
20% down · 8.5% · 30yr
- Down + closing
- —
- Monthly P&I
- —
- Monthly cashflow
- —
- DSCR
- —
- Eligible?
- —
No personal income docs; deal must DSCR.
Hard money
10% down · 12.0% · 12mo
- Down + closing
- —
- Monthly P&I
- —
- Monthly cashflow
- —
- DSCR
- —
- Eligible?
- —
Short-term bridge; refi at stabilization.
Listing history 6 events
-
2026-05-17status Pending 887-char remark
Show marketing remark (887 chars)
221 Spencer Street, Rochester, NY presents an opportunity to acquire a 5-unit multifamily asset in Rochester’s Edgerton neighborhood, offered at $299,900. This income-producing property features four 2-bedroom apartments and one 1-bedroom apartment, with all utilities separately metered for streamlined management and expense control. Currently generating $4,375 per month in gross rental income, the property offers immediate cash flow with a defined rent roll in place. The Certificate of Occupancy transfers with the sale and is valid through December 2028. Annual operating expenses are reported at approximately $5,403 for taxes, $3,500 for insurance, $632 for water, and $832 for refuse. Please allow 48 hours for showing requests to notify tenants. Please provide a proof of funds statement or a bank term sheet for financing before showings. Showings are weekdays 10 to 3.
-
2026-05-05price $279,900 887-char remark
Show marketing remark (887 chars)
221 Spencer Street, Rochester, NY presents an opportunity to acquire a 5-unit multifamily asset in Rochester’s Edgerton neighborhood, offered at $299,900. This income-producing property features four 2-bedroom apartments and one 1-bedroom apartment, with all utilities separately metered for streamlined management and expense control. Currently generating $4,375 per month in gross rental income, the property offers immediate cash flow with a defined rent roll in place. The Certificate of Occupancy transfers with the sale and is valid through December 2028. Annual operating expenses are reported at approximately $5,403 for taxes, $3,500 for insurance, $632 for water, and $832 for refuse. Please allow 48 hours for showing requests to notify tenants. Please provide a proof of funds statement or a bank term sheet for financing before showings. Showings are weekdays 10 to 3.
-
2026-04-20$299,900 Active 887-char remark
Show marketing remark (887 chars)
221 Spencer Street, Rochester, NY presents an opportunity to acquire a 5-unit multifamily asset in Rochester’s Edgerton neighborhood, offered at $299,900. This income-producing property features four 2-bedroom apartments and one 1-bedroom apartment, with all utilities separately metered for streamlined management and expense control. Currently generating $4,375 per month in gross rental income, the property offers immediate cash flow with a defined rent roll in place. The Certificate of Occupancy transfers with the sale and is valid through December 2028. Annual operating expenses are reported at approximately $5,403 for taxes, $3,500 for insurance, $632 for water, and $832 for refuse. Please allow 48 hours for showing requests to notify tenants. Please provide a proof of funds statement or a bank term sheet for financing before showings. Showings are weekdays 10 to 3.
-
2025-04-14soldstatus $165,745
-
2018-10-03soldstatus $110,000
-
2013-11-08soldstatus $90,000
ⓘ Source: listings_history table (triggers on properties + properties_extension) + one-shot
backfill from property_details.listing_events for pre-trigger history.
Tax reassessment forecast NY · Partial reset (capped growth)
- Current annual tax
- $1,768 · $147/mo
- Projected year-2 tax
- $3,249 · $271/mo
- Expected delta
- +$1,481/yr (+$123/mo · 83.8%)
ⓘ Screening estimate from a state-policy table — verify with the county assessor before closing.
Climate risk First Street
- Flood 1/10 Low FEMA zone X (unshaded) · 0% chance over 30 yrs
- Wildfire 1/10 Low
- Heat 2/10 Low 7 d/yr ≥95°F today · 15 d/yr by 30 yrs out
- Wind 1/10 Low
- Air quality 2/10 Low 1 unhealthy d/yr today · 2 by 30 yrs out
Nearby sold comps map
Loading sold comps map…
Walkable amenities ~0.75 mi
Loading nearby amenities…
Taxation est. · year 1
- Rental income
- $102,672
- − Mortgage interest
- −$15,679
- − Property taxes
- −$1,768
- − Insurance
- −$1,400
- − Repairs & maintenance
- −$8,214
- − Management
- −$8,214
- − Depreciation
- −$8,143
- Taxable income
- $59,256
- Est. tax owed @ 24.0%
- −$14,221
- After-tax cash flow
- $46,108/yr
For passive investors: Depreciation is non-cash, so a rental often shows a tax loss while cash-flowing — sheltering income. Rental losses are passive: they offset passive income freely, and up to $25,000/yr can offset ordinary (W-2) income if you actively participate and your MAGI is under $100k (phasing out to $0 by $150k); unused losses carry forward. On sale, claimed depreciation is recaptured at up to 25%, and gains may owe capital-gains tax (a 1031 exchange can defer both). Figures are a year-1 estimate at your 24.0% rate — not tax advice; consult a CPA.
Schools (NCES district)
- District
- Rochester City School District
- NCES district ID
- 3624750
- Math proficiency
- 21% ▬ 0.00%
- Reading proficiency
- 26% ▲ 4.00%
- Median HH income
- $30,923
- Composite
- 18.98/100
- National rank
- #8850
- State rank
- #589 of 590 in NY
Livability — Rochester
- Score
- 76/100
- State rank
- #222
- US rank
- #3482
Category grades
Schools grade is shown separately in the Schools card above.
Census & demographics
- Census place
- Rochester, NY
- County
- Monroe County · 674,131 people
- City population
- 432,803
- Metro
- Rochester, NY
- Population (ZIP)
- 12,792
- Household income
- $40,646
- Rent vs Own
- Severe rent burden
- 1300.0
Population outlook (Monroe County) Hauer SSP2
- Today (2025)
- 759,460 people
- By 2030
- 757,154 · -0.3%
- By 2040
- 740,644 · -2.5%
- By 2050
- 714,443 · -5.9%
- By 2075
- 645,883 · -15.0%
- By 2100
- 547,084 · -28.0%
Race, ethnicity, and origin ACS 2023
- Neighborhood character
- Diverse neighborhood (Simpson 0.67)
- Race & ethnicity
- Black 50% White 25% Two or more races 13% Hispanic / Latino 12% Asian 4%
- Hispanic origin (detail)
- Puerto Rican 10%
- Common ancestry
- Lithuanian 1% Romanian 1% Iranian 1%
- Foreign-born
- 8% · Canada, India
- Languages at home
- 85% English-only · Spanish 8% Other Indo-European 3% French/Haitian/Cajun 1%
Political lean MEDSL · Monroe
- 2024 margin
- D (+19.1) · D 59.5% · R 40.5%
- 2008→2024 swing
- +1.4pp toward D · 2008: 17.7pp · 2024: 19.1pp
- All cycles
- 2024: D+19.1 2020: D+21.0 2016: D+14.1 2012: D+17.4 2008: D+17.7
Not yet ingested
- Civics
- —
Market trends
- HPI YoY
- ▲ 3.69%
- Current HPI
- 280.2411
- Rent YoY
- ▲ 6.61%
- Metro
- Rochester, NY
- State GDP YoY
- ▲ 2.60%
- F500 in state
- 92
Industry mix (Fortune 500 HQ in NY)
| Industry | F500 HQs | Revenue |
|---|---|---|
| Financial Services | 10 | $950B |
|
||
| Consumer Goods | 9 | $162B |
|
||
| Insurance | 4 | $225B |
|
||
| Telecommunications | 2 | $144B |
|
||
| Pharmaceuticals | 2 | $112B |
|
||
| Media / Entertainment | 2 | $69B |
|
||
Price history
+211.0% since first listed6 events — show timeline
- 2026-05-17 Pending — UNYREIS
- 2026-05-05 Price Changed $279,900 UNYREIS
- 2026-04-20 Listed $299,900 UNYREIS
- 2025-04-14 Sold (Public Records) $165,745 Public Records
- 2018-10-03 Sold (Public Records) $110,000 Public Records
- 2013-11-08 Sold (Public Records) $90,000 Public Records
Property tax history
+1.5%/yrLatest (2025): $1,768 · +0.0% YoY. Source: county tax records.
Cash-flow waterfall
monthlySold comps — $/sqft
last 12 mo · ≤1 miLoading sold comps…