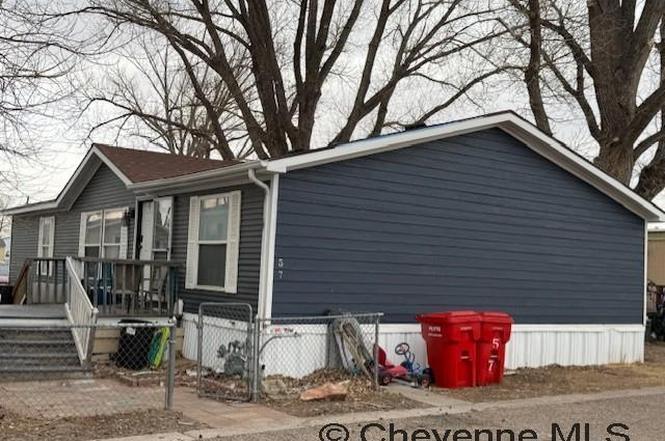
300 E Prosser Rd #57 · Fox Farm-College, WY
Flood risk 1/10 · Minimal
- FEMA flood zone
- X (shaded)
- Chance of flooding over 30 yrs
- 0.0%
- Est. flood insurance / yr
- $507 – $1,088
Fire risk 7/10 · Major
- Est. fire insurance / yr
- $564 – $1,046
Heat risk 2/10 · Minimal
- Hot days now (above 88°F)
- 6 days/yr
- Hot days in 30 yrs
- 14 days/yr
Wind risk 2/10 · Minimal
- Chance of severe wind over 30 yrs
- —
Air-quality risk 3/10 · Minor
- Unhealthy air days now
- 2 days/yr
- Unhealthy air days in 30 yrs
- 2 days/yr
Risk factors via First Street. Map © Google.
Why this score? — see what drove the B- grade
The composite is a weighted blend of 9 inputs, each scored 0–100. Each bar is that input's sub-score; the figure is the points it added to the 100-point composite (weight × sub-score).
- Cash flow +30.0/30.0
- 1% rule +10.0/10.0
- DSCR +10.0/10.0
- ARV discount +7.5/15.0
- Schools +3.9/10.0
- Rent growth +3.8/5.0
- Livability +2.5/5.0
- Condition / age +2.2/5.0
- Appreciation +0.0/10.0
$95,000
🖨 Deal sheet (PDF) 📄 Offer letter ✓ Due diligence
Key facts
- A c system
- Remodeled bathroom
- Open layout
Tags
Property features AI
Exterior
- Home design: Mobile home (residential)
- Construction: Located in Cimmaron Villag subdivision
Interior
- Bathrooms: 2 full bathrooms
- Interior features: Accessible entrance
Neighborhood map
What this means for you Summary
Snapshot
- This is a 3-bed/2.0-bath manufactured listed at $95k. Condition is rated fair.
Deal economics
- At list price, monthly cash flow is $771 ($9k/yr) — positive.
- The deal already cash-flows at list — no discount required.
- Meets the 1% rule at list price ($2k rent vs $95k).
- Recommended offer: $84k (12.0% below list) — sets the bar for market timing.
Location & tenants
- Location reads: area grade B — affects rentability + tenant quality, not the cash-flow math above.
- Laramie County School District #1 (urban): math 41% / reading 48% proficiency, ranked #33 of 41 in WY (top 80%) — families likely to look elsewhere, expect single-tenant / working-renter base with shorter leases.
- Zoned schools: Arp Elementary (math 12% / reading 22%, grade F, #148 of 151 statewide, top 98%, 333 students, 72% FRL); Johnson Junior High School (math 29% / reading 42%, grade F, #53 of 55 statewide, top 96%, 647 students, 66% FRL); South High School (math 23% / reading 29%, grade F, #62 of 75 statewide, top 82%, 1,187 students, 56% FRL) — zoned schools average 64% FRL vs 32% district-wide (33 pts higher); higher-poverty schools than district average — tighter screening recommended.
- Zoned-school proficiency averages 26% at this address vs 44% district-wide (-18 pts) — the specific schools serving this property underperform the Laramie County School District #1 average; the district grade overstates school quality for this exact location.
- Market conditions: Rents rising fast (+5.1%/yr); 171 active listings in the ZIP; 1 comparable units currently listed for rent nearby; 485 units permitted in Laramie County in 2024 (104 in 5+ unit buildings).
- This rent runs 37% of the median local income ($59k/yr) — at the standard rent-burdened threshold; future hikes will face affordability resistance.
Forward outlook
- Local home prices are declining (-3.0%/yr); year-one equity from $657 of loan paydown is wiped out by about $3k of value loss. Plan a longer hold.
- Laramie County population projected at +26% by 2050 — long-run rental-demand tailwind backs the buy-and-hold thesis.
- At projected returns (-3.0% appreciation + 5.1% rent growth), your $27k cash investment doubles in ~4 years — after that, you're playing with house money.
Negotiation context
- It's been on market 121 days — a 12% lower offer ($84k) is reasonable based on typical stale-listing flexibility.
Risks & watch-outs
- Climate carrying-cost: major wildfire risk — expect insurance premiums to compound above CPI over the hold.
Questions for the listing agent
- It's been on market 121 days. Have you received any prior offers? Is the seller open to a 12% concession, seller financing, or rate buy-down credit?
- Have any recent inspections been done? Can we get a copy of the seller's disclosures and any deferred-maintenance estimates?
- Why hasn't it sold? Are there any deal-killer items the seller is aware of (foundation, flood, title, zoning, code violations)?
- Is there a deadline driving the sale (1031 exchange, divorce, estate, relocation)? That informs how much negotiation room exists.
- What's the average days-on-market for RENTAL listings here right now (not sales)? A rising rental-DOM trend means longer vacancies and softer asking-rent achievability than the comps imply.
- What's the recent tenant-quality profile in this submarket — average credit score on applications, eviction rate, late-payment / NSF rate, and stable-employment percentage? A property-management company in the area should have these aggregated.
- How much new for-sale + rental construction is in the pipeline within 1–3 miles? Heavy new supply typically softens prices + rents 12–24 months out; constrained supply supports both.
Investment metrics
- 1% rule
- 1.90% ✓
- Cap rate
- 16.03%
- Cash-on-cash
- 34.78%
- DSCR
- 2.55
- GRM
- 4.4
CMA / ARV
- ARV (on-the-fly)
- $255,840
- Comps found
- 12
Show comp detail 12 sales within ~0.75 mi
| Address | Dist | Beds/Ba | Sqft | Sold | Price | $/sf | Match |
|---|---|---|---|---|---|---|---|
| 621 Sunridge Dr | 0.25mi | 4/2.0 (+1) | 1,652 (+6%) | 2mo | $310,000 | $188 | 72 |
| 702 Sunridge Dr | 0.28mi | 3/2.0 | 1,620 (+4%) | 11mo | $280,000 | $173 | 72 |
| 1409 Renee | 0.18mi | 3/2.0 | 1,404 (-10%) | 6mo | $215,000 | $153 | 70 |
| 616 Sunridge Dr | 0.26mi | 3/2.0 | 1,453 (-7%) | 10mo | $295,000 | $203 | 68 |
| 300 E Prosser Rd #103 | 0.09mi | 3/2.0 | 1,344 (-14%) | 7mo | $30,000 | $22 | 67 |
| 609 E Prosser Rd #48 | 0.21mi | 3/2.0 | 1,360 (-13%) | 6mo | $35,000 | $26 | 64 |
| 612 Sunridge Dr | 0.26mi | 4/2.0 (+1) | 1,404 (-10%) | 5mo | $230,000 | $164 | 62 |
| 1019 Avenue C | 0.34mi | 3/2.0 | 1,742 (+12%) | 15mo | $299,999 | $172 | 52 |
| 212 Tyler Pl #43 | 0.65mi | 3/2.0 | 1,404 (-10%) | 10mo | $69,900 | $50 | 45 |
| 1401 Karen Pl | 0.49mi | 3/2.0 | 1,344 (-14%) | 16mo | $249,000 | $185 | 41 |
| 813 E College Dr #4 | 0.49mi | 3/2.0 | 1,344 (-14%) | 16mo | $75,000 | $56 | 40 |
| 2115 Helen Ave | 0.73mi | 3/2.0 | 1,404 (-10%) | 18mo | $215,000 | $153 | 35 |
Match score weights: distance 35% · size 25% · config 20% · recency 20%. Top-matched comps best support the ARV.
Projected returns pro-forma
-3.0% appreciation · 5.08% rent growth · sell at horizon
- IRR
- 32.6%
- Equity multiple
- 2.41×
- Total profit
- $37,602
- Equity at exit
- $14,165
- IRR
- 40.8%
- Equity multiple
- 5.23×
- Total profit
- $112,617
- Equity at exit
- $8,214
Cash invested: $26,600 (down + closing). Projections, not guarantees.
Landlord ↔ Tenant lean methodology
- Overall (STATE)
- 90 Strongly Landlord-Friendly
- State Wyoming
- 90 Strongly Landlord-Friendly · R+25
- County
- — inherits STATE
- City
- — inherits STATE
ZIP-level market 82007
- Home prices YoY
- -25.9%
- Rents YoY
- 5.1%
- Active inventory
- 171
- Price-to-rent
- 4.4×
Monthly cashflow live
- Estimated rent
- $1,807 medium interval (Pro) →
- Mortgage (P&I)
- −$498
- Tax est. 1.5%
- −$119 /mo · $1,425/yr
- Insurance
- −$40
- HOA
- −$0
- Vacancy / Maint / Mgmt
- −$379
- Net cashflow
- $771
Break-even live
Sensitivity live
| Price | -10% $837 | -5% $804 | +0% $771 | +5% $738 | +10% $705 |
|---|---|---|---|---|---|
| Rent | -10% $628 | -5% $700 | +0% $771 | +5% $842 | +10% $914 |
| Rate | -1.0pp $819 | -0.5pp $795 | base $771 | +0.5pp $746 | +1.0pp $721 |
UW: 25.0% down · 7.5% · 30yr · 1.5% tax · 5.0% vac · 8.0% maint · 8.0% mgmt
Financing live
Cash to close
- Down payment
- $23,750
- Closing costs
- $2,850
- Reserves months
- —
- Total cash needed
- —
Loan-product check · same deal, 3 products live
Conventional
25% down · 7.5% · 30yr
- Down + closing
- —
- Monthly P&I
- —
- Monthly cashflow
- —
- DSCR
- —
- Eligible?
- —
Personal DTI + credit; lowest rate.
DSCR
20% down · 8.5% · 30yr
- Down + closing
- —
- Monthly P&I
- —
- Monthly cashflow
- —
- DSCR
- —
- Eligible?
- —
No personal income docs; deal must DSCR.
Hard money
10% down · 12.0% · 12mo
- Down + closing
- —
- Monthly P&I
- —
- Monthly cashflow
- —
- DSCR
- —
- Eligible?
- —
Short-term bridge; refi at stabilization.
Rent comps 1 comps
| Address | Beds | Baths | Sqft | Rent | $/sqft | DOM | Units | Dist |
|---|---|---|---|---|---|---|---|---|
| 505 Williams St Cheyenne, WY | 2.0–3.0 | 1.0–2.0 | 1028 | $1,899 | $1.85 | 15d | 1 | 1.03mi |
Listing history 20 events
-
2026-06-22days on market $95,000 Active 121 DOM
-
2026-06-19days on market $95,000 Active 119 DOM
-
2026-06-18days on market $95,000 Active 118 DOM
-
2026-06-17days on market $95,000 Active 117 DOM
-
2026-06-16days on market $95,000 Active 116 DOM
-
2026-06-15days on market $95,000 Active 115 DOM
-
2026-06-14days on market $95,000 Active 113 DOM
-
2026-06-13days on market $95,000 Active 112 DOM
-
2026-06-10days on market $95,000 Active 110 DOM
-
2026-06-09days on market $95,000 Active 109 DOM
-
2026-06-08days on market $95,000 Active 108 DOM
-
2026-06-07days on market $95,000 Active 107 DOM
-
2026-06-05days on market $95,000 Active 104 DOM
-
2026-06-03days on market $95,000 Active 103 DOM
-
2026-06-02days on market $95,000 Active 102 DOM
-
2026-06-01days on market $95,000 Active 101 DOM
-
2026-05-31days on market $95,000 Active 100 DOM
-
2026-05-30days on market $95,000 Active 99 DOM
-
2026-04-23price $105,000
-
2026-02-20$110,000 Active
ⓘ Source: listings_history table (triggers on properties + properties_extension) + one-shot
backfill from property_details.listing_events for pre-trigger history.
Climate risk First Street
- Flood 1/10 Low FEMA zone X (shaded) · 0% chance over 30 yrs
- Wildfire 7/10 Severe
- Heat 2/10 Low 6 d/yr ≥88°F today · 14 d/yr by 30 yrs out
- Wind 2/10 Low
- Air quality 3/10 Moderate 2 unhealthy d/yr today · 2 by 30 yrs out
Nearby sold comps map
Loading sold comps map…
Walkable amenities ~0.75 mi
Loading nearby amenities…
Taxation est. · year 1
- Rental income
- $21,685
- − Mortgage interest
- −$5,321
- − Property taxes
- −$1,425
- − Insurance
- −$475
- − Repairs & maintenance
- −$1,735
- − Management
- −$1,735
- − Depreciation
- −$2,764
- Taxable income
- $8,230
- Est. tax owed @ 24.0%
- −$1,975
- After-tax cash flow
- $7,277/yr
For passive investors: Depreciation is non-cash, so a rental often shows a tax loss while cash-flowing — sheltering income. Rental losses are passive: they offset passive income freely, and up to $25,000/yr can offset ordinary (W-2) income if you actively participate and your MAGI is under $100k (phasing out to $0 by $150k); unused losses carry forward. On sale, claimed depreciation is recaptured at up to 25%, and gains may owe capital-gains tax (a 1031 exchange can defer both). Figures are a year-1 estimate at your 24.0% rate — not tax advice; consult a CPA.
Condition & rehab AI · 12 photos
The home is in fair condition with cosmetic updates needed. It has average kitchen and bathroom fixtures, and average exterior siding. The roof and exterior siding require major repairs.
Repairs flagged
- Major roof — visible wear from satellite image
- Major exterior siding — gray siding with visible wear
Value-add opportunities
- Both paint interior walls — Fresh paint can improve the home's appearance and value
- Both replace ceiling fans — Modern ceiling fans can improve air circulation and add to the home's appeal
Renovation cost estimate screening
| Repair item | Severity | Est. cost |
|---|---|---|
| roof · visible wear from satellite image | Major | $15,000–50,000 |
| exterior siding · gray siding with visible wear | Major | $15,000–50,000 |
| Total estimated repair cost · 2 items | $30,000–100,000 |
Value-add ROI direction
- Both paint interior walls — Fresh paint can improve the home's appearance and value ↑
- Both replace ceiling fans — Modern ceiling fans can improve air circulation and add to the home's appeal ↑
ⓘ Cost ranges are severity-bucket heuristics (US national rule-of-thumb). Get contractor quotes + a written scope before underwriting a rehab budget.
Schools (NCES district)
- District
- Laramie County School District #1
- NCES district ID
- 5601980
- Math proficiency
- 41% ▼ -2.00%
- Reading proficiency
- 48% ▼ -2.00%
- Median HH income
- $56,842
- Composite
- 38.86/100
- National rank
- #4103
- State rank
- #33 of 41 in WY
Livability — Fox Farm-College
No livability data for this city. (Only ~50 U.S. cities are tracked.)
Census & demographics
- Census place
- Fox Farm-College, WY
- County
- Laramie County · 94,953 people
- Metro
- Cheyenne, WY
- Population (ZIP)
- 21,704
- Household income
- $58,745
- Rent vs Own
- Severe rent burden
- 854.0
Population outlook (Laramie County) Hauer SSP2
- Today (2025)
- 109,698 people
- By 2030
- 115,710 · +5.5%
- By 2040
- 127,191 · +15.9%
- By 2050
- 138,476 · +26.2%
- By 2075
- 168,653 · +53.7%
- By 2100
- 188,739 · +72.1%
Race, ethnicity, and origin ACS 2023
- Neighborhood character
- Predominantly White (66%)
- Race & ethnicity
- White 66% Hispanic / Latino 27% Two or more races 12% Native American 4% Black 2%
- Hispanic origin (detail)
- Mexican 21%
- Common ancestry
- Lithuanian 2% Slovak 2% Portuguese 2%
- Foreign-born
- 5% · Canada, South Korea
- Languages at home
- 88% English-only · Spanish 10%
Political lean MEDSL · Laramie
- 2024 margin
- Solid R (+32.4) · D 33.0% · R 65.4% · Other 1.6%
- 2008→2024 swing
- -12.1pp toward R · 2008: -20.4pp · 2024: -32.4pp
- All cycles
- 2024: R+32.4 2020: R+28.2 2016: R+33.2 2012: R+24.8 2008: R+20.4
Not yet ingested
- Civics
- —
Market trends
- HPI YoY
- ▼ -90.05%
- Current HPI
- 257.0616
- Rent YoY
- ▲ 5.08%
- Metro
- Cheyenne, WY
- State GDP YoY
- —
- F500 in state
- 0
Price history
-4.5% since first listed2 events — show timeline
- 2026-04-23 Price Changed $105,000 CBR
- 2026-02-20 Listed $110,000 CBR
Cash-flow waterfall
monthlySold comps — $/sqft
last 12 mo · ≤1 miLoading sold comps…