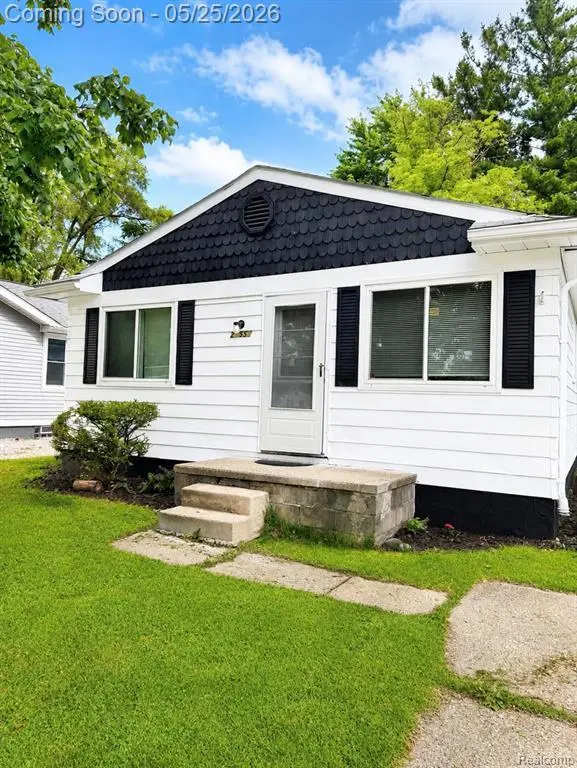
21550 Poinciana St · Southfield, MI
Flood risk 1/10 · Minimal
- FEMA flood zone
- X (unshaded)
- Chance of flooding over 30 yrs
- 0.0%
- Est. flood insurance / yr
- $507 – $1,088
Fire risk 1/10 · Minimal
- Est. fire insurance / yr
- $784 – $1,456
Heat risk 3/10 · Minor
- Hot days now (above 97°F)
- 7 days/yr
- Hot days in 30 yrs
- 15 days/yr
Wind risk 2/10 · Minimal
- Chance of severe wind over 30 yrs
- —
Air-quality risk 3/10 · Minor
- Unhealthy air days now
- 2 days/yr
- Unhealthy air days in 30 yrs
- 3 days/yr
Risk factors via First Street. Map © Google.
Why this score? — see what drove the D+ grade
The composite is a weighted blend of 9 inputs, each scored 0–100. Each bar is that input's sub-score; the figure is the points it added to the 100-point composite (weight × sub-score).
- Cash flow +14.4/30.0
- ARV discount +12.9/15.0
- 1% rule +5.4/10.0
- DSCR +4.4/10.0
- Livability +3.6/5.0
- Condition / age +2.5/5.0
- Schools +2.4/10.0
- Rent growth +2.0/5.0
- Appreciation +0.0/10.0
$165,000
🖨 Deal sheet (PDF) 📄 Offer letter ✓ Due diligence
Listing remarks MLS
Great ranch home with 3 bedrooms and 1 bath. Nicely remodeled with fresh paint and ready for you. New floors throughout the house. New furnace 2026. Nice front and back yard. Excellent location! Certificate of occupancy has been approved by city of Southfield
Key facts
- 5,663 sq ft lot
- Built 1972
- Listed 27 days
Property features AI
Exterior
- Parking: No garage
- Utilities: Public water; Public sewer
- Home design: Single-family residence; One level; Ground-level entry with steps; Aluminum siding
- Construction: Aluminum siding construction
- Exterior features: Paved road access; Lot approximately 0.13 acres (40 x 138)
Interior
- Kitchen: Free-standing gas range; Free-standing refrigerator
- Bedrooms: 5 total rooms (includes bedrooms and living spaces)
- Bathrooms: 1 full bathroom
- Heating & cooling: Forced air heating (natural gas); No cooling
- Interior features: Free-standing gas range; Free-standing refrigerator; Crawl space basement
Neighborhood map
What this means for you Summary
Snapshot
- This is a 3-bed/1.0-bath single-family listed at $165k.
Deal economics
- At list price, monthly cash flow is $33 ($401/yr) — positive.
- The deal already cash-flows at list — no discount required.
- Meets the 1% rule at list price ($2k rent vs $165k).
- Recommended offer: $163k (1.5% below list) — sets the bar for market timing.
- Cap rate 6.5% vs local median 4.6% in Southfield — top-decile yield for the area; either an underpriced asset or a hidden risk that comps aren't pricing in. Stress-test before assuming the spread holds.
Location & tenants
- Location reads 72/100 on livability (#248 in MI) — a middle-class / working-renter tenant base. Strengths: commute A+, cost of living A+, housing A+; Watch: health & safety D, crime F, amenities F.
- Southfield Public School District (urban): math 17% / reading 37% proficiency, ranked #392 of 540 in MI (top 73%) — low school quality limits family demand, transient renter base, plan for 1-2y turnover.
- Zoned schools: Glenn W Levey Middle School (math 8% / reading 22%, grade F, #453 of 493 statewide, top 93%, 316 students, 62% FRL).
- Zoned-school proficiency averages 15% at this address vs 27% district-wide (-12 pts) — the specific schools serving this property underperform the Southfield Public School District average; the district grade overstates school quality for this exact location.
- Market conditions: Rents soft (-2.0%/yr); 82 active listings in the ZIP; 13 comparable units currently listed for rent nearby; rentals at typical pace (median 26d on market — plan ~3-4 weeks tenant-placement turnaround); 2,614 units permitted in Oakland County in 2024 (721 in 5+ unit buildings).
- This rent runs 34% of the median local income ($61k/yr) — at the standard rent-burdened threshold; future hikes will face affordability resistance.
Forward outlook
- Local home prices are declining (-3.0%/yr); year-one equity from $1k of loan paydown is wiped out by about $5k of value loss. Plan a longer hold.
- Oakland County population projected at +10% by 2050 — modest demand growth; plan on rents tracking national, not racing it.
Negotiation context
- It's been on market 28 days — a 2% lower offer ($163k) is reasonable based on typical stale-listing flexibility.
- 20 sale attempts since 27y ago; this cycle's ask is 10212% above the opening price — seller raised mid-cycle; expect resistance to lowballs.
- Current owner paid $137k; 20% above their basis — modest negotiation headroom, anchor on the comps not their cost.
Risks & watch-outs
- Watch-outs: property tax is 2.9% of price.
Questions for the listing agent
- Built in 1972 — when were the roof, HVAC, electrical panel, plumbing, and water heater last replaced?
- Property tax is high relative to price — has the assessment been appealed recently, and will the sale trigger a re-assessment?
- Is there a deadline driving the sale (1031 exchange, divorce, estate, relocation)? That informs how much negotiation room exists.
- Schools are D-rated, which usually means shorter tenancies and higher turnover. Who's the typical renter profile here, and what's been the actual vacancy rate?
- Crime grade is F in this area — have there been break-ins, vandalism, or insurance claims at this property in the last 3 years? What carrier currently insures it and at what premium?
- The area grade is low — what's the realistic commute time and amenity access for the typical tenant pool here? Any planned neighborhood developments (good or bad) we should know about?
- What's the average days-on-market for RENTAL listings here right now (not sales)? A rising rental-DOM trend means longer vacancies and softer asking-rent achievability than the comps imply.
- What's the recent tenant-quality profile in this submarket — average credit score on applications, eviction rate, late-payment / NSF rate, and stable-employment percentage? A property-management company in the area should have these aggregated.
- How much new for-sale + rental construction is in the pipeline within 1–3 miles? Heavy new supply typically softens prices + rents 12–24 months out; constrained supply supports both.
Investment metrics
- 1% rule
- 1.04% ✓
- Cap rate
- 6.54%
- Cash-on-cash
- 0.87%
- DSCR
- 1.04
- GRM
- 8.0
CMA / ARV
- ARV (on-the-fly)
- $187,488
- Comps found
- 12
Show comp detail 12 sales within ~0.75 mi
| Address | Dist | Beds/Ba | Sqft | Sold | Price | $/sf | Match |
|---|---|---|---|---|---|---|---|
| 21110 Van Buren St | 0.36mi | 3/1.0 | 1,024 (+2%) | 7mo | $220,000 | $215 | 74 |
| 21053 Saint Francis St | 0.46mi | 3/1.0 | 1,079 (+7%) | 8mo | $150,000 | $139 | 60 |
| 21208 Poinciana St | 0.19mi | 4/1.0 (+1) | 1,138 (+13%) | 7mo | $162,500 | $143 | 59 |
| 22023 W Brandon St | 0.50mi | 3/1.0 | 913 (-9%) | 2mo | $248,000 | $272 | 59 |
| 21431 Oxford Ave | 0.59mi | 2/1.0 (-1) | 996 (-1%) | 8mo | $140,000 | $141 | 59 |
| 20922 Negaunee St | 0.40mi | 2/1.0 (-1) | 915 (-9%) | 3mo | $169,900 | $186 | 58 |
| 22216 N Brandon St | 0.59mi | 3/1.5 | 1,080 (+7%) | 4mo | $280,000 | $259 | 56 |
| 21122 Waldron St | 0.72mi | 2/1.0 (-1) | 1,012 (+0%) | 6mo | $148,687 | $147 | 55 |
| 27516 Long St | 0.73mi | 3/1.0 | 954 (-5%) | 6mo | $193,500 | $203 | 52 |
| 20756 Van Buren St | 0.53mi | 3/1.0 | 1,135 (+13%) | 7mo | $219,200 | $193 | 48 |
| 20509 Poinciana | 0.65mi | 4/1.0 (+1) | 1,092 (+8%) | 4mo | $130,000 | $119 | 47 |
| 21112 Kinloch St | 0.69mi | 3/1.0 | 864 (-14%) | 6mo | $30,000 | $35 | 39 |
Match score weights: distance 35% · size 25% · config 20% · recency 20%. Top-matched comps best support the ARV.
Projected returns pro-forma
-3.0% appreciation · 0.0% rent growth · sell at horizon
- IRR
- -18.8%
- Equity multiple
- 0.36×
- Total profit
- $-29,515
- Equity at exit
- $24,602
- IRR
- -20.6%
- Equity multiple
- 0.09×
- Total profit
- $-41,897
- Equity at exit
- $14,266
Cash invested: $46,200 (down + closing). Projections, not guarantees.
Landlord ↔ Tenant lean methodology
- Overall (STATE)
- 62 Landlord-Friendly
- State Michigan
- 62 Landlord-Friendly · EVEN
- County
- — inherits STATE
- City
- — inherits STATE
ZIP-level market 48033
- Rents YoY
- -2.0%
- Active inventory
- 82
- Price-to-rent
- 8.0×
Monthly cashflow live
- Estimated rent
- $1,723 high interval (Pro) →
- Mortgage (P&I)
- −$865
- Tax from tax record
- −$394 /mo · $4,722/yr
- Insurance
- −$69
- HOA
- −$0
- Vacancy / Maint / Mgmt
- −$362
- Net cashflow
- $33
Break-even live
Sensitivity live
| Price | -10% $127 | -5% $80 | +0% $33 | +5% $-13 | +10% $-60 |
|---|---|---|---|---|---|
| Rent | -10% $-103 | -5% $-35 | +0% $33 | +5% $101 | +10% $170 |
| Rate | -1.0pp $117 | -0.5pp $75 | base $33 | +0.5pp $-9 | +1.0pp $-53 |
UW: 25.0% down · 7.5% · 30yr · 1.5% tax · 5.0% vac · 8.0% maint · 8.0% mgmt
Financing live
Cash to close
- Down payment
- $41,250
- Closing costs
- $4,950
- Reserves months
- —
- Total cash needed
- —
Loan-product check · same deal, 3 products live
Conventional
25% down · 7.5% · 30yr
- Down + closing
- —
- Monthly P&I
- —
- Monthly cashflow
- —
- DSCR
- —
- Eligible?
- —
Personal DTI + credit; lowest rate.
DSCR
20% down · 8.5% · 30yr
- Down + closing
- —
- Monthly P&I
- —
- Monthly cashflow
- —
- DSCR
- —
- Eligible?
- —
No personal income docs; deal must DSCR.
Hard money
10% down · 12.0% · 12mo
- Down + closing
- —
- Monthly P&I
- —
- Monthly cashflow
- —
- DSCR
- —
- Eligible?
- —
Short-term bridge; refi at stabilization.
Rent comps 13 comps
| Address | Beds | Baths | Sqft | Rent | $/sqft | DOM | Units | Dist |
|---|---|---|---|---|---|---|---|---|
| 27045 Shiawassee Rd Southfield, MI | 3.0 | 1.0 | 705 | $1,450 | $2.06 | 20d | 1 | 0.11mi |
| 21335 Negaunee Unit 1542196P Southfield, MI | 3.0 | 1.0 | 850 | $2,415 | $2.84 | 0d | 1 | 0.13mi |
| 21337 Inkster Rd Unit (NO) Farmington Hills, MI | 2.0 | 1.0 | 811 | $1,295 | $1.60 | 45d | 1 | 0.22mi |
| 20772 Indian St Southfield, MI | 4.0 | 1.0 | 1272 | $1,800 | $1.42 | 45d | 1 | 0.47mi |
| 20745 Saint Francis Unit 208 Farmington Hills, MI | 2.0 | 1.0 | 900 | $1,395 | $1.55 | 17d | 1 | 0.58mi |
| 20745 Saint Francis Unit 101 Farmington Hills, MI | 2.0 | 1.0 | 900 | $1,495 | $1.66 | 45d | 1 | 0.58mi |
| 20524 Indian Redford, MI | 3.0 | 1.0 | 988 | $1,600 | $1.62 | 26d | 1 | 0.64mi |
| 20516 Denby Redford, MI | 4.0 | 1.5 | 950 | $1,800 | $1.89 | 20d | 1 | 0.66mi |
| 20091 Inkster Rd Livonia, MI | 2.0 | 1.0 | 756 | $1,400 | $1.85 | 7d | 1 | 0.85mi |
| 28532 Grayling Ave Farmington Hills, MI | 2.0 | 1.0 | 700 | $1,395 | $1.99 | 26d | 1 | 0.88mi |
| 25740 Shiawassee St Southfield, MI | 1.0–2.0 | 1.0 | 850 | $1,253 | $1.47 | 45d | 10 | 1.09mi |
| 25400 Basin St Southfield, MI | 1.0–2.0 | 1.0 | 825 | $1,400 | $1.70 | 1d | 12 | 1.15mi |
| 19354 Seminole Redford, MI | 3.0 | 1.0 | 1050 | $1,450 | $1.38 | 26d | 1 | 1.35mi |
Listing history 50 events
-
2026-06-21days on market $165,000 Active 28 DOM
-
2026-06-18days on market $165,000 Active 25 DOM
-
2026-06-17days on market $165,000 Active 24 DOM
-
2026-06-16days on market $165,000 Active 23 DOM
-
2026-06-15days on market $165,000 Active 22 DOM
-
2026-06-13days on market $165,000 Active 20 DOM
-
2026-06-13days on market $165,000 Active 19 DOM
-
2026-06-09days on market $165,000 Active 16 DOM
-
2026-06-08days on market $165,000 Active 15 DOM
-
2026-06-07days on market $165,000 Active 14 DOM
-
2026-06-04days on market $165,000 Active 11 DOM
-
2026-06-03days on market $165,000 Active 10 DOM
-
2026-06-02days on market $165,000 Active 9 DOM
Show marketing remark (259 chars)
Great ranch home with 3 bedrooms and 1 bath. Nicely remodeled with fresh paint and ready for you. New floors throughout the house. New furnace 2026. Nice front and back yard. Excellent location! Certificate of occupancy has been approved by city of Southfield
-
2026-06-02price $165,000 Active 8 DOM
Show marketing remark (259 chars)
Great ranch home with 3 bedrooms and 1 bath. Nicely remodeled with fresh paint and ready for you. New floors throughout the house. New furnace 2026. Nice front and back yard. Excellent location! Certificate of occupancy has been approved by city of Southfield
-
2026-06-01days on market $167,900 Active 8 DOM
-
2026-05-31days on market $167,900 Active 7 DOM
-
2026-05-23price $167,900
Show marketing remark (259 chars)
Great ranch home with 3 bedrooms and 1 bath. Nicely remodeled with fresh paint and ready for you. New floors throughout the house. New furnace 2026. Nice front and back yard. Excellent location! Certificate of occupancy has been approved by city of Southfield
-
2026-05-22price $167,900
Show marketing remark (259 chars)
Great ranch home with 3 bedrooms and 1 bath. Nicely remodeled with fresh paint and ready for you. New floors throughout the house. New furnace 2026. Nice front and back yard. Excellent location! Certificate of occupancy has been approved by city of Southfield
-
2026-05-22historical $167,999
Show marketing remark (259 chars)
Great ranch home with 3 bedrooms and 1 bath. Nicely remodeled with fresh paint and ready for you. New floors throughout the house. New furnace 2026. Nice front and back yard. Excellent location! Certificate of occupancy has been approved by city of Southfield
-
2025-11-20historical
-
2025-11-20historical
-
2025-10-01price $161,000
-
2025-10-01price $161,000
-
2025-09-08price $168,000
-
2025-09-08price $168,000
-
2025-09-08$168,900 Active
-
2025-09-08$168,900 Active
-
2025-09-04historical
-
2025-09-04historical
-
2025-07-30price $170,000
-
2025-07-30price $170,000
-
2025-07-12price $175,000
-
2025-07-11price $175,000
-
2025-06-28$180,000 Active
-
2025-06-28$180,000 Active
-
2023-04-03soldstatus $137,000 Sold
-
2023-04-03soldstatus $137,000 Closed
-
2023-03-06status Pending
-
2023-03-06status Pending
-
2023-03-01status Active
-
2023-03-01status Active
-
2023-02-16status Pending
-
2023-02-16status Pending
-
2023-01-12$140,000 Active
-
2023-01-12$140,000 Active
-
2018-05-24soldstatus $93,000
-
2017-09-22soldstatus $93,000
-
2017-03-20soldstatus $55,000
-
2017-02-23soldstatus $55,000 Sold
-
2017-02-23soldstatus $55,000 Closed
ⓘ Source: listings_history table (triggers on properties + properties_extension) + one-shot
backfill from property_details.listing_events for pre-trigger history.
Tax reassessment forecast MI · Partial reset (capped growth)
- Current annual tax
- $4,722 · $394/mo
- Projected year-2 tax
- $4,722 · $394/mo
- Expected delta
- $0/yr ($0/mo · 0.0%)
ⓘ Screening estimate from a state-policy table — verify with the county assessor before closing.
Climate risk First Street
- Flood 1/10 Low FEMA zone X (unshaded) · 0% chance over 30 yrs
- Wildfire 1/10 Low
- Heat 3/10 Moderate 7 d/yr ≥97°F today · 15 d/yr by 30 yrs out
- Wind 2/10 Low
- Air quality 3/10 Moderate 2 unhealthy d/yr today · 3 by 30 yrs out
Nearby sold comps map
Loading sold comps map…
Walkable amenities ~0.75 mi
Loading nearby amenities…
Taxation est. · year 1
- Rental income
- $20,674
- − Mortgage interest
- −$9,243
- − Property taxes
- −$4,722
- − Insurance
- −$825
- − Repairs & maintenance
- −$1,654
- − Management
- −$1,654
- − Depreciation
- −$4,800
- Taxable loss
- −$2,224
- Est. tax savings @ 24.0%
- +$534
- After-tax cash flow
- $935/yr
For passive investors: Depreciation is non-cash, so a rental often shows a tax loss while cash-flowing — sheltering income. Rental losses are passive: they offset passive income freely, and up to $25,000/yr can offset ordinary (W-2) income if you actively participate and your MAGI is under $100k (phasing out to $0 by $150k); unused losses carry forward. On sale, claimed depreciation is recaptured at up to 25%, and gains may owe capital-gains tax (a 1031 exchange can defer both). Figures are a year-1 estimate at your 24.0% rate — not tax advice; consult a CPA.
Schools (NCES district)
- District
- Southfield Public School District
- NCES district ID
- 2632310
- Math proficiency
- 17% ▼ -3.00%
- Reading proficiency
- 37% ▲ 1.00%
- Median HH income
- $51,400
- Composite
- 23.77/100
- National rank
- #7814
- State rank
- #392 of 540 in MI
Livability — Southfield
- Score
- 72/100
- State rank
- #248
- US rank
- #6175
Category grades
Schools grade is shown separately in the Schools card above.
Census & demographics
- Census place
- Southfield, MI
- County
- Oakland County · 1,009,092 people
- City population
- 54,914
- Metro
- Detroit-Warren-Dearborn, MI
- Population (ZIP)
- 17,277
- Household income
- $61,016
- Rent vs Own
- Severe rent burden
- 1166.0
Population outlook (Oakland County) Hauer SSP2
- Today (2025)
- 1,335,747 people
- By 2030
- 1,375,100 · +2.9%
- By 2040
- 1,435,385 · +7.5%
- By 2050
- 1,469,250 · +10.0%
- By 2075
- 1,531,946 · +14.7%
- By 2100
- 1,450,485 · +8.6%
Race, ethnicity, and origin ACS 2023
- Neighborhood character
- Predominantly Black (68%)
- Race & ethnicity
- Black 68% White 24% Two or more races 6% Asian 2% Hispanic / Latino 1%
- Common ancestry
- Romanian 3% Scotch-Irish 1% Slovak 1%
- Foreign-born
- 6% · Canada
- Languages at home
- 92% English-only · Spanish 1% Arabic 1% Russian/Polish/Slavic 1%
Political lean MEDSL · Oakland
- 2024 margin
- D (+10.6) · D 54.4% · R 43.8% · Other 1.9%
- 2008→2024 swing
- -3.9pp toward R · 2008: 14.5pp · 2024: 10.6pp
- All cycles
- 2024: D+10.6 2020: D+14.1 2016: D+8.1 2012: D+8.1 2008: D+14.5
Not yet ingested
- Civics
- —
Market trends
- HPI YoY
- ▼ -175.44%
- Current HPI
- 187.5011
- Rent YoY
- ▼ -1.96%
- Metro
- Detroit-Warren-Dearborn, MI
- State GDP YoY
- ▲ 1.37%
- F500 in state
- 28
Industry mix (Fortune 500 HQ in MI)
| Industry | F500 HQs | Revenue |
|---|---|---|
| Automotive Parts | 3 | $48B |
|
||
| Automotive | 2 | $372B |
|
||
| Chemicals | 1 | $45B |
|
||
| Automotive Retail | 1 | $29B |
|
||
| Healthcare / Medical Devices | 1 | $23B |
|
||
| Automotive Technology | 1 | $20B |
|
||
Price history
-98.5% since first listed59 events — show timeline
- 2026-06-09 Listed for Rent $1,600 REALSOURCE
- 2026-06-02 Price Changed $165,000 MiRealSource-MiMLS
- 2026-06-01 Price Changed $165,000 REALCOMP
- 2026-05-25 Listed $167,900 MiRealSource-MiMLS
- 2026-05-25 Listed $167,900 REALCOMP
- 2026-05-23 Price Changed $167,900 MiRealSource-MiMLS
- 2026-05-22 Price Changed $167,900 REALCOMP
- 2026-05-22 Coming Soon $167,999 MiRealSource-MiMLS
- 2025-11-20 Listing Removed — REALCOMP
- 2025-11-20 Listing Removed — MiRealSource-MiMLS
- 2025-10-01 Price Changed $161,000 MiRealSource-MiMLS
- 2025-10-01 Price Changed $161,000 REALCOMP
- 2025-09-08 Price Changed $168,000 MiRealSource-MiMLS
- 2025-09-08 Price Changed $168,000 REALCOMP
- 2025-09-08 Listed $168,900 REALCOMP
- 2025-09-08 Listed $168,900 MiRealSource-MiMLS
- 2025-09-04 Listing Removed — MiRealSource-MiMLS
- 2025-09-04 Listing Removed — REALCOMP
- 2025-07-30 Price Changed $170,000 MiRealSource-MiMLS
- 2025-07-30 Price Changed $170,000 REALCOMP
- 2025-07-12 Price Changed $175,000 MiRealSource-MiMLS
- 2025-07-11 Price Changed $175,000 REALCOMP
- 2025-06-28 Listed $180,000 REALCOMP
- 2025-06-28 Listed $180,000 MiRealSource-MiMLS
- 2023-04-03 Sold (MLS) $137,000 MiRealSource-MiMLS
- 2023-04-03 Sold (MLS) $137,000 REALCOMP
- 2023-03-06 Pending — REALCOMP
- 2023-03-06 Pending — MiRealSource-MiMLS
- 2023-03-01 Relisted — MiRealSource-MiMLS
- 2023-03-01 Relisted — REALCOMP
- 2023-02-16 Pending — REALCOMP
- 2023-02-16 Pending — MiRealSource-MiMLS
- 2023-01-12 Listed $140,000 MiRealSource-MiMLS
- 2023-01-12 Listed $140,000 REALCOMP
- 2018-05-24 Sold (Public Records) $93,000 Public Records
- 2017-09-22 Sold (Public Records) $93,000 Public Records
- 2017-03-20 Sold (Public Records) $55,000 Public Records
- 2017-02-23 Sold (MLS) $55,000 MiRealSource-MiMLS
- 2017-02-23 Sold (MLS) $55,000 REALCOMP
- 2017-02-02 Pending — MiRealSource-MiMLS
- 2017-02-02 Pending — REALCOMP
- 2017-01-24 Listed $59,900 MiRealSource-MiMLS
- 2017-01-23 Listed $59,900 REALCOMP
- 2014-02-14 Sold (MLS) $871 MiRealSource-MiMLS
- 2014-02-12 Listing Removed — MiRealSource-MiMLS
- 2013-09-18 Listed $895 MiRealSource-MiMLS
- 2010-07-20 Sold (MLS) $15,000 REALCOMP
- 2010-06-01 Listed $19,900 REALCOMP
- 2007-03-28 Listing Removed — REALCOMP
- 2006-07-29 Listed $106,000 REALCOMP
- 2006-06-04 Listing Removed — REALCOMP
- 2006-02-27 Listed $114,900 REALCOMP
- 2002-04-29 Sold (Public Records) $90,000 Public Records
- 2002-02-26 Sold (MLS) $90,000 REALCOMP
- 2002-01-08 Listed $89,000 REALCOMP
- 2000-06-22 Listing Removed — REALCOMP
- 2000-01-05 Listed $99,900 REALCOMP
- 1999-11-18 Listing Removed — REALCOMP
- 1999-10-19 Listed $104,000 REALCOMP
Property tax history
+14.9%/yrLatest (2025): $4,722 · +3.1% YoY. Source: county tax records.
Cash-flow waterfall
monthlySold comps — $/sqft
last 12 mo · ≤1 miLoading sold comps…