 🏗️ New Construction
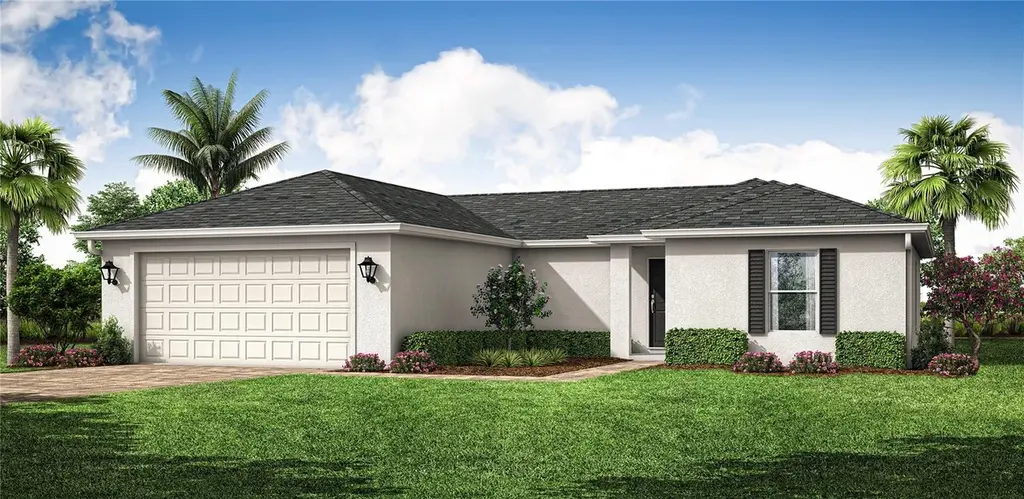
23437 Steeple Ave · Port Charlotte, FL
Flood risk 6/10 · Moderate
- FEMA flood zone
- X (unshaded)
- Chance of flooding over 30 yrs
- 0.57%
- Est. flood insurance / yr
- $507 – $1,088
Fire risk 2/10 · Minimal
- Est. fire insurance / yr
- $947 – $1,759
Heat risk 10/10 · Severe
- Hot days now (above 107°F)
- 6 days/yr
- Hot days in 30 yrs
- 22 days/yr
Wind risk 10/10 · Severe
- Chance of severe wind over 30 yrs
- 99.0%
Air-quality risk 3/10 · Minor
- Unhealthy air days now
- 2 days/yr
- Unhealthy air days in 30 yrs
- 2 days/yr
Risk factors via First Street. Map © Google.
Why this score? — see what drove the D- grade
The composite is a weighted blend of 9 inputs, each scored 0–100. Each bar is that input's sub-score; the figure is the points it added to the 100-point composite (weight × sub-score).
- Cash flow +12.8/30.0
- ARV discount +7.5/15.0
- Schools +4.6/10.0
- DSCR +3.8/10.0
- 1% rule +3.6/10.0
- Livability +3.2/5.0
- Condition / age +2.5/5.0
- Rent growth +1.5/5.0
- Appreciation +0.0/10.0
$294,990
🖨 Deal sheet (PDF) 📄 Offer letter ✓ Due diligence
Listing remarks
Under Construction. NEW BUILD - Anticipated completion date is AUGUST 2026. SPECIAL INCENTIVES: 4.99% Interest Rate on a FHA/VA 30-Year Fixed Loan with up to $10,000 Closing Cost Credit. .. OR. .. UP TO $20,000 towards CLOSING COST / PREPAIDS shall not exceed 6% of purchase price when using a preferred lender. The 1,426 -square-foot (air-conditioned) Windsor plan boasts a well-designed open floor plan that includes four bedrooms, two bathrooms, and a two-car garage. The kitchen boasts upgraded 30” contemporary shaker-style cabinets, a spacious kitchen island with upgraded quartz countertops, Whirlpool dishwasher, microwave, and range, refrigerator, washer & dryer. The Kitchen ov
Key facts
- 0.23 acre lot
- 2 garage spots
- Built 2026
Property features AI
Finance
- Other: Under construction; Living area reported by builder; Builder license CBC1262095
- HOA & community: No association indicated
Exterior
- Parking: Attached 2-car garage
- Utilities: Public water; Septic tank; Cable available
- Home design: Single family residence; New construction (projected completion September 2026); One level; North-facing
- Construction: Block, concrete and stucco construction; Shingle roof; Slab foundation; Builder: Coaston Homes LLC (model: Windsor)
- Exterior features: Paved road access; Lot dimensions approximately 80 x 125; Lot about 0.23 acres
Interior
- Kitchen: Dishwasher; Range; Microwave; Refrigerator
- Bedrooms: 4 bedrooms
- Flooring: Carpet; Ceramic tile
- Bathrooms: 2 full bathrooms
- Heating & cooling: Central heating; Central air conditioning
- Interior features: Kitchen/family room combo; Open floorplan; Solid surface counters; Vaulted ceilings; Walk-in closets
- Laundry & utility: Laundry closet; Washer and dryer included (appliances listed: dryer)
Neighborhood map
What this means for you Summary
Snapshot
- This is a 4-bed/2.0-bath land listed at $295k.
Deal economics
- At list price, monthly cash flow is $-25 ($-294/yr) — negative.
- To cash-flow at today's rent, offer at most $291k (1.2% below list).
- To meet the 1% rule (rent ≥ 1% of price), the offer needs to be $255k (13.6% below list).
- Recommended offer: $255k (13.6% below list) — sets the bar for 1% rule.
- Cap rate 6.2% vs local median 4.4% in Port Charlotte — top-decile yield for the area; either an underpriced asset or a hidden risk that comps aren't pricing in. Stress-test before assuming the spread holds.
Location & tenants
- Location reads 65/100 on livability (#655 in FL) — a middle-class / working-renter tenant base. Strengths: cost of living A+, housing A+; Watch: employment D, amenities F, commute F.
- Charlotte (suburban): math 54% / reading 54% proficiency, ranked #22 of 73 in FL (top 30%) — acceptable for families but not a draw, mixed tenant base, ~2y average lease.
- Zoned schools: Kingsway Elementary School (math 55% / reading 53%, grade C, #936 of 2,144 statewide, top 44%, 596 students, 58% FRL); Port Charlotte Middle School (math 59% / reading 50%, grade B-, #183 of 571 statewide, top 34%, 877 students, 55% FRL); Charlotte High School (math 44% / reading 46%, grade D-, #228 of 667 statewide, top 35%, 1,994 students, 41% FRL) — zoned schools at 51% FRL track the district average.
- Market conditions: Rents falling (-4.0%/yr); 603 active listings in the ZIP; 8 comparable units currently listed for rent nearby; rentals at typical pace (median 23d on market — plan ~3-4 weeks tenant-placement turnaround); 4,585 units permitted in Charlotte County in 2024 (703 in 5+ unit buildings).
- At $2,549/mo this rent would consume 48% of the median local household income ($64k/yr) (locally 612% of renters already pay >50% of income on rent) — very limited rent-growth headroom before tenants either downsize or default.
Forward outlook
- Local home prices are declining (-3.0%/yr); year-one equity from $2k of loan paydown is wiped out by about $9k of value loss. Plan a longer hold.
- Charlotte County population projected at +24% by 2050 — long-run rental-demand tailwind backs the buy-and-hold thesis.
Negotiation context
- It's been on market 26 days — a 2% lower offer ($291k) is reasonable based on typical stale-listing flexibility.
- Current owner paid $16k; list at $295k implies a 1744% gain — meaningful room to come down on a strong offer.
Risks & watch-outs
- Climate carrying-cost: major flood risk; severe wind risk, 99% chance of damaging wind over 30y; extreme-heat days projected 6→22/yr by 2055 (HVAC capex compounding) — expect insurance premiums to compound above CPI over the hold.
Questions for the listing agent
- What do current leases actually rent for vs. the listed asking? Can we see a recent rent roll and the last 12 months of T-12 income?
- Is there a deadline driving the sale (1031 exchange, divorce, estate, relocation)? That informs how much negotiation room exists.
- Schools are D-rated, which usually means shorter tenancies and higher turnover. Who's the typical renter profile here, and what's been the actual vacancy rate?
- The area grade is low — what's the realistic commute time and amenity access for the typical tenant pool here? Any planned neighborhood developments (good or bad) we should know about?
- This sits on a lake — are riparian / water-frontage rights deeded with the parcel? Any dock permits, shoreline easements, or HOA water-use restrictions?
- What's the documented flood / surge / shoreline-erosion history here (FEMA AND non-FEMA — e.g., storm surge, creek backup, septic-field saturation)?
- Any water-quality or seasonal algae-bloom issues that affect tenant satisfaction or short-term-rental demand?
- What's the average days-on-market for RENTAL listings here right now (not sales)? A rising rental-DOM trend means longer vacancies and softer asking-rent achievability than the comps imply.
- What's the recent tenant-quality profile in this submarket — average credit score on applications, eviction rate, late-payment / NSF rate, and stable-employment percentage? A property-management company in the area should have these aggregated.
- How much new for-sale + rental construction is in the pipeline within 1–3 miles? Heavy new supply typically softens prices + rents 12–24 months out; constrained supply supports both.
Investment metrics
- 1% rule
- 0.86% ✗
- Cap rate
- 6.19%
- Cash-on-cash
- -0.36%
- DSCR
- 0.98
- GRM
- 9.6
CMA / ARV
No comps found within radius.
Projected returns pro-forma
-3.0% appreciation · 0.0% rent growth · sell at horizon
- IRR
- -20.3%
- Equity multiple
- 0.31×
- Total profit
- $-56,797
- Equity at exit
- $43,984
- IRR
- -21.9%
- Equity multiple
- 0.03×
- Total profit
- $-80,188
- Equity at exit
- $25,505
Cash invested: $82,597 (down + closing). Projections, not guarantees.
Landlord ↔ Tenant lean methodology
- Overall (STATE)
- 87 Strongly Landlord-Friendly
- State Florida
- 87 Strongly Landlord-Friendly · R+3
- County
- — inherits STATE
- City
- — inherits STATE
ZIP-level market 33980
- Home prices YoY
- -5.0%
- Rents YoY
- -4.0%
- Active inventory
- 603
- Price-to-rent
- 9.6×
Monthly cashflow live
- Estimated rent
- $2,549 high interval (Pro) →
- Mortgage (P&I)
- −$1,547
- Tax est. 1.5%
- −$369 /mo · $4,425/yr
- Insurance
- −$123
- HOA
- −$0
- Vacancy / Maint / Mgmt
- −$535
- Net cashflow
- $-25
Break-even live
Sensitivity live
| Price | -10% $179 | -5% $77 | +0% $-25 | +5% $-126 | +10% $-228 |
|---|---|---|---|---|---|
| Rent | -10% $-226 | -5% $-125 | +0% $-25 | +5% $76 | +10% $177 |
| Rate | -1.0pp $124 | -0.5pp $50 | base $-25 | +0.5pp $-101 | +1.0pp $-179 |
UW: 25.0% down · 7.5% · 30yr · 1.5% tax · 5.0% vac · 8.0% maint · 8.0% mgmt
Financing live
Cash to close
- Down payment
- $73,748
- Closing costs
- $8,850
- Reserves months
- —
- Total cash needed
- —
Loan-product check · same deal, 3 products live
Conventional
25% down · 7.5% · 30yr
- Down + closing
- —
- Monthly P&I
- —
- Monthly cashflow
- —
- DSCR
- —
- Eligible?
- —
Personal DTI + credit; lowest rate.
DSCR
20% down · 8.5% · 30yr
- Down + closing
- —
- Monthly P&I
- —
- Monthly cashflow
- —
- DSCR
- —
- Eligible?
- —
No personal income docs; deal must DSCR.
Hard money
10% down · 12.0% · 12mo
- Down + closing
- —
- Monthly P&I
- —
- Monthly cashflow
- —
- DSCR
- —
- Eligible?
- —
Short-term bridge; refi at stabilization.
Rent comps 8 comps
| Address | Beds | Baths | Sqft | Rent | $/sqft | DOM | Units | Dist |
|---|---|---|---|---|---|---|---|---|
| 23367 Mayville Ave Punta Gorda, FL | 4.0 | 2.0 | 1532 | $2,300 | $1.50 | 22d | 1 | 0.29mi |
| 3185 Clifford St Port Charlotte, FL | 3.0 | 2.0 | 1776 | $2,400 | $1.35 | 15d | 1 | 0.91mi |
| 24055 Peaceful Brook Loop Punta Gorda, FL | 3.0–5.0 | 2.0–3.0 | 2138 | $2,242 | $1.05 | 15d | 4 | 0.99mi |
| 1516 Abel St Port Charlotte, FL | 3.0 | 2.0 | 1874 | $2,200 | $1.17 | 22d | 1 | 1.06mi |
| 1314 Beacon Dr Port Charlotte, FL | 3.0 | 2.0 | 1783 | $2,500 | $1.40 | 22d | 1 | 1.28mi |
| 1200 Loveland Blvd Punta Gorda, FL | 1.0–3.0 | 1.0–2.0 | 1151 | $2,660 | $2.31 | 15d | 276 | 1.32mi |
| 1867 Nottingham Trl Punta Gorda, FL | 3.0 | 2.0 | 1646 | $2,000 | $1.22 | 22d | 1 | 1.32mi |
| 2377 Starlite Ln Port Charlotte, FL | 3.0 | 1.5 | 1253 | $1,575 | $1.26 | 22d | 1 | 1.37mi |
Listing history 20 events
-
2026-06-22days on market $294,990 Active 26 DOM
-
2026-06-18days on market $294,990 Active 23 DOM
-
2026-06-17days on market $294,990 Active 22 DOM
-
2026-06-16days on market $294,990 Active 21 DOM
-
2026-06-15days on market $294,990 Active 20 DOM
-
2026-06-14days on market $294,990 Active 18 DOM
-
2026-06-13days on market $294,990 Active 17 DOM
-
2026-06-10days on market $294,990 Active 15 DOM
-
2026-06-09days on market $294,990 Active 14 DOM
-
2026-06-08days on market $294,990 Active 13 DOM
-
2026-06-07days on market $294,990 Active 12 DOM
-
2026-06-05days on market $294,990 Active 9 DOM
-
2026-06-03days on market $294,990 Active 8 DOM
-
2026-06-02days on market $294,990 Active 7 DOM
-
2026-06-01days on market $294,990 Active 6 DOM
-
2026-05-31days on market $294,990 Active 5 DOM
-
2026-05-30days on market $294,990 Active 4 DOM
-
2026-05-26$294,990 Active
-
2026-02-12soldstatus $16,000
-
2005-06-15soldstatus $20,000
ⓘ Source: listings_history table (triggers on properties + properties_extension) + one-shot
backfill from property_details.listing_events for pre-trigger history.
Climate risk First Street
- Flood 6/10 Major FEMA zone X (unshaded) · 57% chance over 30 yrs
- Wildfire 2/10 Low
- Heat 10/10 Extreme 6 d/yr ≥107°F today · 22 d/yr by 30 yrs out
- Wind 10/10 Extreme 99% chance of damaging wind over 30 yrs
- Air quality 3/10 Moderate 2 unhealthy d/yr today · 2 by 30 yrs out
Nearby sold comps map
Loading sold comps map…
Walkable amenities ~0.75 mi
Loading nearby amenities…
Taxation est. · year 1
- Rental income
- $30,594
- − Mortgage interest
- −$16,524
- − Property taxes
- −$4,425
- − Insurance
- −$1,475
- − Repairs & maintenance
- −$2,447
- − Management
- −$2,447
- − Depreciation
- −$8,582
- Taxable loss
- −$5,307
- Est. tax savings @ 24.0%
- +$1,274
- After-tax cash flow
- $979/yr
For passive investors: Depreciation is non-cash, so a rental often shows a tax loss while cash-flowing — sheltering income. Rental losses are passive: they offset passive income freely, and up to $25,000/yr can offset ordinary (W-2) income if you actively participate and your MAGI is under $100k (phasing out to $0 by $150k); unused losses carry forward. On sale, claimed depreciation is recaptured at up to 25%, and gains may owe capital-gains tax (a 1031 exchange can defer both). Figures are a year-1 estimate at your 24.0% rate — not tax advice; consult a CPA.
Schools (NCES district)
- District
- Charlotte
- NCES district ID
- 1200240
- Math proficiency
- 54% ▼ -6.00%
- Reading proficiency
- 54% ▼ -1.00%
- Median HH income
- $44,864
- Composite
- 45.62/100
- National rank
- #2586
- State rank
- #22 of 73 in FL
Livability — Port Charlotte
- Score
- 65/100
- State rank
- #655
- US rank
- #13081
Category grades
Schools grade is shown separately in the Schools card above.
Census & demographics
- Census place
- Port Charlotte, FL
- County
- Charlotte County · 196,994 people
- City population
- 102,180
- Metro
- Punta Gorda, FL
- Population (ZIP)
- 13,120
- Household income
- $63,591
- Rent vs Own
- Severe rent burden
- 612.0
Population outlook (Charlotte County) Hauer SSP2
- Today (2025)
- 198,646 people
- By 2030
- 210,507 · +6.0%
- By 2040
- 230,857 · +16.2%
- By 2050
- 247,148 · +24.4%
- By 2075
- 281,777 · +41.8%
- By 2100
- 293,609 · +47.8%
Race, ethnicity, and origin ACS 2023
- Neighborhood character
- Predominantly White (75%)
- Race & ethnicity
- White 75% Hispanic / Latino 10% Two or more races 10% Black 9%
- Hispanic origin (detail)
- Puerto Rican 3% Cuban 2% Dominican 2%
- Common ancestry
- Romanian 5% Hispanic 4% Slovak 3%
- Foreign-born
- 16% · Canada, Jamaica
- Languages at home
- 85% English-only · Spanish 8% French/Haitian/Cajun 5% German/W. Germanic 1%
Political lean MEDSL · Charlotte
- 2024 margin
- Solid R (+34.0) · D 32.7% · R 66.7%
- 2008→2024 swing
- -26.7pp toward R · 2008: -7.2pp · 2024: -34.0pp
- All cycles
- 2024: R+34.0 2020: R+26.6 2016: R+27.8 2012: R+14.3 2008: R+7.2
Not yet ingested
- Civics
- —
Market trends
- HPI YoY
- ▼ -16.02%
- Current HPI
- 306.3331
- Rent YoY
- ▼ -4.04%
- Metro
- Punta Gorda, FL
- State GDP YoY
- ▲ 3.28%
- F500 in state
- 36
Industry mix (Fortune 500 HQ in FL)
| Industry | F500 HQs | Revenue |
|---|---|---|
| Industrial Technology | 2 | $29B |
|
||
| Insurance | 2 | $17B |
|
||
| Retail | 1 | $60B |
|
||
| Technology Distribution | 1 | $58B |
|
||
| Homebuilding | 1 | $35B |
|
||
| Technology Manufacturing | 1 | $35B |
|
||
Price history
+1375.0% since first listed3 events — show timeline
- 2026-05-26 Listed $294,990 Stellar MLS as Distributed by MLS Grid
- 2026-02-12 Sold (Public Records) $16,000 Public Records
- 2005-06-15 Sold (Public Records) $20,000 Public Records
Property tax history
+3.8%/yrLatest (2025): $488 · -0.6% YoY. Source: county tax records.
Cash-flow waterfall
monthlySold comps — $/sqft
last 12 mo · ≤1 miLoading sold comps…