3137 Rainbow Loop · Hubbard, OR
Flood risk 1/10 · Minimal
- FEMA flood zone
- X (unshaded)
- Chance of flooding over 30 yrs
- 0.0%
- Est. flood insurance / yr
- $507 – $1,088
Fire risk 4/10 · Minor
- Est. fire insurance / yr
- $498 – $926
Heat risk 3/10 · Minor
- Hot days now (above 91°F)
- 7 days/yr
- Hot days in 30 yrs
- 14 days/yr
Wind risk 1/10 · Minimal
- Chance of severe wind over 30 yrs
- —
Air-quality risk 10/10 · Severe
- Unhealthy air days now
- 13 days/yr
- Unhealthy air days in 30 yrs
- 14 days/yr
Risk factors via First Street. Map © Google.
Why this score? — see what drove the B grade
The composite is a weighted blend of 9 inputs, each scored 0–100. Each bar is that input's sub-score; the figure is the points it added to the 100-point composite (weight × sub-score).
- Cash flow +30.0/30.0
- ARV discount +10.7/15.0
- 1% rule +10.0/10.0
- DSCR +10.0/10.0
- Livability +4.0/5.0
- Schools +3.4/10.0
- Condition / age +2.8/5.0
- Rent growth +2.5/5.0
- Appreciation +0.0/10.0
$66,900
🖨 Deal sheet 📄 Offer letter ✓ Due diligence
Listing remarks
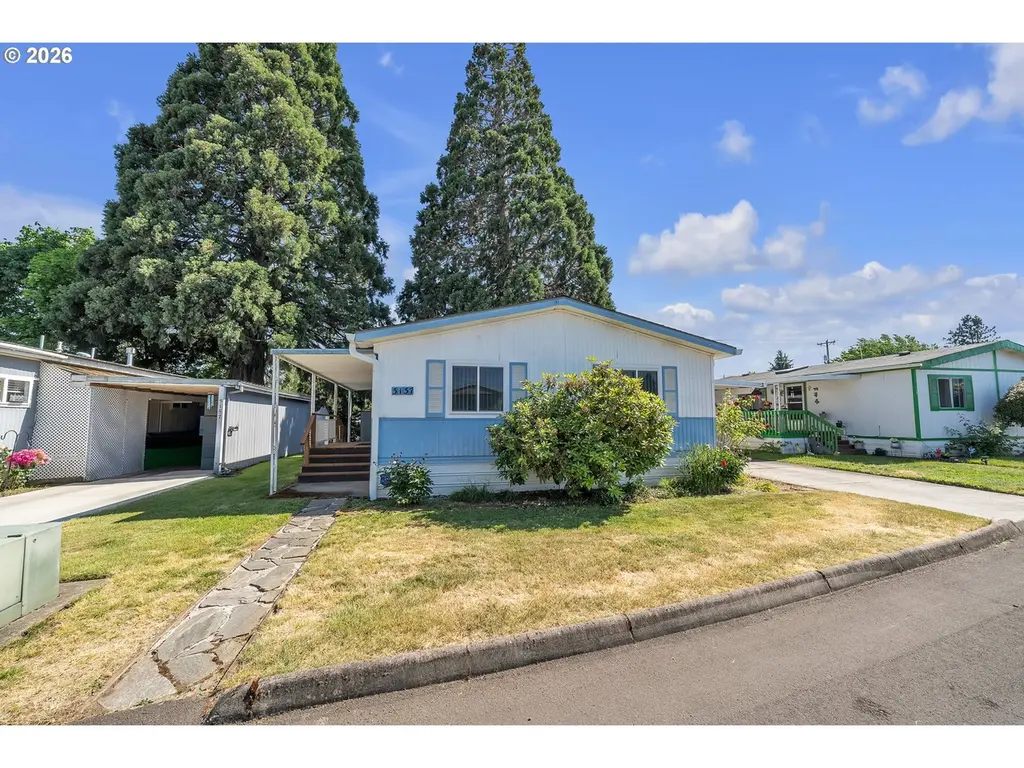
Well maintained Belmont double wide Manufactured Home in Hoodview Mobile Estates, 55+ community. This 2 bedroom, 2 bathroom home features a covered front porch with deck, skylight in the living room for abundant natural light, ceiling fan, and quality Sears vinyl windows throughout. Exterior features include durable aluminum siding, a carport with attached workshop complete with workbench and electricity, plus an additional storage shed in the backyard. Enjoy comfortable living in a quiet community setting with mature surroundings and a welcoming atmosphere.
Key facts
- Covered front porch
- Built 1984
- Listed 23 days
Tags
Property features AI
Finance
- Other: Lot size range: under 3,000 sq ft; Parcel number 130095
- Financial info: Land lease expires December 31, 2026
- HOA & community: Land lease in effect (park monthly lot rent $825); Park name: Hoodview Mobil Esttes; Senior community; Pet policy allows either 2 cats or 1 small dog
Exterior
- Parking: Carport; Driveway
- Utilities: Electricity; Public water; Public sewer
- Home design: Manufactured home in a park (residential); Single-story (main level living); Built in 1984; No view
- Construction: Composition roof; Skirting foundation; Manufacturer: BELMOUNT
- Exterior features: Covered deck; Tool shed; Aluminum exterior
Interior
- Kitchen: Free-standing range; Free-standing refrigerator
- Bedrooms: Primary bedroom (main level); Second bedroom (main level)
- Bathrooms: 2 full bathrooms (both on main level)
- Heating & cooling: Heat pump for heating and cooling
- Interior features: Vinyl window frames; Family room; Great room; Dining room; Living room
Neighborhood map
What this means for you Summary
Snapshot
- This is a 2-bed/2.0-bath manufactured listed at $67k. Condition is rated average.
Deal economics
- At list price, monthly cash flow is $924 ($11k/yr) — positive.
- The deal already cash-flows at list — no discount required.
- Meets the 1% rule at list price ($2k rent vs $67k).
- Recommended offer: $66k (1.5% below list) — sets the bar for market timing.
Location & tenants
- Location reads 80/100 on livability (#57 in OR, #1,930 nationally) — a professional / high-income tenant draw. Strengths: crime A+, employment A+, housing A+; Watch: cost of living C-, health & safety D+, amenities F.
- North Marion SD 15 (rural): math 27% / reading 43% proficiency, ranked #131 of 183 in OR (top 72%) — families likely to look elsewhere, expect single-tenant / working-renter base with shorter leases.
- Zoned schools: North Marion Primary School (326 students, 58% FRL); North Marion Middle School (math 12% / reading 27%, grade F, #124 of 128 statewide, top 98%, 385 students, 52% FRL); North Marion High School (math 10% / reading 50%, grade F, #107 of 143 statewide, top 78%, 603 students, 45% FRL) — zoned schools at 52% FRL track the district average.
- Market conditions: 20 active listings in the ZIP; 1,591 units permitted in Marion County in 2024 (716 in 5+ unit buildings).
Forward outlook
- Local home prices are declining (-3.0%/yr); year-one equity from $463 of loan paydown is wiped out by about $2k of value loss. Plan a longer hold.
- Marion County population projected at +17% by 2050 — long-run rental-demand tailwind backs the buy-and-hold thesis.
- At projected returns (-3.0% appreciation + 3.0% rent growth), your $19k cash investment doubles in ~2 years — after that, you're playing with house money.
Negotiation context
- It's been on market 23 days — a 2% lower offer ($66k) is reasonable based on typical stale-listing flexibility.
Questions for the listing agent
- Is there a deadline driving the sale (1031 exchange, divorce, estate, relocation)? That informs how much negotiation room exists.
- Schools are D-rated, which usually means shorter tenancies and higher turnover. Who's the typical renter profile here, and what's been the actual vacancy rate?
- What's the average days-on-market for RENTAL listings here right now (not sales)? A rising rental-DOM trend means longer vacancies and softer asking-rent achievability than the comps imply.
- What's the recent tenant-quality profile in this submarket — average credit score on applications, eviction rate, late-payment / NSF rate, and stable-employment percentage? A property-management company in the area should have these aggregated.
- How much new for-sale + rental construction is in the pipeline within 1–3 miles? Heavy new supply typically softens prices + rents 12–24 months out; constrained supply supports both.
Investment metrics
- 1% rule
- 2.62% ✓
- Cap rate
- 22.86%
- Cash-on-cash
- 59.17%
- DSCR
- 3.63
- GRM
- 3.2
CMA / ARV
- ARV (on-the-fly)
- $72,000
- Comps found
- 8
Show comp detail 8 sales within ~0.75 mi
| Address | Dist | Beds/Ba | Sqft | Sold | Price | $/sf | Match |
|---|---|---|---|---|---|---|---|
| 3197 Rainbow Loop #10 | 0.07mi | 2/2.0 | 1,056 (+10%) | 5mo | $55,000 | $52 | 76 |
| 3457 Rainbow Loop | 0.11mi | 2/2.0 | 1,008 (+5%) | 22mo | $75,500 | $75 | 68 |
| 3370 Maple St #44 | 0.53mi | 3/1.0 (+1) | 972 (+1%) | 1mo | $106,000 | $109 | 63 |
| 3367 Rainbow Loop #18 | 0.12mi | 3/1.0 (+1) | 985 (+3%) | 22mo | $75,000 | $76 | 63 |
| 3289 Ash St #61 | 0.49mi | 3/2.0 (+1) | 1,056 (+10%) | 2mo | $61,500 | $58 | 54 |
| 3486 Rainbow Loop | 0.07mi | 3/2.0 (+1) | 1,092 (+14%) | 21mo | $60,000 | $55 | 51 |
| 3486 Rainbow Lp #28 | 0.07mi | 3/1.5 (+1) | 1,092 (+14%) | 21mo | $60,000 | $55 | 49 |
| 3933 Lindsey Ave #41 | 0.33mi | 3/2.0 (+1) | 1,080 (+12%) | 24mo | $155,000 | $144 | 39 |
Match score weights: distance 35% · size 25% · config 20% · recency 20%. Top-matched comps best support the ARV.
Projected returns pro-forma
-3.0% appreciation · 3.0% rent growth · sell at horizon
- IRR
- 57.8%
- Equity multiple
- 3.56×
- Total profit
- $48,008
- Equity at exit
- $9,975
- IRR
- 62.7%
- Equity multiple
- 7.28×
- Total profit
- $117,656
- Equity at exit
- $5,784
Cash invested: $18,732 (down + closing). Projections, not guarantees.
Landlord ↔ Tenant lean methodology
- Overall (STATE)
- 28 Tenant-Leaning
- State Oregon
- 28 Tenant-Leaning · D+6
- County
- — inherits STATE
- City
- — inherits STATE
ZIP-level market 97032
- Home prices YoY
- -27.9%
- Active inventory
- 20
- Price-to-rent
- 3.2×
Monthly cashflow live
- Estimated rent
- $1,754 medium interval (Pro) →
- Mortgage (P&I)
- −$351
- Tax est. 1.5%
- −$84 /mo · $1,004/yr
- Insurance
- −$28
- HOA
- −$0
- Vacancy / Maint / Mgmt
- −$368
- Net cashflow
- $924
Break-even live
UW: 25.0% down · 7.5% · 30yr · 1.5% tax · 5.0% vac · 8.0% maint · 8.0% mgmt
Financing live
Cash to close
- Down payment
- $16,725
- Closing costs
- $2,007
- Reserves months
- —
- Total cash needed
- —
Loan-product check · same deal, 3 products live
Conventional
25% down · 7.5% · 30yr
- Down + closing
- —
- Monthly P&I
- —
- Monthly cashflow
- —
- DSCR
- —
- Eligible?
- —
Personal DTI + credit; lowest rate.
DSCR
20% down · 8.5% · 30yr
- Down + closing
- —
- Monthly P&I
- —
- Monthly cashflow
- —
- DSCR
- —
- Eligible?
- —
No personal income docs; deal must DSCR.
Hard money
10% down · 12.0% · 12mo
- Down + closing
- —
- Monthly P&I
- —
- Monthly cashflow
- —
- DSCR
- —
- Eligible?
- —
Short-term bridge; refi at stabilization.
Listing history 14 events
-
2026-06-18days on market $66,900 Active 23 DOM
-
2026-06-17days on market $66,900 Active 22 DOM
-
2026-06-16days on market $66,900 Active 21 DOM
-
2026-06-15days on market $66,900 Active 20 DOM
-
2026-06-13days on market $66,900 Active 18 DOM
-
2026-06-13days on market $66,900 Active 17 DOM
-
2026-06-09days on market $66,900 Active 14 DOM
-
2026-06-08days on market $66,900 Active 13 DOM
-
2026-06-07days on market $66,900 Active 12 DOM
-
2026-06-03days on market $66,900 Active 8 DOM
-
2026-06-02days on market $66,900 Active 7 DOM
-
2026-06-01days on market $66,900 Active 6 DOM
-
2026-05-31days on market $66,900 Active 5 DOM
-
2026-05-26$66,900 Active
ⓘ Source: listings_history table (triggers on properties + properties_extension) + one-shot
backfill from property_details.listing_events for pre-trigger history.
Climate risk First Street
- Flood 1/10 Low FEMA zone X (unshaded) · 0% chance over 30 yrs
- Wildfire 4/10 Moderate
- Heat 3/10 Moderate 7 d/yr ≥91°F today · 14 d/yr by 30 yrs out
- Wind 1/10 Low
- Air quality 10/10 Extreme 13 unhealthy d/yr today · 14 by 30 yrs out
Nearby sold comps map
Loading sold comps map…
Walkable amenities ~0.75 mi
Loading nearby amenities…
Taxation est. · year 1
- Rental income
- $21,052
- − Mortgage interest
- −$3,747
- − Property taxes
- −$1,004
- − Insurance
- −$334
- − Repairs & maintenance
- −$1,684
- − Management
- −$1,684
- − Depreciation
- −$1,946
- Taxable income
- $10,652
- Est. tax owed @ 24.0%
- −$2,556
- After-tax cash flow
- $8,526/yr
For passive investors: Depreciation is non-cash, so a rental often shows a tax loss while cash-flowing — sheltering income. Rental losses are passive: they offset passive income freely, and up to $25,000/yr can offset ordinary (W-2) income if you actively participate and your MAGI is under $100k (phasing out to $0 by $150k); unused losses carry forward. On sale, claimed depreciation is recaptured at up to 25%, and gains may owe capital-gains tax (a 1031 exchange can defer both). Figures are a year-1 estimate at your 24.0% rate — not tax advice; consult a CPA.
Condition & rehab AI · 14 photos
The home requires moderate repairs and maintenance, particularly in the exterior and interior paint, to improve its condition and value. Upgrades in these areas would significantly enhance its curb appeal and marketability.
Repairs flagged
- Major Paint — Paint is faded and peeling in some areas.
- Moderate Siding — Siding appears weathered and in need of repainting.
- Minor Kitchen cabinets — Cabinets appear dated but not structurally damaged.
- Minor Bathroom fixtures — Bathtub and fixtures appear dated but functional.
Value-add opportunities
- Both Paint and siding — Fresh paint and siding will improve curb appeal and interior aesthetics.
- Both Landscaping — Well-maintained landscaping can enhance curb appeal and attract potential buyers/tenants.
- Resale Kitchen cabinets and bathroom fixtures — Updating dated cabinets and fixtures can increase the home's appeal to potential buyers.
Renovation cost estimate screening
| Repair item | Severity | Est. cost |
|---|---|---|
| Paint · Paint is faded and peeling in some areas. | Major | $15,000–50,000 |
| Siding · Siding appears weathered and in need of repainting. | Moderate | $3,000–15,000 |
| Kitchen cabinets · Cabinets appear dated but not structurally damaged. | Minor | $500–3,000 |
| Bathroom fixtures · Bathtub and fixtures appear dated but functional. | Minor | $500–3,000 |
| Total estimated repair cost · 4 items | $19,000–71,000 |
Value-add ROI direction
- Both Paint and siding — Fresh paint and siding will improve curb appeal and interior aesthetics. ↑
- Both Landscaping — Well-maintained landscaping can enhance curb appeal and attract potential buyers/tenants. ↑
- Resale Kitchen cabinets and bathroom fixtures — Updating dated cabinets and fixtures can increase the home's appeal to potential buyers. ↑
ⓘ Cost ranges are severity-bucket heuristics (US national rule-of-thumb). Get contractor quotes + a written scope before underwriting a rehab budget.
Schools (NCES district)
- District
- North Marion SD 15
- NCES district ID
- 4108880
- Math proficiency
- 27% ▬ 0.00%
- Reading proficiency
- 43% ▼ -6.00%
- Median HH income
- $55,867
- Composite
- 33.51/100
- National rank
- #10515
- State rank
- #131 of 183 in OR
Livability — Hubbard
- Score
- 80/100
- State rank
- #57
- US rank
- #1930
Category grades
Schools grade is shown separately in the Schools card above.
Census & demographics
- Census place
- Hubbard, OR
- Population (ZIP)
- 4,810
Population outlook (Marion County) Hauer SSP2
- Today (2025)
- 360,940 people
- By 2030
- 375,178 · +3.9%
- By 2040
- 400,914 · +11.1%
- By 2050
- 422,187 · +17.0%
- By 2075
- 460,305 · +27.5%
- By 2100
- 464,025 · +28.6%
Race, ethnicity, and origin ACS 2023
- Neighborhood character
- Majority White (64%)
- Race & ethnicity
- White 64% Hispanic / Latino 33% Two or more races 7% Native American 4%
- Hispanic origin (detail)
- Mexican 31%
- Common ancestry
- Italian 5% Scotch-Irish 5% Slovak 4%
- Foreign-born
- 9% · Canada, Dominican Republic
- Languages at home
- 79% English-only · Spanish 19% Other Asian/Pacific 1% Russian/Polish/Slavic 1%
Political lean MEDSL · Marion
- 2024 margin
- Toss-up / Even · D 47.5% · R 49.5% · Other 3.0%
- 2008→2024 swing
- -4.2pp toward R · 2008: 2.2pp · 2024: -2.0pp
- All cycles
- 2024: R+2.0 2020: D+1.1 2016: R+5.0 2012: R+3.5 2008: D+2.2
Not yet ingested
- Civics
- —
Market trends
- HPI YoY
- ▼ -112.22%
- Current HPI
- 289.9111
- Rent YoY
- —
- Metro
- —
- State GDP YoY
- ▲ 2.05%
- F500 in state
- 2
Industry mix (Fortune 500 HQ in OR)
| Industry | F500 HQs | Revenue |
|---|---|---|
| Consumer Goods | 1 | $51B |
|
||
Price history
1 event — show timeline
- 2026-05-26 Listed $66,900 RMLS
Cash-flow waterfall
monthlySold comps — $/sqft
last 12 mo · ≤1 miLoading sold comps…