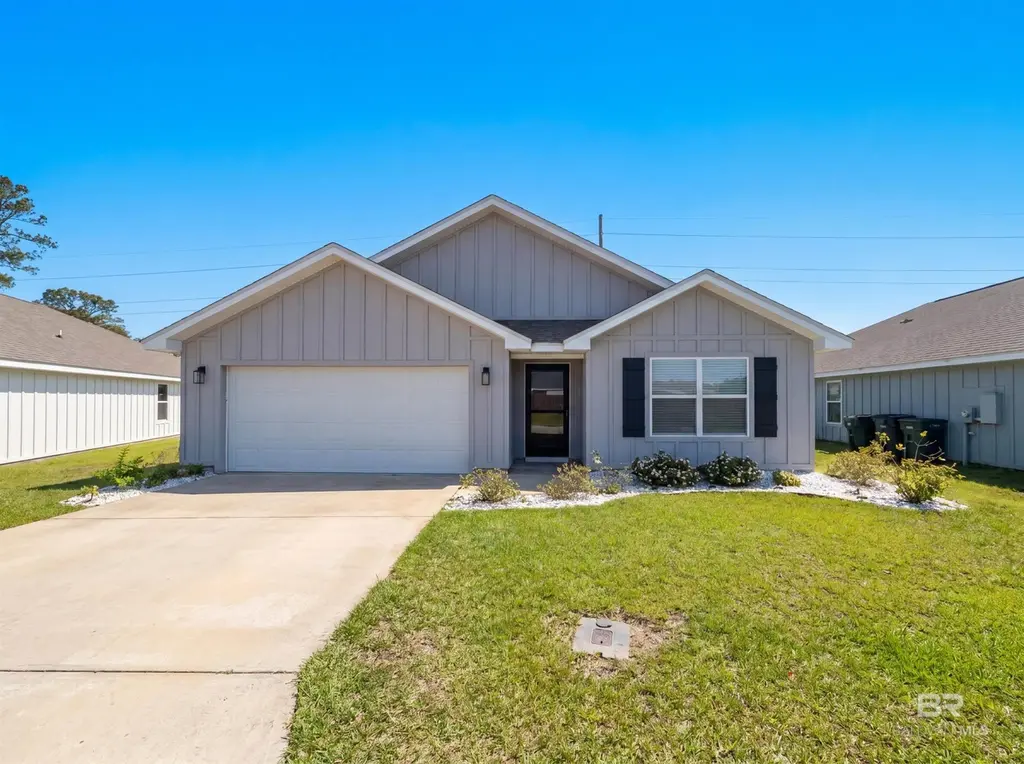
7453 Brompton Dr · Foley, AL
Flood risk No data
- FEMA flood zone
- —
- Chance of flooding over 30 yrs
- —
- Est. flood insurance / yr
- —
Fire risk No data
- Est. fire insurance / yr
- —
Heat risk No data
- Hot days now (above threshold)
- —
- Hot days in 30 yrs
- —
Wind risk No data
- Chance of severe wind over 30 yrs
- —
Air-quality risk No data
- Unhealthy air days now
- —
- Unhealthy air days in 30 yrs
- —
Risk factors via First Street. Map © Google.
Why this score? — see what drove the D- grade
The composite is a weighted blend of 9 inputs, each scored 0–100. Each bar is that input's sub-score; the figure is the points it added to the 100-point composite (weight × sub-score).
- Cash flow +12.0/30.0
- ARV discount +6.4/15.0
- Schools +3.9/10.0
- DSCR +3.5/10.0
- Livability +3.1/5.0
- Rent growth +3.0/5.0
- Condition / age +2.5/5.0
- 1% rule +2.4/10.0
- Appreciation +0.0/10.0
$310,000
🖨 Deal sheet (PDF) 📄 Offer letter ✓ Due diligence
Listing remarks MLS
* Move-in ready * Beautiful private and wooded are behind this home. Granite Countertops, No Carpet and 2" window blinds. As you enter the Cali B , the foyer leads to the fabulous open kitchen featuring a large pantry and island with an overhang that overlooks the family room. The kitchen has granite countertops. The bedroom suite has a roomy attached bathroom, double bowl vanity, 5’ shower, soaking tub, and large walk-in closet. The second and third bedrooms are to the front of the home, on either side of the second full bath. The 4th bedroom is across the hall from bedrooms 2 and 3. Multiple closets to store all your accessories, laundry room. Kensington Place sits in a quaint wooded area in the heart of everything Foley has to offer, from shopping, restaurants and, entertainment to quick access to the beautiful beaches of Gulf Shores. * * * Seller offers $3000 towards closing costs with preferred lender * * * * This home is built to Gold FORTIFIED HomeTM certification, which may save the buyer on their homeowner’s insurance. (See Sales Representative for details. ) * * This home features our Home is Connected (SM) Smart Home Technology, which includes control panel, doorbell, smartcode lock, two smart light switches, and thermostat, all controlled by one app. (See Sales Representative for complete details on these smart home features. ) * * * Pictures are of similar home and not necessarily of subject property, including interior and exterior colors, options, and finishes.
Key facts
- Functional island
- Covered patio
- 8,973 sq ft lot
Tags
Property features AI
Finance
- Other: Directions: Head toward Evergulf Ln, turn left onto Baldwin County Rd 10, turn left onto Brompton Dr
- HOA & community: Annual association fee of $525; Association fee includes: other (see remarks); Transfer fees required; No community amenities listed
Exterior
- Parking: Attached parking
- Utilities: Gulf Shores Utilities service; Riviera Utilities service; Baldwin County sewer service; Total Electric / Baldwin EMC
- Home design: Single-story residence; Resale property; Whole/Full ownership
- Construction: Slab foundation; Composition roof; Construction materials: other (see remarks); Built area reported by builder
- Exterior features: Less than 1 acre lot; Waterfront: other (see remarks); Underground utilities
Interior
- Kitchen: Cooktop; Dishwasher; Microwave
- Flooring: Carpet; Vinyl
- Bathrooms: 2 full bathrooms
- Heating & cooling: Central heating
- Interior features: Ceiling fan(s); No fireplace
- Laundry & utility: Electric water heater
Neighborhood map
What this means for you Summary
Snapshot
- This is a 4-bed/2.0-bath single-family listed at $310k.
Deal economics
- At list price, monthly cash flow is $-74 ($-884/yr) — negative.
- To cash-flow at today's rent, offer at most $297k (4.2% below list).
- To meet the 1% rule (rent ≥ 1% of price), the offer needs to be $230k (25.9% below list).
- Recommended offer: $230k (25.9% below list) — sets the bar for 1% rule.
- Cap rate 6.0% vs local median 4.0% in Foley — top-decile yield for the area; either an underpriced asset or a hidden risk that comps aren't pricing in. Stress-test before assuming the spread holds.
Location & tenants
- Location reads 61/100 on livability (#241 in AL) — a middle-class / working-renter tenant base. Strengths: housing A+, cost of living A-, crime B; Watch: employment D+, amenities F, commute F.
- Baldwin County (rural): math 33% / reading 57% proficiency, ranked #18 of 129 in AL (top 14%) — families likely to look elsewhere, expect single-tenant / working-renter base with shorter leases.
- Zoned schools: Foley Middle School (math 11% / reading 36%, grade F, #172 of 257 statewide, top 68%, 783 students, 82% FRL); Foley High School (math 24% / reading 25%, grade F, #118 of 305 statewide, top 45%, 1,578 students, 75% FRL) — zoned schools average 79% FRL vs 38% district-wide (40 pts higher); higher-poverty schools than district average — tighter screening recommended.
- Zoned-school proficiency averages 24% at this address vs 45% district-wide (-21 pts) — the specific schools serving this property underperform the Baldwin County average; the district grade overstates school quality for this exact location.
- Market conditions: Rents rising (+1.8%/yr); 875 active listings in the ZIP; 10 comparable units currently listed for rent nearby; rentals at typical pace (median 22d on market — plan ~3-4 weeks tenant-placement turnaround); 3,883 units permitted in Baldwin County in 2024 (481 in 5+ unit buildings).
- This rent runs 41% of the median local income ($67k/yr) — at the standard rent-burdened threshold; future hikes will face affordability resistance.
Forward outlook
- Local home prices are declining (-3.0%/yr); year-one equity from $2k of loan paydown is wiped out by about $9k of value loss. Plan a longer hold.
- Baldwin County population projected at +42% by 2050 — long-run rental-demand tailwind backs the buy-and-hold thesis.
Negotiation context
- It's been on market 21 days — a 2% lower offer ($305k) is reasonable based on typical stale-listing flexibility.
- 4 sale attempts since 5y ago with the ask held roughly flat each time — persistent listings suggest the price (not the market) is what's stuck; bring a comps-based counter.
Questions for the listing agent
- What do current leases actually rent for vs. the listed asking? Can we see a recent rent roll and the last 12 months of T-12 income?
- What does the HOA fee cover, when was the last increase, and are there any pending special assessments or reserve-fund shortfalls?
- Is there a deadline driving the sale (1031 exchange, divorce, estate, relocation)? That informs how much negotiation room exists.
- Schools are D-rated, which usually means shorter tenancies and higher turnover. Who's the typical renter profile here, and what's been the actual vacancy rate?
- The area grade is low — what's the realistic commute time and amenity access for the typical tenant pool here? Any planned neighborhood developments (good or bad) we should know about?
- What's the average days-on-market for RENTAL listings here right now (not sales)? A rising rental-DOM trend means longer vacancies and softer asking-rent achievability than the comps imply.
- What's the recent tenant-quality profile in this submarket — average credit score on applications, eviction rate, late-payment / NSF rate, and stable-employment percentage? A property-management company in the area should have these aggregated.
- How much new for-sale + rental construction is in the pipeline within 1–3 miles? Heavy new supply typically softens prices + rents 12–24 months out; constrained supply supports both.
Investment metrics
- 1% rule
- 0.74% ✗
- Cap rate
- 6.01%
- Cash-on-cash
- -1.02%
- DSCR
- 0.95
- GRM
- 11.2
CMA / ARV
- ARV (on-the-fly)
- $302,341
- Comps found
- 12
Show comp detail 12 sales within ~0.75 mi
| Address | Dist | Beds/Ba | Sqft | Sold | Price | $/sf | Match |
|---|---|---|---|---|---|---|---|
| 7429 Brompton Dr | 0.06mi | 4/2.0 | 1,768 (-1%) | 1mo | $285,000 | $161 | 94 |
| 7417 Brompton Dr | 0.09mi | 4/2.0 | 1,768 (-1%) | 0mo | $290,000 | $164 | 94 |
| 19412 Maple Crest Loop | 0.10mi | 4/2.0 | 1,845 (+3%) | 1mo | $316,490 | $172 | 89 |
| 19114 Maple Crest Loop | 0.11mi | 4/2.0 | 1,845 (+3%) | 2mo | $306,699 | $166 | 88 |
| 19121 Maple Crest Loop | 0.14mi | 3/2.0 (-1) | 1,744 (-2%) | 2mo | $294,990 | $169 | 83 |
| 19420 Maple Crest Loop | 0.09mi | 3/2.0 (-1) | 1,891 (+6%) | 1mo | $320,000 | $169 | 81 |
| 19105 Maple Crest Loop | 0.11mi | 3/2.0 (-1) | 1,891 (+6%) | 1mo | $310,000 | $164 | 79 |
| 19465 Maple Crest Loop | 0.04mi | 4/2.0 | 2,000 (+12%) | 1mo | $324,990 | $162 | 78 |
| 19404 Maple Crest Loop | 0.11mi | 4/2.0 | 2,000 (+12%) | 1mo | $341,490 | $171 | 74 |
| 7464 Fairmont Dr | 0.43mi | 3/2.0 (-1) | 1,812 (+1%) | 2mo | $383,000 | $211 | 71 |
| 6789 Mighty Oaks Dr | 0.59mi | 3/2.0 (-1) | 1,839 (+3%) | 2mo | $320,000 | $174 | 61 |
| 7768 Simmons Dr | 0.50mi | 3/2.0 (-1) | 1,624 (-9%) | 1mo | $245,000 | $151 | 55 |
Match score weights: distance 35% · size 25% · config 20% · recency 20%. Top-matched comps best support the ARV.
Projected returns pro-forma
-3.0% appreciation · 1.81% rent growth · sell at horizon
- IRR
- -19.2%
- Equity multiple
- 0.33×
- Total profit
- $-57,763
- Equity at exit
- $46,222
- IRR
- -14.2%
- Equity multiple
- 0.22×
- Total profit
- $-67,721
- Equity at exit
- $26,803
Cash invested: $86,800 (down + closing). Projections, not guarantees.
Landlord ↔ Tenant lean methodology
- Overall (STATE)
- 90 Strongly Landlord-Friendly
- State Alabama
- 90 Strongly Landlord-Friendly · R+15
- County
- — inherits STATE
- City
- — inherits STATE
ZIP-level market 36535
- Home prices YoY
- -24.9%
- Rents YoY
- 1.8%
- Active inventory
- 875
- Price-to-rent
- 11.2×
Monthly cashflow live
- Estimated rent
- $2,297 high interval (Pro) →
- Mortgage (P&I)
- −$1,626
- Tax from tax record
- −$89 /mo · $1,071/yr
- Insurance
- −$129
- HOA
- −$44
- Vacancy / Maint / Mgmt
- −$482
- Net cashflow
- $-74
Break-even live
Sensitivity live
| Price | -10% $102 | -5% $14 | +0% $-74 | +5% $-161 | +10% $-249 |
|---|---|---|---|---|---|
| Rent | -10% $-255 | -5% $-164 | +0% $-74 | +5% $17 | +10% $108 |
| Rate | -1.0pp $82 | -0.5pp $5 | base $-74 | +0.5pp $-154 | +1.0pp $-236 |
UW: 25.0% down · 7.5% · 30yr · 1.5% tax · 5.0% vac · 8.0% maint · 8.0% mgmt
Financing live
Cash to close
- Down payment
- $77,500
- Closing costs
- $9,300
- Reserves months
- —
- Total cash needed
- —
Loan-product check · same deal, 3 products live
Conventional
25% down · 7.5% · 30yr
- Down + closing
- —
- Monthly P&I
- —
- Monthly cashflow
- —
- DSCR
- —
- Eligible?
- —
Personal DTI + credit; lowest rate.
DSCR
20% down · 8.5% · 30yr
- Down + closing
- —
- Monthly P&I
- —
- Monthly cashflow
- —
- DSCR
- —
- Eligible?
- —
No personal income docs; deal must DSCR.
Hard money
10% down · 12.0% · 12mo
- Down + closing
- —
- Monthly P&I
- —
- Monthly cashflow
- —
- DSCR
- —
- Eligible?
- —
Short-term bridge; refi at stabilization.
Rent comps 10 comps
| Address | Beds | Baths | Sqft | Rent | $/sqft | DOM | Units | Dist |
|---|---|---|---|---|---|---|---|---|
| 224 Fulham Ln Foley, AL | 4.0 | 2.0 | 1787 | $2,100 | $1.18 | 14d | 1 | 0.10mi |
| 212 Burnston Way Foley, AL | 4.0 | 2.0 | 1768 | $2,175 | $1.23 | 44d | 1 | 0.15mi |
| 20215 Edison Ave Foley, AL | 1.0–3.0 | 1.0–2.0 | 1008 | $1,950 | $1.93 | 14d | 53 | 0.70mi |
| 8088 Carmel Cir Foley, AL | 3.0 | 2.0 | 1693 | $2,300 | $1.36 | 14d | 1 | 0.88mi |
| 263 Preston Way Gulf Shores, AL | 4.0 | 2.0 | 1787 | $2,400 | $1.34 | 14d | 1 | 1.00mi |
| 392 Parkerman Ave Gulf Shores, AL | 4.0 | 2.0 | 1835 | $2,600 | $1.42 | 21d | 1 | 1.21mi |
| 452 Parkerman Ave Gulf Shores, AL | 4.0 | 2.0 | 1835 | $2,600 | $1.42 | 21d | 1 | 1.21mi |
| 417 Parkerman Ave Gulf Shores, AL | 4.0 | 2.0 | 1835 | $2,500 | $1.36 | 14d | 1 | 1.21mi |
| 425 Raley Farms Dr Gulf Shores, AL | 4.0 | 2.5 | 2250 | $2,600 | $1.16 | 21d | 1 | 1.32mi |
| 4962 Thorp Way Gulf Shores, AL | 1.0–3.0 | 1.0–2.5 | 1170 | $2,477 | $2.12 | 21d | 45 | 1.42mi |
HOA detail
- Monthly dues
- $44 · $528/yr
Listing history 18 events
-
2026-06-19days on market $310,000 Active 21 DOM
-
2026-06-18days on market $310,000 Active 20 DOM
-
2026-06-17days on market $310,000 Active 19 DOM
-
2026-06-16days on market $310,000 Active 18 DOM
-
2026-06-15days on market $310,000 Active 17 DOM
-
2026-06-14pricedays on market $310,000 Active 15 DOM
-
2026-06-13days on market $315,000 Active 14 DOM
-
2026-06-10days on market $315,000 Active 12 DOM
-
2026-06-09days on market $315,000 Active 11 DOM
-
2026-06-08days on market $315,000 Active 10 DOM
-
2026-06-07days on market $315,000 Active 9 DOM
-
2026-06-05days on market $315,000 Active 6 DOM
-
2026-06-03days on market $315,000 Active 5 DOM
-
2026-06-02days on market $315,000 Active 4 DOM
-
2026-06-01days on market $315,000 Active 3 DOM
-
2026-05-31days on market $315,000 Active 2 DOM
-
2026-05-30remarks 472-char remark
-
2026-05-30$315,000 Active 1 DOM
ⓘ Source: listings_history table (triggers on properties + properties_extension) + one-shot
backfill from property_details.listing_events for pre-trigger history.
Tax reassessment forecast AL · Resets to sale price
- Current annual tax
- $1,071 · $89/mo
- Projected year-2 tax
- $1,271 · $106/mo
- Expected delta
- +$200/yr (+$17/mo · 18.7%)
ⓘ Screening estimate from a state-policy table — verify with the county assessor before closing.
Nearby sold comps map
Loading sold comps map…
Walkable amenities ~0.75 mi
Loading nearby amenities…
Taxation est. · year 1
- Rental income
- $27,561
- − Mortgage interest
- −$17,365
- − Property taxes
- −$1,071
- − Insurance
- −$1,550
- − Repairs & maintenance
- −$2,205
- − Management
- −$2,205
- − HOA
- −$528
- − Depreciation
- −$9,018
- Taxable loss
- −$6,381
- Est. tax savings @ 24.0%
- +$1,531
- After-tax cash flow
- $648/yr
For passive investors: Depreciation is non-cash, so a rental often shows a tax loss while cash-flowing — sheltering income. Rental losses are passive: they offset passive income freely, and up to $25,000/yr can offset ordinary (W-2) income if you actively participate and your MAGI is under $100k (phasing out to $0 by $150k); unused losses carry forward. On sale, claimed depreciation is recaptured at up to 25%, and gains may owe capital-gains tax (a 1031 exchange can defer both). Figures are a year-1 estimate at your 24.0% rate — not tax advice; consult a CPA.
Schools (NCES district)
- District
- Baldwin County
- NCES district ID
- 0100270
- Math proficiency
- 33% ▼ -26.00%
- Reading proficiency
- 57% ▲ 1.00%
- Median HH income
- $50,677
- Composite
- 38.61/100
- National rank
- #4157
- State rank
- #18 of 129 in AL
Livability — Foley
- Score
- 61/100
- State rank
- #241
- US rank
- #17616
Category grades
Schools grade is shown separately in the Schools card above.
Census & demographics
- Census place
- Foley, AL
- County
- Baldwin County · 181,514 people
- City population
- 40,628
- Metro
- Daphne-Fairhope-Foley, AL
- Population (ZIP)
- 40,628
- Household income
- $66,714
- Rent vs Own
- Severe rent burden
- 803.0
Population outlook (Baldwin County) Hauer SSP2
- Today (2025)
- 248,264 people
- By 2030
- 270,315 · +8.9%
- By 2040
- 312,967 · +26.1%
- By 2050
- 352,262 · +41.9%
- By 2075
- 438,841 · +76.8%
- By 2100
- 487,736 · +96.5%
Race, ethnicity, and origin ACS 2023
- Neighborhood character
- Predominantly White (78%)
- Race & ethnicity
- White 78% Hispanic / Latino 10% Two or more races 8% Black 5% Asian 2%
- Hispanic origin (detail)
- Mexican 6%
- Common ancestry
- Lithuanian 2% Romanian 2% Slovak 1%
- Foreign-born
- 6% · Canada, China
- Languages at home
- 89% English-only · Spanish 7% Other Indo-European 2% Chinese 1%
Political lean MEDSL · Baldwin
- 2024 margin
- Solid R (+58.2) · D 20.5% · R 78.7%
- 2008→2024 swing
- -6.7pp toward R · 2008: -51.5pp · 2024: -58.2pp
- All cycles
- 2024: R+58.2 2020: R+53.8 2016: R+57.8 2012: R+55.8 2008: R+51.5
Not yet ingested
- Civics
- —
Market trends
- HPI YoY
- ▼ -86.82%
- Current HPI
- 262.2796
- Rent YoY
- ▲ 1.81%
- Metro
- Daphne-Fairhope-Foley, AL
- State GDP YoY
- ▲ 2.94%
- F500 in state
- 4
Industry mix (Fortune 500 HQ in AL)
| Industry | F500 HQs | Revenue |
|---|---|---|
| Financial Services | 1 | $8B |
|
||
| Healthcare | 1 | $5B |
|
||
Price history
+13.7% since first listed10 events — show timeline
- 2026-05-29 Listed $315,000 BCAR
- 2022-02-18 Sold (MLS) $282,165 BCAR
- 2022-01-23 Pending — BCAR
- 2022-01-21 Price Changed $282,990 BCAR
- 2022-01-20 Relisted — BCAR
- 2021-12-20 Pending — BCAR
- 2021-12-14 Price Changed $279,165 BCAR
- 2021-12-13 Relisted — BCAR
- 2021-12-13 Pending — BCAR
- 2021-09-25 Listed $277,025 BCAR
Property tax history
+68.8%/yrLatest (2025): $1,071 · +14.9% YoY. Source: county tax records.
Cash-flow waterfall
monthlySold comps — $/sqft
last 12 mo · ≤1 miLoading sold comps…