166 Red Bird Ln · Drakes Branch, VA
Flood risk 1/10 · Minimal
- FEMA flood zone
- X (unshaded)
- Chance of flooding over 30 yrs
- 0.0%
- Est. flood insurance / yr
- $507 – $1,088
Fire risk 3/10 · Minor
- Est. fire insurance / yr
- $666 – $1,236
Heat risk 6/10 · Moderate
- Hot days now (above 104°F)
- 7 days/yr
- Hot days in 30 yrs
- 17 days/yr
Wind risk 4/10 · Minor
- Chance of severe wind over 30 yrs
- 14.0%
Air-quality risk 1/10 · Minimal
- Unhealthy air days now
- 0 days/yr
- Unhealthy air days in 30 yrs
- 0 days/yr
Risk factors via First Street. Map © Google.
Why this score? — see what drove the D+ grade
The composite is a weighted blend of 9 inputs, each scored 0–100. Each bar is that input's sub-score; the figure is the points it added to the 100-point composite (weight × sub-score).
- Cash flow +12.5/30.0
- Appreciation +8.7/10.0
- ARV discount +7.5/15.0
- Schools +5.1/10.0
- DSCR +3.7/10.0
- Livability +3.0/5.0
- Rent growth +2.5/5.0
- Condition / age +2.5/5.0
- 1% rule +2.2/10.0
$199,000
🖨 Deal sheet (PDF) 📄 Offer letter ✓ Due diligence
Listing remarks
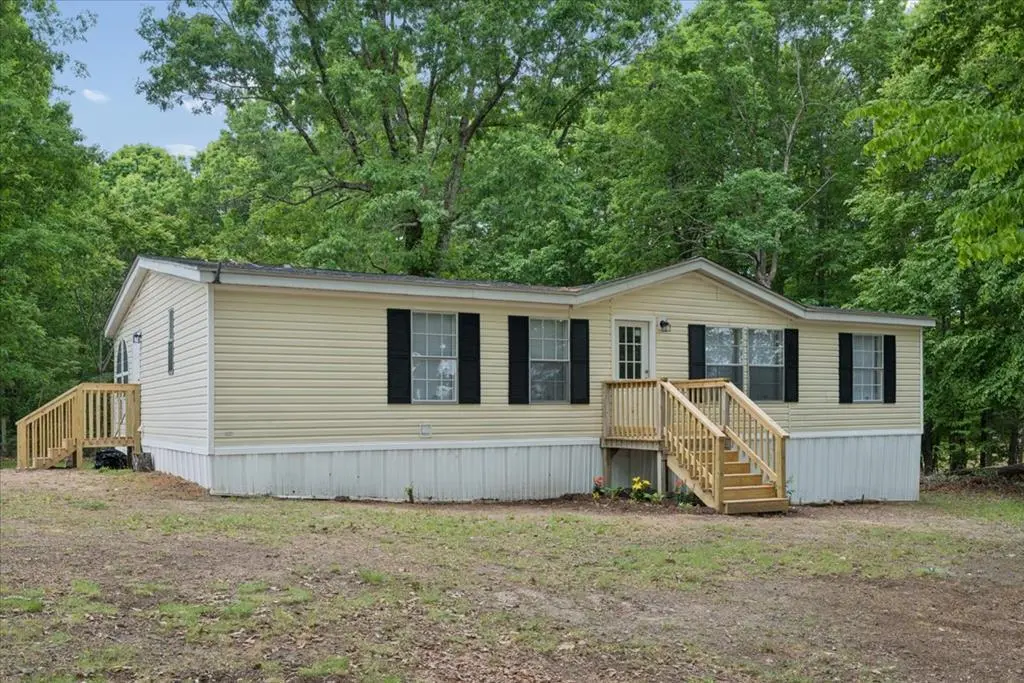
Welcome to quiet country living in Saxe, Virginia. This fully renovated 3 bedroom, 2 bath home sits on 3 acres and feels brand new from the moment you walk through the door. Inside, you'll notice it right away. Bright finishes, tons of natural light, and a crisp, clean look that makes the whole place feel fresh and modern. The layout just works. Spacious bedrooms, a primary suite with two walk-in closets, and multiple spots to gather with both a dining area and a sunny breakfast nook. If you've got plants, bring them. They're about to thrive here. Step outside and you've got room to breathe. Three acres gives you privacy without feeling isolated. Located in Charlotte County, Virginia, you'r
Key facts
- 3 acre lot
- Built 2000
- Listed 40 days
Property features AI
Exterior
- Parking: Open parking on gravel; no garage
- Utilities: Private well water; Septic tank sewer
- Home design: Residential mobile home (double wide); Single-story living (above-grade finished area 1,536 square feet)
- Construction: Vinyl siding; Composition roof; Crawl space foundation; Built as a double-wide manufactured home
- Exterior features: Has a view; 3-acre lot; Zoned AG
Interior
- Kitchen: Dishwasher; Electric range; Microwave; Refrigerator; Electric water heater
- Bedrooms: Total of 6 rooms (includes bedrooms and living spaces)
- Bathrooms: 2 full bathrooms
- Heating & cooling: Heat pump heating; Heat pump cooling; Ceiling fans for additional cooling
- Interior features: Ceiling fans; Walk-in closets; No fireplace
- Laundry & utility: Laundry room with washer and electric dryer hookups
Neighborhood map
What this means for you Summary
Snapshot
- This is a 4-bed/2.0-bath manufactured listed at $199k.
Deal economics
- At list price, monthly cash flow is $-27 ($-329/yr) — negative.
- To cash-flow at today's rent, offer at most $194k (2.4% below list).
- To meet the 1% rule (rent ≥ 1% of price), the offer needs to be $144k (27.8% below list).
- Recommended offer: $144k (27.8% below list) — sets the bar for 1% rule.
Location & tenants
- Location reads 59/100 on livability (#464 in VA) — a working-class tenant base; expect higher turnover. Strengths: cost of living A+; Watch: health & safety C-, crime D+, amenities F.
- Charlotte County Public School District (rural): math 51% / reading 72% proficiency, ranked #59 of 131 in VA (top 45%) — acceptable for families but not a draw, mixed tenant base, ~2y average lease.
- Zoned schools: Bacon District Elementary (math 54% / reading 64%, grade B-, #536 of 1,108 statewide, top 51%, 169 students, 85% FRL); Central Middle (math 49% / reading 69%, grade B, #166 of 342 statewide, top 50%, 370 students, 85% FRL); Randolph-Henry High (math 47% / reading 82%, grade B-, #213 of 319 statewide, top 69%, 478 students, 84% FRL) — zoned schools average 85% FRL vs 48% district-wide (37 pts higher); higher-poverty schools than district average — tighter screening recommended.
- Market conditions: 5 active listings in the ZIP; 39 units permitted in Charlotte County in 2024 (0 in 5+ unit buildings).
Forward outlook
- In year one you build about $16k of equity ($1k loan paydown + $15k appreciation (7.5% local appreciation)).
- Charlotte County population projected at -26% by 2050 — secular population decline; favor cash flow + early exit over multi-decade hold.
- At projected returns (7.5% appreciation + 3.0% rent growth), your $56k cash investment doubles in ~4 years — after that, you're playing with house money.
- By year 3, paydown + projected appreciation supports a ~$40k cash-out refi (75% LTV) — recoverable capital for the next deal without selling this one.
Negotiation context
- It's been on market 40 days — a 3% lower offer ($193k) is reasonable based on typical stale-listing flexibility.
Risks & watch-outs
- Climate carrying-cost: extreme-heat days projected 7→17/yr by 2055 (HVAC capex compounding) — expect insurance premiums to compound above CPI over the hold.
Questions for the listing agent
- What do current leases actually rent for vs. the listed asking? Can we see a recent rent roll and the last 12 months of T-12 income?
- It's been on market 40 days. Have you received any prior offers? Is the seller open to a 28% concession, seller financing, or rate buy-down credit?
- Is there a deadline driving the sale (1031 exchange, divorce, estate, relocation)? That informs how much negotiation room exists.
- Schools are F-rated, which usually means shorter tenancies and higher turnover. Who's the typical renter profile here, and what's been the actual vacancy rate?
- Crime grade is D in this area — have there been break-ins, vandalism, or insurance claims at this property in the last 3 years? What carrier currently insures it and at what premium?
- The area grade is low — what's the realistic commute time and amenity access for the typical tenant pool here? Any planned neighborhood developments (good or bad) we should know about?
- What's the average days-on-market for RENTAL listings here right now (not sales)? A rising rental-DOM trend means longer vacancies and softer asking-rent achievability than the comps imply.
- What's the recent tenant-quality profile in this submarket — average credit score on applications, eviction rate, late-payment / NSF rate, and stable-employment percentage? A property-management company in the area should have these aggregated.
- How much new for-sale + rental construction is in the pipeline within 1–3 miles? Heavy new supply typically softens prices + rents 12–24 months out; constrained supply supports both.
Investment metrics
- 1% rule
- 0.72% ✗
- Cap rate
- 6.13%
- Cash-on-cash
- -0.59%
- DSCR
- 0.97
- GRM
- 11.5
CMA / ARV
No comps found within radius.
Projected returns pro-forma
7.46% appreciation · 3.0% rent growth · sell at horizon
- IRR
- 18.3%
- Equity multiple
- 2.32×
- Total profit
- $73,354
- Equity at exit
- $143,985
- IRR
- 17.4%
- Equity multiple
- 4.84×
- Total profit
- $213,894
- Equity at exit
- $279,202
Cash invested: $55,720 (down + closing). Projections, not guarantees.
Landlord ↔ Tenant lean methodology
- Overall (STATE)
- 55 Moderately Landlord-Leaning
- State Virginia
- 55 Moderately Landlord-Leaning · D+2
- County
- — inherits STATE
- City
- — inherits STATE
ZIP-level market 23967
- Home prices YoY
- 7.1%
- Active inventory
- 5
- Price-to-rent
- 11.5×
Monthly cashflow live
- Estimated rent
- $1,438 medium interval (Pro) →
- Mortgage (P&I)
- −$1,044
- Tax from tax record
- −$37 /mo · $441/yr
- Insurance
- −$83
- HOA
- −$0
- Vacancy / Maint / Mgmt
- −$302
- Net cashflow
- $-27
Break-even live
Sensitivity live
| Price | -10% $85 | -5% $29 | +0% $-27 | +5% $-84 | +10% $-140 |
|---|---|---|---|---|---|
| Rent | -10% $-141 | -5% $-84 | +0% $-27 | +5% $29 | +10% $86 |
| Rate | -1.0pp $73 | -0.5pp $23 | base $-27 | +0.5pp $-79 | +1.0pp $-131 |
UW: 25.0% down · 7.5% · 30yr · 1.5% tax · 5.0% vac · 8.0% maint · 8.0% mgmt
Financing live
Cash to close
- Down payment
- $49,750
- Closing costs
- $5,970
- Reserves months
- —
- Total cash needed
- —
Loan-product check · same deal, 3 products live
Conventional
25% down · 7.5% · 30yr
- Down + closing
- —
- Monthly P&I
- —
- Monthly cashflow
- —
- DSCR
- —
- Eligible?
- —
Personal DTI + credit; lowest rate.
DSCR
20% down · 8.5% · 30yr
- Down + closing
- —
- Monthly P&I
- —
- Monthly cashflow
- —
- DSCR
- —
- Eligible?
- —
No personal income docs; deal must DSCR.
Hard money
10% down · 12.0% · 12mo
- Down + closing
- —
- Monthly P&I
- —
- Monthly cashflow
- —
- DSCR
- —
- Eligible?
- —
Short-term bridge; refi at stabilization.
Listing history 11 events
-
2026-06-12status $199,000 Pending 40 DOM
-
2026-06-09days on market $199,000 Active Under Contract 40 DOM
-
2026-06-08days on market $199,000 Active Under Contract 39 DOM
-
2026-06-08days on market $199,000 Active Under Contract 38 DOM
-
2026-06-07days on market $199,000 Active Under Contract 37 DOM
-
2026-06-03days on market $199,000 Active Under Contract 34 DOM
-
2026-06-02days on market $199,000 Active Under Contract 33 DOM
-
2026-06-01days on market $199,000 Active Under Contract 32 DOM
-
2026-05-31days on market $199,000 Active Under Contract 31 DOM
-
2026-05-11historical Active Under Contract 1122-char remark
-
2026-04-30$199,000 Active 1122-char remark
ⓘ Source: listings_history table (triggers on properties + properties_extension) + one-shot
backfill from property_details.listing_events for pre-trigger history.
Tax reassessment forecast VA · Resets to sale price
- Current annual tax
- $441 · $37/mo
- Projected year-2 tax
- $1,632 · $136/mo
- Expected delta
- +$1,191/yr (+$99/mo · 270.0%)
ⓘ Screening estimate from a state-policy table — verify with the county assessor before closing.
Climate risk First Street
- Flood 1/10 Low FEMA zone X (unshaded) · 0% chance over 30 yrs
- Wildfire 3/10 Moderate
- Heat 6/10 Major 7 d/yr ≥104°F today · 17 d/yr by 30 yrs out
- Wind 4/10 Moderate 14% chance of damaging wind over 30 yrs
- Air quality 1/10 Low 0 unhealthy d/yr today · 0 by 30 yrs out
Nearby sold comps map
Loading sold comps map…
Walkable amenities ~0.75 mi
Loading nearby amenities…
Taxation est. · year 1
- Rental income
- $17,253
- − Mortgage interest
- −$11,147
- − Property taxes
- −$441
- − Insurance
- −$995
- − Repairs & maintenance
- −$1,380
- − Management
- −$1,380
- − Depreciation
- −$5,789
- Taxable loss
- −$3,879
- Est. tax savings @ 24.0%
- +$931
- After-tax cash flow
- $602/yr
For passive investors: Depreciation is non-cash, so a rental often shows a tax loss while cash-flowing — sheltering income. Rental losses are passive: they offset passive income freely, and up to $25,000/yr can offset ordinary (W-2) income if you actively participate and your MAGI is under $100k (phasing out to $0 by $150k); unused losses carry forward. On sale, claimed depreciation is recaptured at up to 25%, and gains may owe capital-gains tax (a 1031 exchange can defer both). Figures are a year-1 estimate at your 24.0% rate — not tax advice; consult a CPA.
Schools (NCES district)
- District
- Charlotte County Public School District
- NCES district ID
- 5100750
- Math proficiency
- 51% ▼ -35.00%
- Reading proficiency
- 72% ▼ -8.00%
- Median HH income
- $35,822
- Composite
- 50.88/100
- National rank
- #1794
- State rank
- #59 of 131 in VA
Livability — Drakes Branch
- Score
- 59/100
- State rank
- #464
- US rank
- #19827
Category grades
Schools grade is shown separately in the Schools card above.
Census & demographics
- Population (ZIP)
- 1,392
Population outlook (Charlotte County) Hauer SSP2
- Today (2025)
- 11,224 people
- By 2030
- 10,663 · -5.0%
- By 2040
- 9,445 · -15.8%
- By 2050
- 8,271 · -26.3%
- By 2075
- 5,985 · -46.7%
- By 2100
- 3,716 · -66.9%
Race, ethnicity, and origin ACS 2023
- Neighborhood character
- Predominantly White (67%)
- Race & ethnicity
- White 67% Black 29% Two or more races 4%
- Common ancestry
- Romanian 3% Portuguese 3% Italian 1%
Political lean MEDSL · Charlotte
- 2024 margin
- Solid R (+32.5) · D 33.4% · R 66.0%
- 2008→2024 swing
- -21.7pp toward R · 2008: -10.8pp · 2024: -32.5pp
- All cycles
- 2024: R+32.5 2020: R+24.2 2016: R+22.9 2012: R+13.7 2008: R+10.8
Not yet ingested
- Civics
- —
Market trends
- HPI YoY
- ▲ 7.46%
- Current HPI
- 112.6816
- Rent YoY
- —
- Metro
- —
- State GDP YoY
- ▲ 2.40%
- F500 in state
- 50
Industry mix (Fortune 500 HQ in VA)
| Industry | F500 HQs | Revenue |
|---|---|---|
| Aerospace / Defense | 4 | $236B |
|
||
| Technology / Defense | 3 | $32B |
|
||
| Financial Services | 2 | $176B |
|
||
| Utilities | 2 | $27B |
|
||
| Insurance | 2 | $25B |
|
||
| Technology | 2 | $15B |
|
||
Price history
+1.5% since first listed4 events — show timeline
- 2026-06-09 Pending — SPLLAR
- 2026-06-08 Sold (MLS) $201,900 SPLLAR
- 2026-05-11 Contingent — SPLLAR
- 2026-04-30 Listed $199,000 SPLLAR
Property tax history
+3.6%/yrLatest (2025): $441 · +10.5% YoY. Source: county tax records.
Cash-flow waterfall
monthlySold comps — $/sqft
last 12 mo · ≤1 miLoading sold comps…