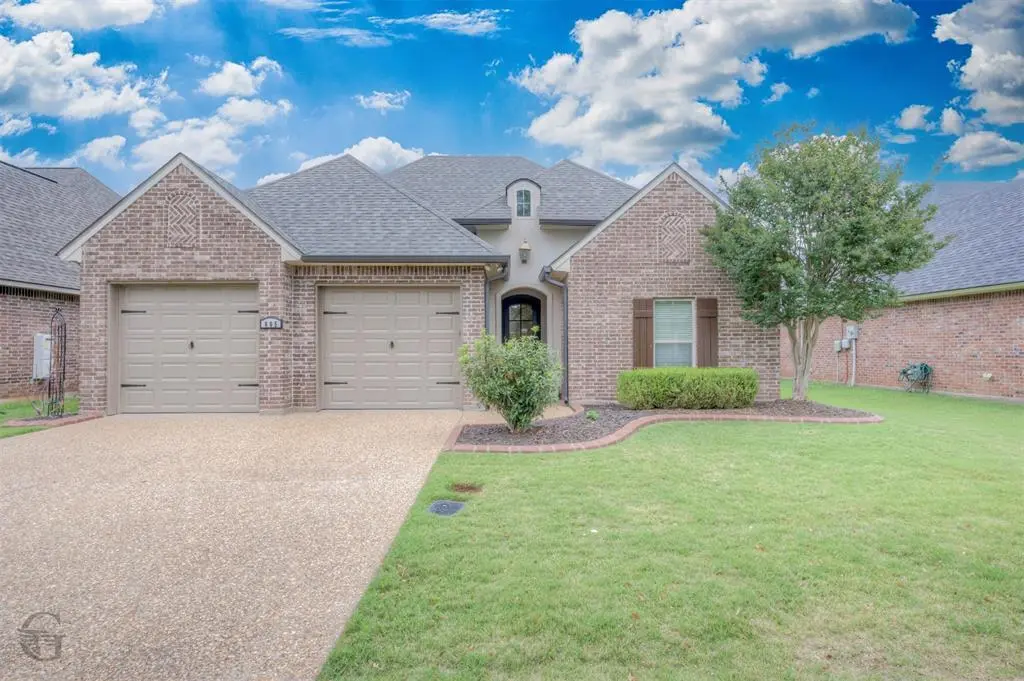
605 Canoe Trl · Bossier City, LA
Flood risk 1/10 · Minimal
- FEMA flood zone
- X (unshaded)
- Chance of flooding over 30 yrs
- 0.0%
- Est. flood insurance / yr
- $507 – $1,088
Fire risk 2/10 · Minimal
- Est. fire insurance / yr
- $1,269 – $2,357
Heat risk 8/10 · Major
- Hot days now (above 110°F)
- 7 days/yr
- Hot days in 30 yrs
- 23 days/yr
Wind risk 6/10 · Moderate
- Chance of severe wind over 30 yrs
- 66.0%
Air-quality risk 2/10 · Minimal
- Unhealthy air days now
- 1 days/yr
- Unhealthy air days in 30 yrs
- 1 days/yr
Risk factors via First Street. Map © Google.
Why this score? — see what drove the D grade
The composite is a weighted blend of 9 inputs, each scored 0–100. Each bar is that input's sub-score; the figure is the points it added to the 100-point composite (weight × sub-score).
- ARV discount +13.2/15.0
- Cash flow +9.4/30.0
- Rent growth +4.1/5.0
- Schools +3.8/10.0
- Livability +3.6/5.0
- DSCR +2.7/10.0
- Condition / age +2.5/5.0
- 1% rule +2.2/10.0
- Appreciation +0.0/10.0
$279,000
🖨 Deal sheet (PDF) 📄 Offer letter ✓ Due diligence
Listing remarks
Welcome home to desirable Cypress Bend! This well-maintained one-owner home offers 3 bedrooms, 2 baths, and a spacious open floor plan perfect for everyday living and entertaining. The remote master suite features an oversized jetted tub, while the large master closet includes convenient built-ins for extra storage and organization. Fresh interior paint and newly replaced bedroom carpet make this home truly move-in ready! Step outside to enjoy the large covered patio overlooking the backyard — the perfect spot for relaxing or hosting guests. Don’t miss this beautifully updated home in a great location!
Key facts
- Oversized jetted tub
- Remote master suite
- Backyard
Tags
Property features AI
Finance
- Other: Deed restrictions apply; Playground and sidewalks in community
- Financial info: Association fee charged annually
- HOA & community: Mandatory HOA (Cypress Bend); HOA fees cover grounds and structure maintenance and management; Annual association fee
Exterior
- Parking: Attached 2-car garage; Covered parking for 2 vehicles; Additional parking and driveway; Garage door opener; garage faces front
- Security: Gated community
- Utilities: City water; City sewer; Electricity connected; Cable available; Asphalt access
- Home design: Single-family residence; One story; Residential property; Smart home features present
- Construction: Built in 2013; Brick construction; Shingle roof
- Exterior features: Covered porch; Covered patio/porch features; Wood fencing
Interior
- Kitchen: Built-in gas range; Gas cooktop; Dishwasher; Disposal; Microwave; Refrigerator
- Bedrooms: Primary bedroom on main level with ensuite bath, dual sinks and jetted tub
- Flooring: Carpet; Ceramic tile; Wood
- Bathrooms: Two full bathrooms
- Heating & cooling: Central heating; Central air
- Interior features: Open floor plan with vaulted ceilings; Granite countertops; Kitchen island; Pantry; Built-in features; Cable TV available; Eat-in kitchen
- Laundry & utility: Individual gas meter; Individual water meter
Neighborhood map
What this means for you Summary
Snapshot
- This is a 3-bed/2.0-bath other listed at $279k.
Deal economics
- At list price, monthly cash flow is $-197 ($-2k/yr) — negative.
- To cash-flow at today's rent, offer at most $244k (12.5% below list).
- To meet the 1% rule (rent ≥ 1% of price), the offer needs to be $200k (28.2% below list).
- Recommended offer: $200k (28.2% below list) — sets the bar for 1% rule.
Location & tenants
- Location reads 71/100 on livability (#47 in LA) — a middle-class / working-renter tenant base. Strengths: commute A+, cost of living A+, housing A+; Watch: employment D+, crime F, amenities F.
- Bossier Parish (urban): math 40% / reading 47% proficiency, ranked #17 of 98 in LA (top 17%) — families likely to look elsewhere, expect single-tenant / working-renter base with shorter leases.
- Zoned schools: Kingston Elementary School (math 73% / reading 69%, grade A-, #23 of 646 statewide, top 4%, 820 students, 33% FRL); Benton Middle School (math 49% / reading 58%, grade C+, #21 of 218 statewide, top 9%, 850 students, 34% FRL); Benton High School (math 55% / reading 63%, grade C+, #22 of 265 statewide, top 8%, 1,538 students, 28% FRL).
- Zoned-school proficiency averages 61% at this address vs 44% district-wide (+18 pts) — the actual schools serving this property are materially stronger than the Bossier Parish average implies; a family-tenant draw the district grade alone would hide.
- Market conditions: Rents rising fast (+6.6%/yr); 426 active listings in the ZIP; 9 comparable units currently listed for rent nearby; rentals at typical pace (median 23d on market — plan ~3-4 weeks tenant-placement turnaround); 716 units permitted in Bossier Parish in 2024 (0 in 5+ unit buildings).
- This rent runs 37% of the median local income ($65k/yr) — at the standard rent-burdened threshold; future hikes will face affordability resistance.
Forward outlook
- Local home prices are declining (-3.0%/yr); year-one equity from $2k of loan paydown is wiped out by about $8k of value loss. Plan a longer hold.
- Bossier County population projected at +28% by 2050 — long-run rental-demand tailwind backs the buy-and-hold thesis.
Negotiation context
- It's been on market 45 days — a 3% lower offer ($271k) is reasonable based on typical stale-listing flexibility.
- Current owner paid $229k; 22% above their basis — modest negotiation headroom, anchor on the comps not their cost.
Risks & watch-outs
- Climate carrying-cost: major wind risk, 66% chance of damaging wind over 30y; extreme-heat days projected 7→23/yr by 2055 (HVAC capex compounding) — expect insurance premiums to compound above CPI over the hold.
Questions for the listing agent
- What do current leases actually rent for vs. the listed asking? Can we see a recent rent roll and the last 12 months of T-12 income?
- It's been on market 45 days. Have you received any prior offers? Is the seller open to a 28% concession, seller financing, or rate buy-down credit?
- What does the HOA fee cover, when was the last increase, and are there any pending special assessments or reserve-fund shortfalls?
- Is there a deadline driving the sale (1031 exchange, divorce, estate, relocation)? That informs how much negotiation room exists.
- Schools are B-rated — typically a magnet for longer-tenancy family renters. What's the average tenant stay here, and is there a school-zone premium baked into asking?
- Crime grade is F in this area — have there been break-ins, vandalism, or insurance claims at this property in the last 3 years? What carrier currently insures it and at what premium?
- The area grade is low — what's the realistic commute time and amenity access for the typical tenant pool here? Any planned neighborhood developments (good or bad) we should know about?
- What's the average days-on-market for RENTAL listings here right now (not sales)? A rising rental-DOM trend means longer vacancies and softer asking-rent achievability than the comps imply.
- What's the recent tenant-quality profile in this submarket — average credit score on applications, eviction rate, late-payment / NSF rate, and stable-employment percentage? A property-management company in the area should have these aggregated.
- How much new for-sale + rental construction is in the pipeline within 1–3 miles? Heavy new supply typically softens prices + rents 12–24 months out; constrained supply supports both.
Investment metrics
- 1% rule
- 0.72% ✗
- Cap rate
- 5.45%
- Cash-on-cash
- -3.03%
- DSCR
- 0.87
- GRM
- 11.6
CMA / ARV
- ARV (median comp)
- $319,321
- List price
- $279,000
- Delta
- -12.63%
- Verdict
- UNDERPRICED
- Comps
- 20 within 1.0 mi
Projected returns pro-forma
-3.0% appreciation · 6.56% rent growth · sell at horizon
- IRR
- -17.8%
- Equity multiple
- 0.35×
- Total profit
- $-50,392
- Equity at exit
- $41,600
- IRR
- -4.7%
- Equity multiple
- 0.65×
- Total profit
- $-27,490
- Equity at exit
- $24,123
Cash invested: $78,120 (down + closing). Projections, not guarantees.
Landlord ↔ Tenant lean methodology
- Overall (STATE)
- 90 Strongly Landlord-Friendly
- State Louisiana
- 90 Strongly Landlord-Friendly · R+12
- County
- — inherits STATE
- City
- — inherits STATE
ZIP-level market 71111
- Home prices YoY
- -34.8%
- Rents YoY
- 6.6%
- Active inventory
- 426
- Price-to-rent
- 11.6×
Monthly cashflow live
- Estimated rent
- $2,002 high interval (Pro) →
- Mortgage (P&I)
- −$1,463
- Tax from tax record
- −$177 /mo · $2,128/yr
- Insurance
- −$116
- HOA
- −$22
- Vacancy / Maint / Mgmt
- −$420
- Net cashflow
- $-197
Break-even live
Sensitivity live
| Price | -10% $-39 | -5% $-118 | +0% $-197 | +5% $-276 | +10% $-355 |
|---|---|---|---|---|---|
| Rent | -10% $-355 | -5% $-276 | +0% $-197 | +5% $-118 | +10% $-39 |
| Rate | -1.0pp $-57 | -0.5pp $-126 | base $-197 | +0.5pp $-269 | +1.0pp $-343 |
UW: 25.0% down · 7.5% · 30yr · 1.5% tax · 5.0% vac · 8.0% maint · 8.0% mgmt
Financing live
Cash to close
- Down payment
- $69,750
- Closing costs
- $8,370
- Reserves months
- —
- Total cash needed
- —
Loan-product check · same deal, 3 products live
Conventional
25% down · 7.5% · 30yr
- Down + closing
- —
- Monthly P&I
- —
- Monthly cashflow
- —
- DSCR
- —
- Eligible?
- —
Personal DTI + credit; lowest rate.
DSCR
20% down · 8.5% · 30yr
- Down + closing
- —
- Monthly P&I
- —
- Monthly cashflow
- —
- DSCR
- —
- Eligible?
- —
No personal income docs; deal must DSCR.
Hard money
10% down · 12.0% · 12mo
- Down + closing
- —
- Monthly P&I
- —
- Monthly cashflow
- —
- DSCR
- —
- Eligible?
- —
Short-term bridge; refi at stabilization.
Rent comps 9 comps
| Address | Beds | Baths | Sqft | Rent | $/sqft | DOM | Units | Dist |
|---|---|---|---|---|---|---|---|---|
| 606 Acacia Dr Bossier City, LA | 3.0 | 2.0 | 1765 | $2,200 | $1.25 | 23d | 1 | 0.50mi |
| 5226 John Wilson Dr Bossier City, LA | 2.0 | 2.0 | 1200 | $1,150 | $0.96 | 15d | 1 | 0.50mi |
| 217 Norwell Ln Bossier City, LA | 4.0 | 2.5 | 1851 | $2,400 | $1.30 | 23d | 1 | 0.65mi |
| 90 Kingston Xing Bossier City, LA | 1.0–3.0 | 1.0–2.0 | 1150 | $2,015 | $1.75 | 15d | 14 | 0.71mi |
| 303 Plum Orchard Ln Benton, LA | 4.0 | 3.0 | 2073 | $2,600 | $1.25 | 23d | 1 | 1.01mi |
| 3348 Grand Lake Dr Bossier City, LA | 3.0 | 2.0 | 1800 | $2,100 | $1.17 | 23d | 1 | 1.15mi |
| 3055 Vanceville Rd Bossier City, LA | 2.0–3.0 | 2.0 | 1112 | $1,995 | $1.79 | 15d | 6 | 1.16mi |
| 3283 Grand Lake Dr Bossier City, LA | 3.0 | 2.0 | 1302 | $1,950 | $1.50 | 23d | 1 | 1.23mi |
| 3461 Grand Cane Ln Bossier City, LA | 3.0 | 2.0 | 1297 | $2,100 | $1.62 | 15d | 1 | 1.50mi |
HOA detail
- Monthly dues
- $22 · $264/yr
Listing history 19 events
-
2026-06-21days on market $279,000 Active 45 DOM
-
2026-06-18days on market $279,000 Active 42 DOM
-
2026-06-17days on market $279,000 Active 41 DOM
-
2026-06-16days on market $279,000 Active 40 DOM
-
2026-06-15days on market $279,000 Active 39 DOM
-
2026-06-14days on market $279,000 Active 37 DOM
-
2026-06-13days on market $279,000 Active 36 DOM
-
2026-06-10days on market $279,000 Active 34 DOM
-
2026-06-09days on market $279,000 Active 33 DOM
-
2026-06-08days on market $279,000 Active 32 DOM
-
2026-06-07days on market $279,000 Active 31 DOM
-
2026-06-02days on market $279,000 Active 26 DOM
-
2026-06-01days on market $279,000 Active 25 DOM
-
2026-05-31days on market $279,000 Active 24 DOM
-
2026-05-30days on market $279,000 Active 23 DOM
-
2026-05-18price $279,000 621-char remark
-
2026-05-07$284,900 Active 621-char remark
-
2014-02-21soldstatus $228,640
-
2013-07-01soldstatus $217,400
ⓘ Source: listings_history table (triggers on properties + properties_extension) + one-shot
backfill from property_details.listing_events for pre-trigger history.
Tax reassessment forecast LA · Resets to sale price
- Current annual tax
- $2,128 · $177/mo
- Projected year-2 tax
- $2,128 · $177/mo
- Expected delta
- $0/yr ($0/mo · 0.0%)
ⓘ Screening estimate from a state-policy table — verify with the county assessor before closing.
Climate risk First Street
- Flood 1/10 Low FEMA zone X (unshaded) · 0% chance over 30 yrs
- Wildfire 2/10 Low
- Heat 8/10 Severe 7 d/yr ≥110°F today · 23 d/yr by 30 yrs out
- Wind 6/10 Major 66% chance of damaging wind over 30 yrs
- Air quality 2/10 Low 1 unhealthy d/yr today · 1 by 30 yrs out
Nearby sold comps map
Loading sold comps map…
Walkable amenities ~0.75 mi
Loading nearby amenities…
Taxation est. · year 1
- Rental income
- $24,026
- − Mortgage interest
- −$15,628
- − Property taxes
- −$2,128
- − Insurance
- −$1,395
- − Repairs & maintenance
- −$1,922
- − Management
- −$1,922
- − HOA
- −$264
- − Depreciation
- −$8,116
- Taxable loss
- −$7,350
- Est. tax savings @ 24.0%
- +$1,764
- After-tax cash flow
- $-600/yr
For passive investors: Depreciation is non-cash, so a rental often shows a tax loss while cash-flowing — sheltering income. Rental losses are passive: they offset passive income freely, and up to $25,000/yr can offset ordinary (W-2) income if you actively participate and your MAGI is under $100k (phasing out to $0 by $150k); unused losses carry forward. On sale, claimed depreciation is recaptured at up to 25%, and gains may owe capital-gains tax (a 1031 exchange can defer both). Figures are a year-1 estimate at your 24.0% rate — not tax advice; consult a CPA.
Schools (NCES district)
- District
- Bossier Parish
- NCES district ID
- 2200270
- Math proficiency
- 40% ▼ -32.00%
- Reading proficiency
- 47% ▼ -28.00%
- Median HH income
- $51,326
- Composite
- 37.5/100
- National rank
- #4402
- State rank
- #17 of 98 in LA
Livability — Bossier City
- Score
- 71/100
- State rank
- #47
- US rank
- #7044
Category grades
Schools grade is shown separately in the Schools card above.
Census & demographics
- County
- Bossier Parish · 98,704 people
- City population
- 91,925
- Metro
- Shreveport-Bossier City, LA
- Population (ZIP)
- 43,925
- Household income
- $65,292
- Rent vs Own
- Severe rent burden
- 1942.0
Population outlook (Bossier County) Hauer SSP2
- Today (2025)
- 143,247 people
- By 2030
- 151,802 · +6.0%
- By 2040
- 168,194 · +17.4%
- By 2050
- 183,533 · +28.1%
- By 2075
- 217,009 · +51.5%
- By 2100
- 230,091 · +60.6%
Race, ethnicity, and origin ACS 2023
- Neighborhood character
- Diverse neighborhood (Simpson 0.60)
- Race & ethnicity
- White 56% Black 29% Hispanic / Latino 9% Two or more races 8% Asian 3%
- Hispanic origin (detail)
- Mexican 5%
- Common ancestry
- Lithuanian 2% Iranian 1% Slovak 1%
- Foreign-born
- 5% · Canada, Vietnam
- Languages at home
- 90% English-only · Spanish 7% Vietnamese 1% French/Haitian/Cajun 1%
Political lean MEDSL · Bossier
- 2024 margin
- Solid R (+43.3) · D 27.7% · R 71.0% · Other 1.3%
- 2008→2024 swing
- +0.3pp no change · 2008: -43.7pp · 2024: -43.3pp
- All cycles
- 2024: R+43.3 2020: R+41.0 2016: R+45.8 2012: R+45.4 2008: R+43.7
Not yet ingested
- Civics
- —
Market trends
- HPI YoY
- ▼ -79.78%
- Current HPI
- 149.4336
- Rent YoY
- ▲ 6.56%
- Metro
- Shreveport-Bossier City, LA
- State GDP YoY
- ▲ 3.29%
- F500 in state
- 10
Industry mix (Fortune 500 HQ in LA)
| Industry | F500 HQs | Revenue |
|---|---|---|
| Telecommunications | 2 | $23B |
|
||
| Utilities | 1 | $12B |
|
||
| Wholesale / Distribution | 1 | $5B |
|
||
| Advertising | 1 | $2B |
|
||
Price history
+28.3% since first listed4 events — show timeline
- 2026-05-18 Price Changed $279,000 NTREIS
- 2026-05-07 Listed $284,900 NTREIS
- 2014-02-21 Sold (Public Records) $228,640 Public Records
- 2013-07-01 Sold (Public Records) $217,400 Public Records
Property tax history
+2.4%/yrLatest (2025): $2,128 · -1.0% YoY. Source: county tax records.
Cash-flow waterfall
monthlySold comps — $/sqft
last 12 mo · ≤1 miLoading sold comps…