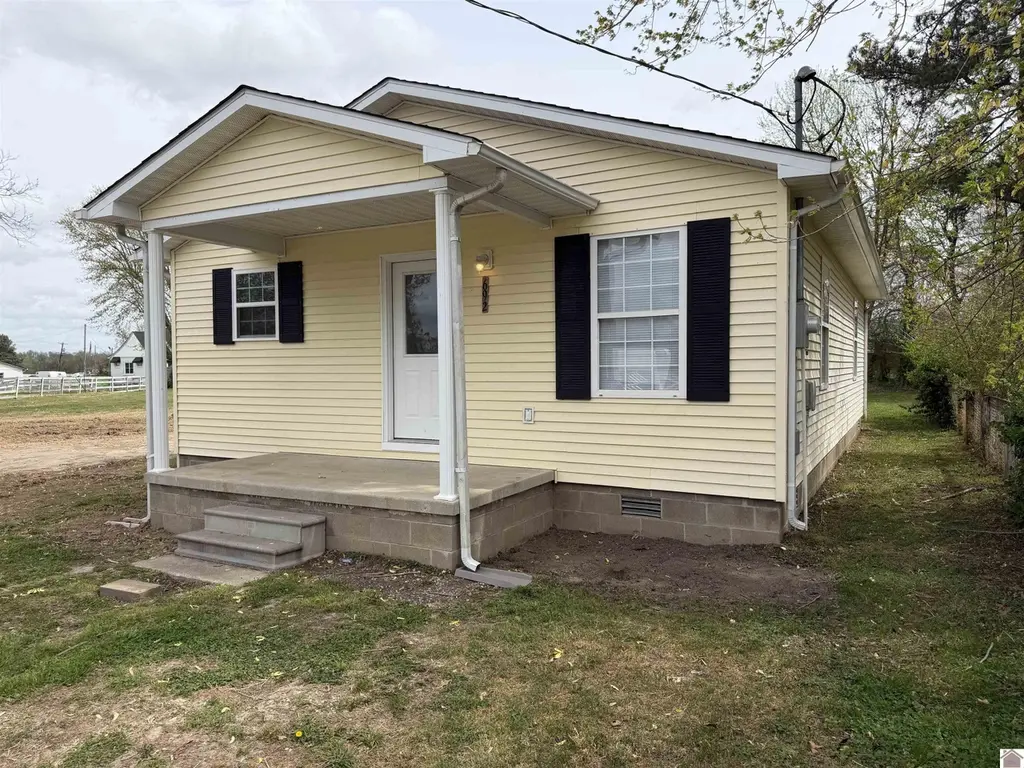
692 Olive St · La Center, KY
Flood risk 1/10 · Minimal
- FEMA flood zone
- X (unshaded)
- Chance of flooding over 30 yrs
- 0.0%
- Est. flood insurance / yr
- $507 – $1,088
Fire risk 1/10 · Minimal
- Est. fire insurance / yr
- $839 – $1,559
Heat risk 6/10 · Moderate
- Hot days now (above 108°F)
- 7 days/yr
- Hot days in 30 yrs
- 20 days/yr
Wind risk 3/10 · Minor
- Chance of severe wind over 30 yrs
- 7.0%
Air-quality risk 2/10 · Minimal
- Unhealthy air days now
- 1 days/yr
- Unhealthy air days in 30 yrs
- 1 days/yr
Risk factors via First Street. Map © Google.
Why this score? — see what drove the D grade
The composite is a weighted blend of 9 inputs, each scored 0–100. Each bar is that input's sub-score; the figure is the points it added to the 100-point composite (weight × sub-score).
- Cash flow +14.6/30.0
- ARV discount +7.5/15.0
- DSCR +4.4/10.0
- 1% rule +4.0/10.0
- Condition / age +4.0/5.0
- Schools +3.0/10.0
- Livability +3.0/5.0
- Rent growth +2.5/5.0
- Appreciation +0.0/10.0
$127,900
🖨 Deal sheet (PDF) 📄 Offer letter ✓ Due diligence
Listing remarks
Move-in ready! This 2 bedroom, 1 bath home has been completely remodeled. New appliances in kitchen, new paint and fixtures completely redone. Built in 1999 and looking for a new owner. Private dead-end location with farmland next door. Perfect if you are downsizing or for newlyweds. Low maintenance. All electric. New luxury vinyl flooring and a new roof, too! Cute, Cute, Cute!
Key facts
- Farmland next door
- Completely remodeled
- New appliances
Tags
Property features AI
Exterior
- Parking: Gravel parking
- Security: Smoke detector(s)
- Utilities: Public water; Public sewer; Cable available
- Home design: Single-family residence; Residential property; Single story
- Construction: Frame construction; Vinyl siding; Shingle roof
- Exterior features: Level lot
Interior
- Kitchen: Dishwasher; Refrigerator; Cooktop
- Flooring: Tile
- Bathrooms: 1 full bathroom
- Heating & cooling: Electric forced-air heating; Central air; Ceiling fan(s)
- Interior features: Eat-in kitchen; Pantry; Insulated windows; Smoke detector(s)
- Laundry & utility: Electric water heater
Neighborhood map
What this means for you Summary
Snapshot
- This is a 2-bed/1.0-bath single-family listed at $128k. Condition is rated good.
Deal economics
- At list price, monthly cash flow is $30 ($360/yr) — positive.
- The deal already cash-flows at list — no discount required.
- To meet the 1% rule (rent ≥ 1% of price), the offer needs to be $116k (9.6% below list).
- Recommended offer: $116k (9.6% below list) — sets the bar for 1% rule.
Location & tenants
- Location reads 59/100 on livability (#415 in KY) — a working-class tenant base; expect higher turnover. Strengths: cost of living A+; Watch: employment C-, housing C-, amenities F.
- Ballard County (rural): math 31% / reading 40% proficiency, ranked #61 of 165 in KY (top 37%) — families likely to look elsewhere, expect single-tenant / working-renter base with shorter leases.
- Zoned schools: Ballard County Elementary School (math 38% / reading 41%, grade F, #208 of 676 statewide, top 34%, 467 students, 58% FRL); Ballard County Middle School (math 24% / reading 39%, grade F, #125 of 217 statewide, top 63%, 215 students, 58% FRL).
- Market conditions: 56 active listings in the ZIP.
Forward outlook
- Local home prices are declining (-3.0%/yr); year-one equity from $884 of loan paydown is wiped out by about $4k of value loss. Plan a longer hold.
- Ballard County population projected to shrink 6% by 2050 — rents likely to lag national; underwrite the cash flow, not the appreciation.
Negotiation context
- It's been on market 79 days — a 6% lower offer ($120k) is reasonable based on typical stale-listing flexibility.
Risks & watch-outs
- Climate carrying-cost: extreme-heat days projected 7→20/yr by 2055 (HVAC capex compounding) — expect insurance premiums to compound above CPI over the hold.
Questions for the listing agent
- It's been on market 79 days. Have you received any prior offers? Is the seller open to a 10% concession, seller financing, or rate buy-down credit?
- Why hasn't it sold? Are there any deal-killer items the seller is aware of (foundation, flood, title, zoning, code violations)?
- Is there a deadline driving the sale (1031 exchange, divorce, estate, relocation)? That informs how much negotiation room exists.
- Schools are F-rated, which usually means shorter tenancies and higher turnover. Who's the typical renter profile here, and what's been the actual vacancy rate?
- The area grade is low — what's the realistic commute time and amenity access for the typical tenant pool here? Any planned neighborhood developments (good or bad) we should know about?
- What's the average days-on-market for RENTAL listings here right now (not sales)? A rising rental-DOM trend means longer vacancies and softer asking-rent achievability than the comps imply.
- What's the recent tenant-quality profile in this submarket — average credit score on applications, eviction rate, late-payment / NSF rate, and stable-employment percentage? A property-management company in the area should have these aggregated.
- How much new for-sale + rental construction is in the pipeline within 1–3 miles? Heavy new supply typically softens prices + rents 12–24 months out; constrained supply supports both.
Investment metrics
- 1% rule
- 0.90% ✗
- Cap rate
- 6.57%
- Cash-on-cash
- 1.00%
- DSCR
- 1.04
- GRM
- 9.2
CMA / ARV
- ARV (on-the-fly)
- $74,880
- Comps found
- 5
Show comp detail 5 sales within ~0.75 mi
| Address | Dist | Beds/Ba | Sqft | Sold | Price | $/sf | Match |
|---|---|---|---|---|---|---|---|
| 338 Pine St | 0.34mi | 3/1.0 (+1) | 1,124 (+8%) | 6mo | $160,000 | $142 | 60 |
| 345 Pine St | 0.34mi | 2/2.0 | 1,016 (-2%) | 20mo | $73,000 | $72 | 60 |
| 240 W 3rd St | 0.36mi | 2/1.0 | 1,080 (+4%) | 23mo | $69,000 | $64 | 58 |
| 626 Olive St | 0.08mi | 3/1.5 (+1) | 920 (-12%) | 21mo | $100,000 | $109 | 53 |
| 209 Oak St | 0.49mi | 3/2.0 (+1) | 1,184 (+14%) | 18mo | $39,100 | $33 | 30 |
Match score weights: distance 35% · size 25% · config 20% · recency 20%. Top-matched comps best support the ARV.
Projected returns pro-forma
-3.0% appreciation · 3.0% rent growth · sell at horizon
- IRR
- -14.7%
- Equity multiple
- 0.48×
- Total profit
- $-18,800
- Equity at exit
- $19,070
- IRR
- -6.0%
- Equity multiple
- 0.61×
- Total profit
- $-13,842
- Equity at exit
- $11,058
Cash invested: $35,812 (down + closing). Projections, not guarantees.
Landlord ↔ Tenant lean methodology
- Overall (STATE)
- 83 Strongly Landlord-Friendly
- State Kentucky
- 83 Strongly Landlord-Friendly · R+16
- County
- — inherits STATE
- City
- — inherits STATE
ZIP-level market 42058
- Home prices YoY
- -4.8%
- Active inventory
- 56
- Price-to-rent
- 9.2×
Monthly cashflow live
- Estimated rent
- $1,157 medium interval (Pro) →
- Mortgage (P&I)
- −$671
- Tax est. 1.5%
- −$160 /mo · $1,918/yr
- Insurance
- −$53
- HOA
- −$0
- Vacancy / Maint / Mgmt
- −$243
- Net cashflow
- $30
Break-even live
Sensitivity live
| Price | -10% $118 | -5% $74 | +0% $30 | +5% $-14 | +10% $-58 |
|---|---|---|---|---|---|
| Rent | -10% $-61 | -5% $-16 | +0% $30 | +5% $76 | +10% $121 |
| Rate | -1.0pp $94 | -0.5pp $62 | base $30 | +0.5pp $-3 | +1.0pp $-37 |
UW: 25.0% down · 7.5% · 30yr · 1.5% tax · 5.0% vac · 8.0% maint · 8.0% mgmt
Financing live
Cash to close
- Down payment
- $31,975
- Closing costs
- $3,837
- Reserves months
- —
- Total cash needed
- —
Loan-product check · same deal, 3 products live
Conventional
25% down · 7.5% · 30yr
- Down + closing
- —
- Monthly P&I
- —
- Monthly cashflow
- —
- DSCR
- —
- Eligible?
- —
Personal DTI + credit; lowest rate.
DSCR
20% down · 8.5% · 30yr
- Down + closing
- —
- Monthly P&I
- —
- Monthly cashflow
- —
- DSCR
- —
- Eligible?
- —
No personal income docs; deal must DSCR.
Hard money
10% down · 12.0% · 12mo
- Down + closing
- —
- Monthly P&I
- —
- Monthly cashflow
- —
- DSCR
- —
- Eligible?
- —
Short-term bridge; refi at stabilization.
Listing history 17 events
-
2026-06-21days on market $127,900 Active 79 DOM
-
2026-06-19days on market $127,900 Active 77 DOM
-
2026-06-18days on market $127,900 Active 76 DOM
-
2026-06-17days on market $127,900 Active 75 DOM
-
2026-06-16days on market $127,900 Active 74 DOM
-
2026-06-15days on market $127,900 Active 73 DOM
-
2026-06-14days on market $127,900 Active 71 DOM
-
2026-06-12days on market $127,900 Active 70 DOM
-
2026-06-09days on market $127,900 Active 67 DOM
-
2026-06-08days on market $127,900 Active 66 DOM
-
2026-06-07days on market $127,900 Active 65 DOM
-
2026-06-02days on market $127,900 Active 60 DOM
-
2026-06-01days on market $127,900 Active 59 DOM
-
2026-05-31days on market $127,900 Active 58 DOM
-
2026-05-30days on market $127,900 Active 57 DOM
-
2026-04-23price $127,900
-
2026-04-03$129,900 Active
ⓘ Source: listings_history table (triggers on properties + properties_extension) + one-shot
backfill from property_details.listing_events for pre-trigger history.
Climate risk First Street
- Flood 1/10 Low FEMA zone X (unshaded) · 0% chance over 30 yrs
- Wildfire 1/10 Low
- Heat 6/10 Major 7 d/yr ≥108°F today · 20 d/yr by 30 yrs out
- Wind 3/10 Moderate 7% chance of damaging wind over 30 yrs
- Air quality 2/10 Low 1 unhealthy d/yr today · 1 by 30 yrs out
Nearby sold comps map
Loading sold comps map…
Walkable amenities ~0.75 mi
Loading nearby amenities…
Taxation est. · year 1
- Rental income
- $13,881
- − Mortgage interest
- −$7,164
- − Property taxes
- −$1,918
- − Insurance
- −$640
- − Repairs & maintenance
- −$1,110
- − Management
- −$1,110
- − Depreciation
- −$3,721
- Taxable loss
- −$1,783
- Est. tax savings @ 24.0%
- +$428
- After-tax cash flow
- $787/yr
For passive investors: Depreciation is non-cash, so a rental often shows a tax loss while cash-flowing — sheltering income. Rental losses are passive: they offset passive income freely, and up to $25,000/yr can offset ordinary (W-2) income if you actively participate and your MAGI is under $100k (phasing out to $0 by $150k); unused losses carry forward. On sale, claimed depreciation is recaptured at up to 25%, and gains may owe capital-gains tax (a 1031 exchange can defer both). Figures are a year-1 estimate at your 24.0% rate — not tax advice; consult a CPA.
Condition & rehab AI · 13 photos
This move-in ready home has been completely remodeled with new appliances, flooring, and paint. It's in good condition with a good roof and new siding, making it a great investment.
Value-add opportunities
- Both Painting exterior and interior walls — Enhances curb appeal and interior aesthetics
- Both Landscaping and adding curb appeal features — Improves curb appeal and enhances property value
- Both Adding smart home features — Enhances convenience and adds modern appeal
Renovation cost estimate screening
Value-add ROI direction
- Both Painting exterior and interior walls — Enhances curb appeal and interior aesthetics ↑
- Both Landscaping and adding curb appeal features — Improves curb appeal and enhances property value ↑
- Both Adding smart home features — Enhances convenience and adds modern appeal ↑
ⓘ Cost ranges are severity-bucket heuristics (US national rule-of-thumb). Get contractor quotes + a written scope before underwriting a rehab budget.
Schools (NCES district)
- District
- Ballard County
- NCES district ID
- 2100210
- Math proficiency
- 31% ▼ -12.00%
- Reading proficiency
- 40% ▼ -16.00%
- Median HH income
- $42,202
- Composite
- 29.99/100
- National rank
- #6363
- State rank
- #61 of 165 in KY
Livability — La Center
- Score
- 59/100
- State rank
- #415
- US rank
- #20035
Category grades
Schools grade is shown separately in the Schools card above.
Census & demographics
- Census place
- La Center, KY
- Population (ZIP)
- 2,122
Population outlook (Ballard County) Hauer SSP2
- Today (2025)
- 8,166 people
- By 2030
- 8,092 · -0.9%
- By 2040
- 7,905 · -3.2%
- By 2050
- 7,648 · -6.3%
- By 2075
- 7,237 · -11.4%
- By 2100
- 6,537 · -19.9%
Race, ethnicity, and origin ACS 2023
- Neighborhood character
- Predominantly White (94%)
- Race & ethnicity
- White 94% Two or more races 4% Hispanic / Latino 3%
- Common ancestry
- Slovak 3% Italian 2% Scottish 1%
- Foreign-born
- 0%
- Languages at home
- 97% English-only · Spanish 3%
Political lean MEDSL · Ballard
- 2024 margin
- Solid R (+64.4) · D 17.1% · R 81.5% · Other 1.5%
- 2008→2024 swing
- -37.1pp toward R · 2008: -27.3pp · 2024: -64.4pp
- All cycles
- 2024: R+64.4 2020: R+59.9 2016: R+57.2 2012: R+37.4 2008: R+27.3
Not yet ingested
- Civics
- —
Market trends
- HPI YoY
- ▼ -11.03%
- Current HPI
- 217.6383
- Rent YoY
- —
- Metro
- —
- State GDP YoY
- ▲ 1.81%
- F500 in state
- 4
Industry mix (Fortune 500 HQ in KY)
| Industry | F500 HQs | Revenue |
|---|---|---|
| Healthcare | 1 | $118B |
|
||
| Food / Beverage | 1 | $7B |
|
||
Price history
-1.5% since first listed2 events — show timeline
- 2026-04-23 Price Changed $127,900 WKRMLS
- 2026-04-03 Listed $129,900 WKRMLS
Cash-flow waterfall
monthlySold comps — $/sqft
last 12 mo · ≤1 miLoading sold comps…