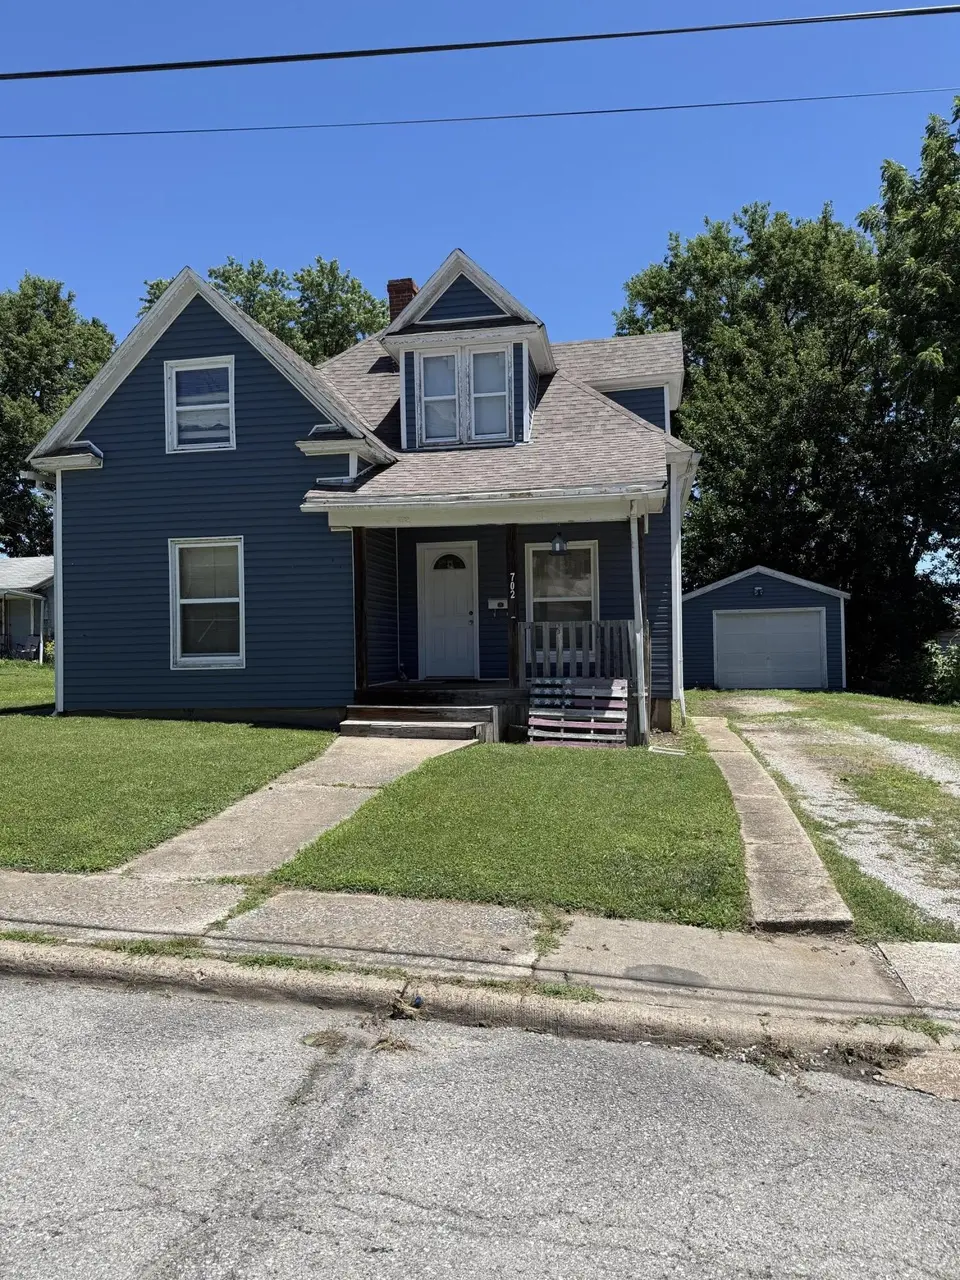
702 N Clark St · Mexico, MO
Flood risk 1/10 · Minimal
- FEMA flood zone
- X (unshaded)
- Chance of flooding over 30 yrs
- 0.0%
- Est. flood insurance / yr
- $507 – $1,088
Fire risk 3/10 · Minor
- Est. fire insurance / yr
- $1,054 – $1,958
Heat risk 4/10 · Minor
- Hot days now (above 106°F)
- 7 days/yr
- Hot days in 30 yrs
- 18 days/yr
Wind risk 2/10 · Minimal
- Chance of severe wind over 30 yrs
- —
Air-quality risk 1/10 · Minimal
- Unhealthy air days now
- 0 days/yr
- Unhealthy air days in 30 yrs
- 0 days/yr
Risk factors via First Street. Map © Google.
Why this score? — see what drove the C- grade
The composite is a weighted blend of 9 inputs, each scored 0–100. Each bar is that input's sub-score; the figure is the points it added to the 100-point composite (weight × sub-score).
- Cash flow +21.2/30.0
- ARV discount +7.5/15.0
- DSCR +6.8/10.0
- 1% rule +4.6/10.0
- Livability +3.2/5.0
- Schools +2.9/10.0
- Rent growth +2.5/5.0
- Condition / age +2.5/5.0
- Appreciation +0.0/10.0
$125,000
🖨 Deal sheet 📄 Offer letter ✓ Due diligence
Listing remarks MLS
CHECK OUT THIS LITTLE GEM! You don't wanna miss your chance to grab your new forever home! This fantastic and unique home sits close to town in a quiet little neighborhood close to school, grocery store, and restaurants. Your new home features 4 BR (Master is non-conforming), 1.5 B, 1.5 stories, detached garage and huge fenced back yard. Brand new siding just installed June 2022. Schedule your showing today before you miss your chance to grab this quaint little bungalow with its unrivalled character!
Key facts
- Formal dining room
- Bonus room
- Spacious living room
Tags
Property features AI
Exterior
- Parking: Gravel parking
- Utilities: Public water; Public sewer
- Home design: Residential property; One and one-half levels (2 stories total)
- Construction: Vinyl siding; Shingle roof
- Exterior features: Front porch; Shed(s) on the property; Lot approximately 60 x 114; R-1 zoning
Interior
- Kitchen: Dishwasher; Refrigerator; Trash compactor
- Bedrooms: Master bedroom located downstairs
- Bathrooms: 1 full bathroom
- Heating & cooling: Natural gas heating with forced air; Central air conditioning
- Interior features: Eat-in kitchen; Master bedroom on the main level; 9 total rooms; Crawl space basement
- Laundry & utility: Laundry on the main level; Gas water heater
Neighborhood map
What this means for you Summary
Snapshot
- This is a 4-bed/1.0-bath other listed at $125k.
Deal economics
- At list price, monthly cash flow is $181 ($2k/yr) — positive.
- The deal already cash-flows at list — no discount required.
- To meet the 1% rule (rent ≥ 1% of price), the offer needs to be $119k (4.5% below list).
- Recommended offer: $119k (4.5% below list) — sets the bar for 1% rule.
- Cap rate 8.0% vs local median 4.5% in Mexico — top-decile yield for the area; either an underpriced asset or a hidden risk that comps aren't pricing in. Stress-test before assuming the spread holds.
Location & tenants
- Location reads 65/100 on livability (#256 in MO) — a middle-class / working-renter tenant base. Strengths: cost of living A+, housing A, health & safety A-; Watch: crime F, amenities F, commute F.
- Mexico 59 (town): math 31% / reading 38% proficiency, ranked #229 of 324 in MO (top 71%) — families likely to look elsewhere, expect single-tenant / working-renter base with shorter leases.
- Zoned schools: Hawthorne Elem. (math 28% / reading 37%, grade F, #751 of 1,115 statewide, top 68%, 429 students, 100% FRL); Mexico Middle (math 33% / reading 34%, grade F, #260 of 391 statewide, top 67%, 503 students, 100% FRL); Mexico High (math 22% / reading 47%, grade F, #321 of 521 statewide, top 67%, 746 students, 53% FRL) — zoned schools average 84% FRL vs 52% district-wide (32 pts higher); higher-poverty schools than district average — tighter screening recommended.
- Market conditions: 134 active listings in the ZIP; 4 comparable units currently listed for rent nearby; rentals lingering (median 44d on market — plan ~5-8 weeks vacancy on turnover, expect pricing pressure); 50% of comp listings sitting > 30 days — soft ceiling on asking rent; 27 units permitted in Audrain County in 2024 (0 in 5+ unit buildings).
Forward outlook
- Local home prices are declining (-3.0%/yr); year-one equity from $864 of loan paydown is wiped out by about $4k of value loss. Plan a longer hold.
- Audrain County population projected at +16% by 2050 — long-run rental-demand tailwind backs the buy-and-hold thesis.
Negotiation context
- Only 1 days on market — expect competitive offers; lowballing is unlikely to land.
- 8 sale attempts since 9y ago with the ask held roughly flat each time — persistent listings suggest the price (not the market) is what's stuck; bring a comps-based counter.
- Current owner paid $50k; list at $125k implies a 153% gain — meaningful room to come down on a strong offer.
Risks & watch-outs
- Watch-outs: built in 1940 — expect roof / HVAC / electrical / plumbing capex.
Questions for the listing agent
- Built in 1940 — when were the roof, HVAC, electrical panel, plumbing, and water heater last replaced?
- Is there a deadline driving the sale (1031 exchange, divorce, estate, relocation)? That informs how much negotiation room exists.
- Schools are D-rated, which usually means shorter tenancies and higher turnover. Who's the typical renter profile here, and what's been the actual vacancy rate?
- Crime grade is F in this area — have there been break-ins, vandalism, or insurance claims at this property in the last 3 years? What carrier currently insures it and at what premium?
- What's the average days-on-market for RENTAL listings here right now (not sales)? A rising rental-DOM trend means longer vacancies and softer asking-rent achievability than the comps imply.
- What's the recent tenant-quality profile in this submarket — average credit score on applications, eviction rate, late-payment / NSF rate, and stable-employment percentage? A property-management company in the area should have these aggregated.
- How much new for-sale + rental construction is in the pipeline within 1–3 miles? Heavy new supply typically softens prices + rents 12–24 months out; constrained supply supports both.
Investment metrics
- 1% rule
- 0.96% ✗
- Cap rate
- 8.03%
- Cash-on-cash
- 6.20%
- DSCR
- 1.28
- GRM
- 8.7
CMA / ARV
No comps found within radius.
Projected returns pro-forma
-3.0% appreciation · 3.0% rent growth · sell at horizon
- IRR
- -6.8%
- Equity multiple
- 0.75×
- Total profit
- $-8,775
- Equity at exit
- $18,638
- IRR
- 2.8%
- Equity multiple
- 1.20×
- Total profit
- $7,018
- Equity at exit
- $10,808
Cash invested: $35,000 (down + closing). Projections, not guarantees.
Landlord ↔ Tenant lean methodology
- Overall (STATE)
- 81 Strongly Landlord-Friendly
- State Missouri
- 81 Strongly Landlord-Friendly · R+10
- County
- — inherits STATE
- City
- — inherits STATE
ZIP-level market 65265
- Home prices YoY
- -30.2%
- Active inventory
- 134
- Price-to-rent
- 8.7×
Monthly cashflow live
- Estimated rent
- $1,194 medium interval (Pro) →
- Mortgage (P&I)
- −$656
- Tax from tax record
- −$55 /mo · $659/yr
- Insurance
- −$52
- HOA
- −$0
- Vacancy / Maint / Mgmt
- −$251
- Net cashflow
- $181
Break-even live
UW: 25.0% down · 7.5% · 30yr · 1.5% tax · 5.0% vac · 8.0% maint · 8.0% mgmt
Financing live
Cash to close
- Down payment
- $31,250
- Closing costs
- $3,750
- Reserves months
- —
- Total cash needed
- —
Loan-product check · same deal, 3 products live
Conventional
25% down · 7.5% · 30yr
- Down + closing
- —
- Monthly P&I
- —
- Monthly cashflow
- —
- DSCR
- —
- Eligible?
- —
Personal DTI + credit; lowest rate.
DSCR
20% down · 8.5% · 30yr
- Down + closing
- —
- Monthly P&I
- —
- Monthly cashflow
- —
- DSCR
- —
- Eligible?
- —
No personal income docs; deal must DSCR.
Hard money
10% down · 12.0% · 12mo
- Down + closing
- —
- Monthly P&I
- —
- Monthly cashflow
- —
- DSCR
- —
- Eligible?
- —
Short-term bridge; refi at stabilization.
Rent comps 4 comps
| Address | Beds | Baths | Sqft | Rent | $/sqft | DOM | Units | Dist |
|---|---|---|---|---|---|---|---|---|
| 609 Carson St Mexico, MO | 3.0 | 1.0 | 1100 | $1,150 | $1.05 | 21d | 1 | 0.25mi |
| 1227 W Breckenridge Dr Apt 04 Mexico, MO | 3.0 | 1.0 | 875 | $870 | $0.99 | 43d | 1 | 0.99mi |
| 1312 W Breckenridge Dr Apt 02 Mexico, MO | 3.0 | 1.0 | 900 | $870 | $0.97 | 13d | 1 | 1.03mi |
| 1730 Sierra St Mexico, MO | 3.0 | 2.0 | 1150 | $1,950 | $1.70 | 43d | 1 | 1.14mi |
Listing history 5 events
-
2026-06-17days on market $125,000 Active 1 DOM
-
2026-06-16days on market $125,000 Active 4 DOM
-
2026-06-15days on market $125,000 Active 3 DOM
-
2026-06-13remarks 576-char remark
-
2026-06-13$125,000 Active 1 DOM
ⓘ Source: listings_history table (triggers on properties + properties_extension) + one-shot
backfill from property_details.listing_events for pre-trigger history.
Tax reassessment forecast MO · Resets to sale price
- Current annual tax
- $659 · $55/mo
- Projected year-2 tax
- $1,212 · $101/mo
- Expected delta
- +$554/yr (+$46/mo · 84.1%)
ⓘ Screening estimate from a state-policy table — verify with the county assessor before closing.
Climate risk First Street
- Flood 1/10 Low FEMA zone X (unshaded) · 0% chance over 30 yrs
- Wildfire 3/10 Moderate
- Heat 4/10 Moderate 7 d/yr ≥106°F today · 18 d/yr by 30 yrs out
- Wind 2/10 Low
- Air quality 1/10 Low 0 unhealthy d/yr today · 0 by 30 yrs out
Nearby sold comps map
Loading sold comps map…
Walkable amenities ~0.75 mi
Loading nearby amenities…
Taxation est. · year 1
- Rental income
- $14,331
- − Mortgage interest
- −$7,002
- − Property taxes
- −$659
- − Insurance
- −$625
- − Repairs & maintenance
- −$1,146
- − Management
- −$1,146
- − Depreciation
- −$3,636
- Taxable income
- $116
- Est. tax owed @ 24.0%
- −$28
- After-tax cash flow
- $2,144/yr
For passive investors: Depreciation is non-cash, so a rental often shows a tax loss while cash-flowing — sheltering income. Rental losses are passive: they offset passive income freely, and up to $25,000/yr can offset ordinary (W-2) income if you actively participate and your MAGI is under $100k (phasing out to $0 by $150k); unused losses carry forward. On sale, claimed depreciation is recaptured at up to 25%, and gains may owe capital-gains tax (a 1031 exchange can defer both). Figures are a year-1 estimate at your 24.0% rate — not tax advice; consult a CPA.
Schools (NCES district)
- District
- Mexico 59
- NCES district ID
- 2920810
- Math proficiency
- 31% ▼ -3.00%
- Reading proficiency
- 38% ▼ -4.00%
- Median HH income
- $41,152
- Composite
- 29.07/100
- National rank
- #6601
- State rank
- #229 of 324 in MO
Livability — Mexico
- Score
- 65/100
- State rank
- #256
- US rank
- #12405
Category grades
Schools grade is shown separately in the Schools card above.
Census & demographics
- Census place
- Mexico, MO
- Population (ZIP)
- 15,131
Population outlook (Audrain County) Hauer SSP2
- Today (2025)
- 27,791 people
- By 2030
- 28,684 · +3.2%
- By 2040
- 30,598 · +10.1%
- By 2050
- 32,319 · +16.3%
- By 2075
- 36,395 · +31.0%
- By 2100
- 37,277 · +34.1%
Race, ethnicity, and origin ACS 2023
- Neighborhood character
- Predominantly White (84%)
- Race & ethnicity
- White 84% Two or more races 6% Black 5% Hispanic / Latino 4%
- Common ancestry
- Italian 2% Lithuanian 2% Slovak 1%
- Foreign-born
- 2% · Canada
- Languages at home
- 96% English-only · Spanish 3% Chinese 1%
Political lean MEDSL · Audrain
- 2024 margin
- Solid R (+47.6) · D 25.6% · R 73.2% · Other 1.2%
- 2008→2024 swing
- -31.6pp toward R · 2008: -16.1pp · 2024: -47.6pp
- All cycles
- 2024: R+47.6 2020: R+47.2 2016: R+44.0 2012: R+26.6 2008: R+16.1
Not yet ingested
- Civics
- —
Market trends
- HPI YoY
- ▼ -92.24%
- Current HPI
- 213.6163
- Rent YoY
- —
- Metro
- —
- State GDP YoY
- ▲ 1.84%
- F500 in state
- 20
Industry mix (Fortune 500 HQ in MO)
| Industry | F500 HQs | Revenue |
|---|---|---|
| Healthcare | 1 | $163B |
|
||
| Insurance | 1 | $21B |
|
||
| Industrial Technology | 1 | $17B |
|
||
| Retail | 1 | $16B |
|
||
| Industrial Distribution | 1 | $10B |
|
||
| Utilities | 1 | $9B |
|
||
Price history
+152.5% since first listed20 events — show timeline
- 2026-06-12 Listed $125,000 HMMLS
- 2023-01-20 Sold (MLS) — HMMLS
- 2023-01-20 Sold (MLS) — JCMLS
- 2023-01-20 Sold (MLS) — CBORMLS
- 2022-12-28 Pending — CBORMLS
- 2022-12-28 Pending — JCMLS
- 2022-11-14 Relisted — JCMLS
- 2022-11-14 Relisted — HMMLS
- 2022-11-14 Relisted — CBORMLS
- 2022-10-19 Pending — JCMLS
- 2022-10-19 Pending — CBORMLS
- 2022-09-02 Price Changed $79,900 JCMLS
- 2022-09-02 Price Changed $79,900 HMMLS
- 2022-09-02 Price Changed $79,900 CBORMLS
- 2022-07-25 Price Changed $89,900 HMMLS
- 2022-07-25 Listed $89 HMMLS
- 2022-07-25 Listed $89,900 CBORMLS
- 2022-07-25 Listed $89,900 JCMLS
- 2017-07-28 Listed $49,900 HMMLS
- 2004-03-01 Sold (Public Records) $49,500 Public Records
Property tax history
+0.7%/yrLatest (2025): $659 · +0.4% YoY. Source: county tax records.
Cash-flow waterfall
monthlySold comps — $/sqft
last 12 mo · ≤1 miLoading sold comps…