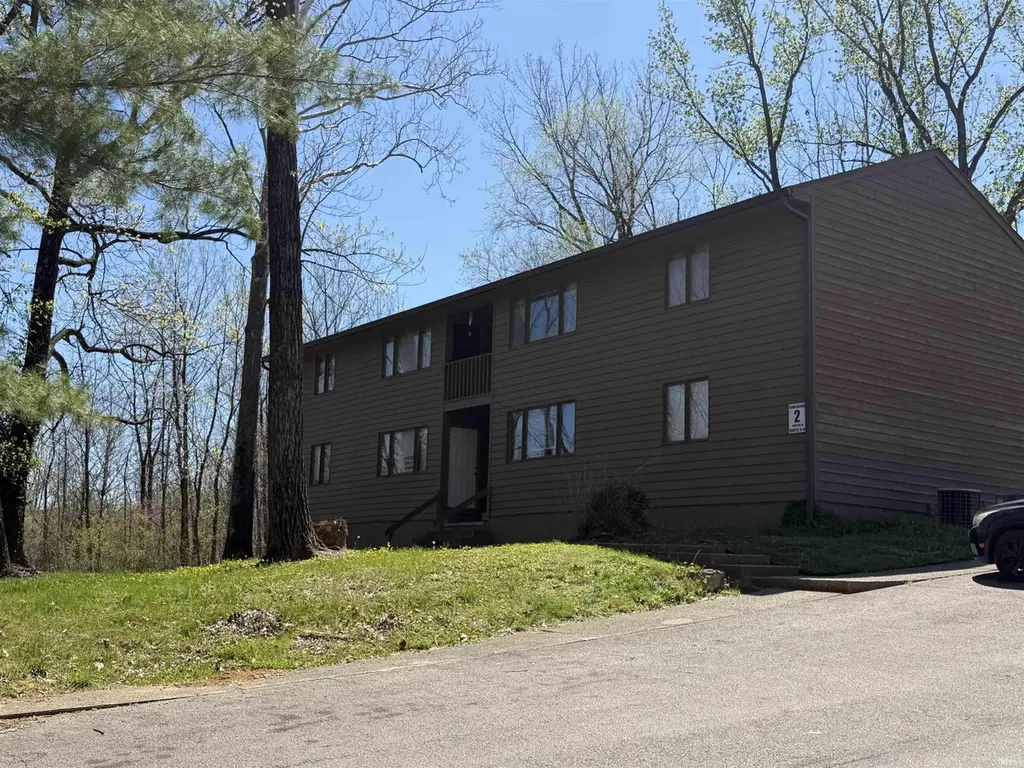
 44-Plex
2600 6th St · Bedford, IN
Flood risk 1/10 · Minimal
- FEMA flood zone
- X (unshaded)
- Chance of flooding over 30 yrs
- 0.0%
- Est. flood insurance / yr
- $507 – $1,088
Fire risk 3/10 · Minor
- Est. fire insurance / yr
- $717 – $1,331
Heat risk 4/10 · Minor
- Hot days now (above 104°F)
- 7 days/yr
- Hot days in 30 yrs
- 18 days/yr
Wind risk 2/10 · Minimal
- Chance of severe wind over 30 yrs
- 1.0%
Air-quality risk 2/10 · Minimal
- Unhealthy air days now
- 0 days/yr
- Unhealthy air days in 30 yrs
- 1 days/yr
Risk factors via First Street. Map © Google.
Why this score? — see what drove the C+ grade
The composite is a weighted blend of 9 inputs, each scored 0–100. Each bar is that input's sub-score; the figure is the points it added to the 100-point composite (weight × sub-score).
- Cash flow +30.0/30.0
- DSCR +10.0/10.0
- 1% rule +9.0/10.0
- Livability +4.0/5.0
- Schools +3.2/10.0
- Rent growth +2.5/5.0
- Condition / age +2.5/5.0
- ARV discount +0.0/15.0
- Appreciation +0.0/10.0
$3,000,000
🖨 Deal sheet 📄 Offer letter ✓ Due diligence
Multi-family units
County records classify this as Multi-Family (5+ Unit). Listing-text estimate: 44 units. confirmed
5+ unit building — per-unit beds/baths from public records are typically unavailable; the breakdown below (if shown) is an estimate from the listing text.
Listing remarks MLS
Great investment opportunity featuring a 44-unit apartment community comprised of 2BD/1BA units (~900 SF) across 10 buildings. Property maintains strong occupancy (~95%) with recent leases achieving $875–$895 per unit, plus a $50/month utility reimbursement for water, sewer, and trash. Tenants pay electric, providing low owner utility exposure. Current ownership has implemented a proven rent growth strategy, with continued opportunity to standardize remaining units and increase income. The property generates approximately $278,000+ in net operating income, offering an attractive ~9% cap rate at the current list price. Recent improvements include HVAC upgrades, unit renovations, and a new lift station (2020), reducing near-term capital expenditure needs. Additional updates throughout include flooring, paint, appliances, and mechanical improvements.
Key facts
- Unit renovations
- Hvac upgrades
- Appliances
Tags
Neighborhood map
What this means for you Summary
Snapshot
- This is a 44 × 2-bed/1.0-bath units multifamily listed at $3.00M.
Deal economics
- At list price, monthly cash flow is $15k ($184k/yr) — positive. Per door: $349/mo.
- The deal already cash-flows at list — no discount required.
- Meets the 1% rule at list price ($42k rent vs $3.00M).
- Recommended offer: $2.82M (6.0% below list) — sets the bar for market timing.
- Cap rate 12.4% vs local median 4.2% in Bedford — top-decile yield for the area; either an underpriced asset or a hidden risk that comps aren't pricing in. Stress-test before assuming the spread holds.
Location & tenants
- Location reads 80/100 on livability (#23 in IN, #1,958 nationally) — a professional / high-income tenant draw. Strengths: crime A+, cost of living A+, housing A+; Watch: schools C-, employment D, commute F.
- North Lawrence Community Schools (rural): math 35% / reading 40% proficiency, ranked #170 of 301 in IN (top 56%) — families likely to look elsewhere, expect single-tenant / working-renter base with shorter leases.
- Market conditions: 158 active listings in the ZIP; 8 units permitted in Lawrence County in 2024 (0 in 5+ unit buildings).
- At $42,084/mo this rent would consume 741% of the median local household income ($68k/yr) (locally 507% of renters already pay >50% of income on rent) — very limited rent-growth headroom before tenants either downsize or default.
Forward outlook
- Local home prices are declining (-3.0%/yr); year-one equity from $21k of loan paydown is wiped out by about $90k of value loss. Plan a longer hold.
- Lawrence County population projected at -14% by 2050 — secular population decline; favor cash flow + early exit over multi-decade hold.
- At projected returns (-3.0% appreciation + 3.0% rent growth), your $840k cash investment doubles in ~6 years — after that, you're playing with house money.
Negotiation context
- It's been on market 73 days — a 6% lower offer ($2.82M) is reasonable based on typical stale-listing flexibility.
- 2 sale attempts since 6y ago with the ask held roughly flat each time — persistent listings suggest the price (not the market) is what's stuck; bring a comps-based counter.
- Current owner paid $2.19M; 37% above their basis — modest negotiation headroom, anchor on the comps not their cost.
Questions for the listing agent
- It's been on market 73 days. Have you received any prior offers? Is the seller open to a 6% concession, seller financing, or rate buy-down credit?
- Can we see the unit-by-unit rent roll, current vacancy, and any below-market leases? What's the average tenancy length?
- What capital expenditures (roof, boiler, parking lot, exteriors) have been made in the last 5 years, and what's planned in the next 2?
- Why hasn't it sold? Are there any deal-killer items the seller is aware of (foundation, flood, title, zoning, code violations)?
- Is there a deadline driving the sale (1031 exchange, divorce, estate, relocation)? That informs how much negotiation room exists.
- What's the average days-on-market for RENTAL listings here right now (not sales)? A rising rental-DOM trend means longer vacancies and softer asking-rent achievability than the comps imply.
- What's the recent tenant-quality profile in this submarket — average credit score on applications, eviction rate, late-payment / NSF rate, and stable-employment percentage? A property-management company in the area should have these aggregated.
- How much new apartment / multifamily construction is in the pipeline within 1–3 miles? Heavy new supply (>2% of stock underway) typically softens rents 12–24 months out; light construction supports rent growth.
Investment metrics
- 1% rule
- 1.40% ✓
- Cap rate
- 12.44%
- Cash-on-cash
- 21.96%
- DSCR
- 1.98
- GRM
- 5.9
CMA / ARV
- ARV (median comp)
- $2,512,547
- List price
- $3,000,000
- Delta
- 19.40%
- Verdict
- OVERPRICED
- Comps
- 1 within 2.0 mi
Projected returns pro-forma
-3.0% appreciation · 3.0% rent growth · sell at horizon
- IRR
- 14.6%
- Equity multiple
- 1.59×
- Total profit
- $491,981
- Equity at exit
- $447,310
- IRR
- 23.3%
- Equity multiple
- 3.01×
- Total profit
- $1,684,766
- Equity at exit
- $259,385
Cash invested: $840,000 (down + closing). Projections, not guarantees.
Landlord ↔ Tenant lean methodology
- Overall (STATE)
- 90 Strongly Landlord-Friendly
- State Indiana
- 90 Strongly Landlord-Friendly · R+11
- County
- — inherits STATE
- City
- — inherits STATE
ZIP-level market 47421
- Home prices YoY
- -25.2%
- Active inventory
- 158
- Price-to-rent
- 261.4×
Monthly cashflow live
- Estimated rent
- $42,084 medium interval (Pro) →
- Mortgage (P&I)
- −$15,732
- Tax from tax record
- −$889 /mo · $10,670/yr
- Insurance
- −$1,250
- HOA
- −$0
- Vacancy / Maint / Mgmt
- −$8,838
- Net cashflow
- $15,375
Break-even live
44-unit breakdown (identical units grouped — click to expand)
| Units | Beds | Baths | Est. rent |
|---|---|---|---|
| 44× units | 2 | 1 | $42,064 |
| #1 | 2 | 1 | $956 |
| #2 | 2 | 1 | $956 |
| #3 | 2 | 1 | $956 |
| #4 | 2 | 1 | $956 |
| #5 | 2 | 1 | $956 |
| #6 | 2 | 1 | $956 |
| #7 | 2 | 1 | $956 |
| #8 | 2 | 1 | $956 |
| #9 | 2 | 1 | $956 |
| #10 | 2 | 1 | $956 |
| #11 | 2 | 1 | $956 |
| #12 | 2 | 1 | $956 |
| #13 | 2 | 1 | $956 |
| #14 | 2 | 1 | $956 |
| #15 | 2 | 1 | $956 |
| #16 | 2 | 1 | $956 |
| #17 | 2 | 1 | $956 |
| #18 | 2 | 1 | $956 |
| #19 | 2 | 1 | $956 |
| #20 | 2 | 1 | $956 |
| #21 | 2 | 1 | $956 |
| #22 | 2 | 1 | $956 |
| #23 | 2 | 1 | $956 |
| #24 | 2 | 1 | $956 |
| #25 | 2 | 1 | $956 |
| #26 | 2 | 1 | $956 |
| #27 | 2 | 1 | $956 |
| #28 | 2 | 1 | $956 |
| #29 | 2 | 1 | $956 |
| #30 | 2 | 1 | $956 |
| #31 | 2 | 1 | $956 |
| #32 | 2 | 1 | $956 |
| #33 | 2 | 1 | $956 |
| #34 | 2 | 1 | $956 |
| #35 | 2 | 1 | $956 |
| #36 | 2 | 1 | $956 |
| #37 | 2 | 1 | $956 |
| #38 | 2 | 1 | $956 |
| #39 | 2 | 1 | $956 |
| #40 | 2 | 1 | $956 |
| #41 | 2 | 1 | $956 |
| #42 | 2 | 1 | $956 |
| #43 | 2 | 1 | $956 |
| #44 | 2 | 1 | $956 |
| Total (44 units) | $42,084 | ||
UW: 25.0% down · 7.5% · 30yr · 1.5% tax · 5.0% vac · 8.0% maint · 8.0% mgmt
Financing live
Cash to close
- Down payment
- $750,000
- Closing costs
- $90,000
- Reserves months
- —
- Total cash needed
- —
Loan-product check · same deal, 3 products live
Conventional
25% down · 7.5% · 30yr
- Down + closing
- —
- Monthly P&I
- —
- Monthly cashflow
- —
- DSCR
- —
- Eligible?
- —
Personal DTI + credit; lowest rate.
DSCR
20% down · 8.5% · 30yr
- Down + closing
- —
- Monthly P&I
- —
- Monthly cashflow
- —
- DSCR
- —
- Eligible?
- —
No personal income docs; deal must DSCR.
Hard money
10% down · 12.0% · 12mo
- Down + closing
- —
- Monthly P&I
- —
- Monthly cashflow
- —
- DSCR
- —
- Eligible?
- —
Short-term bridge; refi at stabilization.
Listing history 21 events
-
2026-06-19days on market $3,000,000 Active 73 DOM
-
2026-06-18days on market $3,000,000 Active 72 DOM
-
2026-06-17days on market $3,000,000 Active 71 DOM
-
2026-06-16days on market $3,000,000 Active 70 DOM
-
2026-06-15days on market $3,000,000 Active 69 DOM
-
2026-06-14days on market $3,000,000 Active 67 DOM
-
2026-06-13days on market $3,000,000 Active 66 DOM
-
2026-06-10days on market $3,000,000 Active 64 DOM
-
2026-06-09days on market $3,000,000 Active 63 DOM
-
2026-06-08days on market $3,000,000 Active 62 DOM
-
2026-06-07days on market $3,000,000 Active 61 DOM
-
2026-06-05days on market $3,000,000 Active 58 DOM
-
2026-06-03days on market $3,000,000 Active 57 DOM
-
2026-06-02days on market $3,000,000 Active 56 DOM
-
2026-06-01days on market $3,000,000 Active 55 DOM
-
2026-05-31days on market $3,000,000 Active 54 DOM
-
2026-05-30days on market $3,000,000 Active 53 DOM
-
2026-04-07$3,000,000 Active 865-char remark
Show marketing remark (865 chars)
Great investment opportunity featuring a 44-unit apartment community comprised of 2BD/1BA units (~900 SF) across 10 buildings. Property maintains strong occupancy (~95%) with recent leases achieving $875–$895 per unit, plus a $50/month utility reimbursement for water, sewer, and trash. Tenants pay electric, providing low owner utility exposure. Current ownership has implemented a proven rent growth strategy, with continued opportunity to standardize remaining units and increase income. The property generates approximately $278,000+ in net operating income, offering an attractive ~9% cap rate at the current list price. Recent improvements include HVAC upgrades, unit renovations, and a new lift station (2020), reducing near-term capital expenditure needs. Additional updates throughout include flooring, paint, appliances, and mechanical improvements.
-
2021-04-10soldstatus $2,195,000 283-char remark
Show marketing remark (283 chars)
Great Investment Opportunity! 10 building- 44 units. 2BD/1BA with Washer/Dryer hook ups. Property has had many updates including a new lift station (2020), various units that have new paint, flooring, appliances, hvac, hot water heaters, and more! Financials available upon request.
-
2020-12-31$2,295,000 283-char remark
Show marketing remark (283 chars)
Great Investment Opportunity! 10 building- 44 units. 2BD/1BA with Washer/Dryer hook ups. Property has had many updates including a new lift station (2020), various units that have new paint, flooring, appliances, hvac, hot water heaters, and more! Financials available upon request.
-
2016-06-16soldstatus $1,400,000
ⓘ Source: listings_history table (triggers on properties + properties_extension) + one-shot
backfill from property_details.listing_events for pre-trigger history.
Tax reassessment forecast IN · Partial reset (capped growth)
- Current annual tax
- $10,670 · $889/mo
- Projected year-2 tax
- $18,085 · $1,507/mo
- Expected delta
- +$7,415/yr (+$618/mo · 69.5%)
ⓘ Screening estimate from a state-policy table — verify with the county assessor before closing.
Climate risk First Street
- Flood 1/10 Low FEMA zone X (unshaded) · 0% chance over 30 yrs
- Wildfire 3/10 Moderate
- Heat 4/10 Moderate 7 d/yr ≥104°F today · 18 d/yr by 30 yrs out
- Wind 2/10 Low 100% chance of damaging wind over 30 yrs
- Air quality 2/10 Low 0 unhealthy d/yr today · 1 by 30 yrs out
Nearby sold comps map
Loading sold comps map…
Walkable amenities ~0.75 mi
Loading nearby amenities…
Taxation est. · year 1
- Rental income
- $505,008
- − Mortgage interest
- −$168,047
- − Property taxes
- −$10,670
- − Insurance
- −$15,000
- − Repairs & maintenance
- −$40,401
- − Management
- −$40,401
- − Depreciation
- −$87,273
- Taxable income
- $143,217
- Est. tax owed @ 24.0%
- −$34,372
- After-tax cash flow
- $150,126/yr
For passive investors: Depreciation is non-cash, so a rental often shows a tax loss while cash-flowing — sheltering income. Rental losses are passive: they offset passive income freely, and up to $25,000/yr can offset ordinary (W-2) income if you actively participate and your MAGI is under $100k (phasing out to $0 by $150k); unused losses carry forward. On sale, claimed depreciation is recaptured at up to 25%, and gains may owe capital-gains tax (a 1031 exchange can defer both). Figures are a year-1 estimate at your 24.0% rate — not tax advice; consult a CPA.
Schools (NCES district)
- District
- North Lawrence Community Schools
- NCES district ID
- 1807860
- Math proficiency
- 35% ▼ -2.00%
- Reading proficiency
- 40% ▼ -3.00%
- Median HH income
- $44,566
- Composite
- 31.88/100
- National rank
- #5864
- State rank
- #170 of 301 in IN
Livability — Bedford
- Score
- 80/100
- State rank
- #23
- US rank
- #1958
Category grades
Schools grade is shown separately in the Schools card above.
Census & demographics
- Census place
- Bedford, IN
- County
- Lawrence County · 27,599 people
- City population
- 27,599
- Metro
- Bedford, IN
- Population (ZIP)
- 27,599
- Household income
- $68,108
- Rent vs Own
- Severe rent burden
- 507.0
Population outlook (Lawrence County) Hauer SSP2
- Today (2025)
- 44,347 people
- By 2030
- 43,331 · -2.3%
- By 2040
- 40,887 · -7.8%
- By 2050
- 38,297 · -13.6%
- By 2075
- 32,479 · -26.8%
- By 2100
- 26,051 · -41.3%
Race, ethnicity, and origin ACS 2023
- Neighborhood character
- Predominantly White (94%)
- Race & ethnicity
- White 94% Two or more races 4% Hispanic / Latino 2%
- Common ancestry
- Slovak 3% Italian 2% Scotch-Irish 1%
- Foreign-born
- 1% · Canada
- Languages at home
- 99% English-only · Spanish 1%
Political lean MEDSL · Lawrence
- 2024 margin
- Solid R (+51.0) · D 23.6% · R 74.6% · Other 1.7%
- 2008→2024 swing
- -30.5pp toward R · 2008: -20.6pp · 2024: -51.0pp
- All cycles
- 2024: R+51.0 2020: R+50.6 2016: R+51.5 2012: R+32.8 2008: R+20.6
Not yet ingested
- Civics
- —
Market trends
- HPI YoY
- ▼ -81.32%
- Current HPI
- 240.959
- Rent YoY
- —
- Metro
- Bedford, IN
- State GDP YoY
- ▲ 2.90%
- F500 in state
- 18
Industry mix (Fortune 500 HQ in IN)
| Industry | F500 HQs | Revenue |
|---|---|---|
| Industrial Machinery | 2 | $37B |
|
||
| Healthcare | 1 | $177B |
|
||
| Pharmaceuticals | 1 | $45B |
|
||
| Metals / Steel | 1 | $18B |
|
||
| Agriculture | 1 | $17B |
|
||
| Packaging | 1 | $12B |
|
||
Price history
+114.3% since first listed4 events — show timeline
- 2026-04-07 Listed $3,000,000 IRMLS
- 2021-04-10 Sold (MLS) $2,195,000 IRMLS
- 2020-12-31 Listed $2,295,000 IRMLS
- 2016-06-16 Sold (Public Records) $1,400,000 Public Records
Property tax history
-2.5%/yrLatest (2025): $10,670 · +19.3% YoY. Source: county tax records.
Cash-flow waterfall
monthlySold comps — $/sqft
last 12 mo · ≤1 miLoading sold comps…