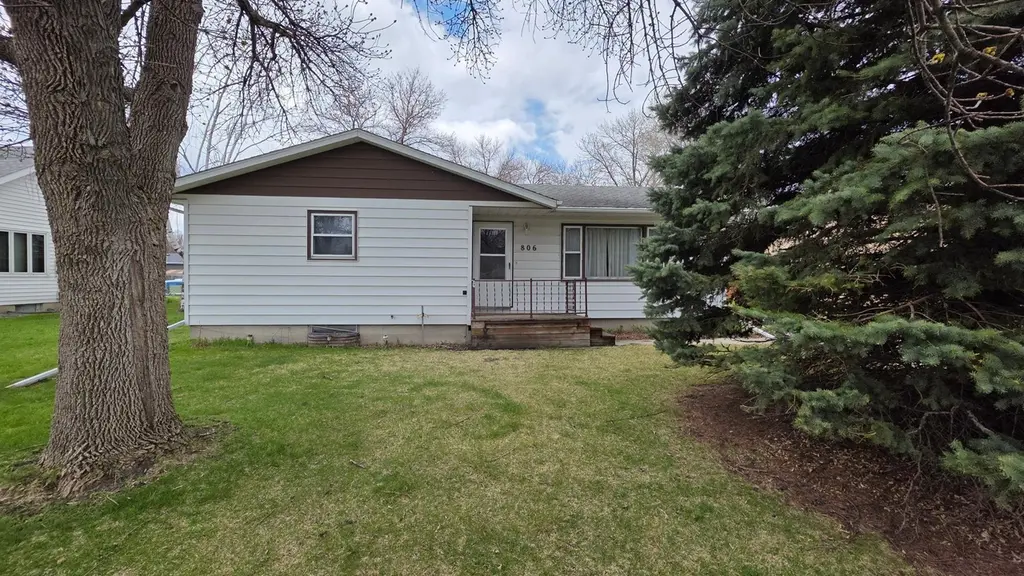
806 N 29 St N · Fargo, ND
Flood risk 1/10 · Minimal
- FEMA flood zone
- X (shaded)
- Chance of flooding over 30 yrs
- 0.0%
- Est. flood insurance / yr
- $473 – $860
Fire risk 1/10 · Minimal
- Est. fire insurance / yr
- $1,289 – $2,393
Heat risk 2/10 · Minimal
- Hot days now (above 98°F)
- 7 days/yr
- Hot days in 30 yrs
- 12 days/yr
Wind risk 2/10 · Minimal
- Chance of severe wind over 30 yrs
- —
Air-quality risk 3/10 · Minor
- Unhealthy air days now
- 3 days/yr
- Unhealthy air days in 30 yrs
- 3 days/yr
Risk factors via First Street. Map © Google.
Why this score? — see what drove the F grade
The composite is a weighted blend of 9 inputs, each scored 0–100. Each bar is that input's sub-score; the figure is the points it added to the 100-point composite (weight × sub-score).
- Cash flow +7.8/30.0
- ARV discount +7.5/15.0
- Livability +4.2/5.0
- Rent growth +3.7/5.0
- Schools +3.6/10.0
- Condition / age +2.5/5.0
- 1% rule +1.9/10.0
- DSCR +1.9/10.0
- Appreciation +0.0/10.0
$180,000
🖨 Deal sheet 📄 Offer letter ✓ Due diligence
Key facts
- 7,750 sq ft lot
- 2 garage spots
- Built 1975
Property features AI
Exterior
- Parking: 2-car garage
- Utilities: City water connected; City sewer connected; Electric fuel
- Home design: Residential one-level home; Entry/main level living; Block foundation
- Construction: Block foundation
- Exterior features: Lot approximately 7,750 sq ft (66' x 118')
Interior
- Kitchen: Main-level kitchen
- Bedrooms: 3 bedrooms on the main level
- Bathrooms: 1 full bathroom on the main level
- Heating & cooling: Forced air heating; Central air conditioning
- Interior features: Basement with drain tile and sump pump
Neighborhood map
What this means for you Summary
Snapshot
- This is a 3-bed/1.0-bath single-family listed at $180k.
Deal economics
- At list price, monthly cash flow is $-197 ($-2k/yr) — negative.
- To cash-flow at today's rent, offer at most $145k (19.3% below list).
- To meet the 1% rule (rent ≥ 1% of price), the offer needs to be $123k (31.4% below list).
- Recommended offer: $123k (31.4% below list) — sets the bar for 1% rule.
- Cap rate 5.0% vs local median 2.5% in Fargo — top-decile yield for the area; either an underpriced asset or a hidden risk that comps aren't pricing in. Stress-test before assuming the spread holds.
Location & tenants
- Location reads 85/100 on livability (#1 in ND, #605 nationally) — a professional / high-income tenant draw. Strengths: amenities A+, commute A+, cost of living A+; Watch: crime F.
- Fargo 1 (urban): math 41% / reading 44% proficiency, ranked #28 of 53 in ND (top 53%) — families likely to look elsewhere, expect single-tenant / working-renter base with shorter leases.
- Market conditions: Rents rising fast (+4.7%/yr); 205 active listings in the ZIP; 20 comparable units currently listed for rent nearby; rentals leasing fast (median 13d on market — plan ~1-2 weeks tenant-placement turnaround); 1,218 units permitted in Cass County in 2024 (410 in 5+ unit buildings).
Forward outlook
- Local home prices are declining (-3.0%/yr); year-one equity from $1k of loan paydown is wiped out by about $5k of value loss. Plan a longer hold.
- Cass County population projected at +69% by 2050 — long-run rental-demand tailwind backs the buy-and-hold thesis.
Negotiation context
- It's been on market 24 days — a 2% lower offer ($177k) is reasonable based on typical stale-listing flexibility.
- Current owner paid $135k; 33% above their basis — modest negotiation headroom, anchor on the comps not their cost.
Questions for the listing agent
- What do current leases actually rent for vs. the listed asking? Can we see a recent rent roll and the last 12 months of T-12 income?
- Built in 1975 — when were the roof, HVAC, electrical panel, plumbing, and water heater last replaced?
- Is there a deadline driving the sale (1031 exchange, divorce, estate, relocation)? That informs how much negotiation room exists.
- Crime grade is F in this area — have there been break-ins, vandalism, or insurance claims at this property in the last 3 years? What carrier currently insures it and at what premium?
- The area grade is low — what's the realistic commute time and amenity access for the typical tenant pool here? Any planned neighborhood developments (good or bad) we should know about?
- What's the average days-on-market for RENTAL listings here right now (not sales)? A rising rental-DOM trend means longer vacancies and softer asking-rent achievability than the comps imply.
- What's the recent tenant-quality profile in this submarket — average credit score on applications, eviction rate, late-payment / NSF rate, and stable-employment percentage? A property-management company in the area should have these aggregated.
- How much new for-sale + rental construction is in the pipeline within 1–3 miles? Heavy new supply typically softens prices + rents 12–24 months out; constrained supply supports both.
Investment metrics
- 1% rule
- 0.69% ✗
- Cap rate
- 4.98%
- Cash-on-cash
- -4.69%
- DSCR
- 0.79
- GRM
- 12.2
CMA / ARV
No comps found within radius.
Projected returns pro-forma
-3.0% appreciation · 4.71% rent growth · sell at horizon
- IRR
- -22.5%
- Equity multiple
- 0.21×
- Total profit
- $-39,570
- Equity at exit
- $26,839
- IRR
- -13.2%
- Equity multiple
- 0.18×
- Total profit
- $-41,527
- Equity at exit
- $15,563
Cash invested: $50,400 (down + closing). Projections, not guarantees.
Landlord ↔ Tenant lean methodology
- Overall (STATE)
- 82 Strongly Landlord-Friendly
- State North Dakota
- 82 Strongly Landlord-Friendly · R+20
- County
- — inherits STATE
- City
- — inherits STATE
ZIP-level market 58102
- Rents YoY
- 4.7%
- Active inventory
- 205
- Price-to-rent
- 12.2×
Monthly cashflow live
- Estimated rent
- $1,234 high interval (Pro) →
- Mortgage (P&I)
- −$944
- Tax from tax record
- −$153 /mo · $1,835/yr
- Insurance
- −$75
- HOA
- −$0
- Vacancy / Maint / Mgmt
- −$259
- Net cashflow
- $-197
Break-even live
UW: 25.0% down · 7.5% · 30yr · 1.5% tax · 5.0% vac · 8.0% maint · 8.0% mgmt
Financing live
Cash to close
- Down payment
- $45,000
- Closing costs
- $5,400
- Reserves months
- —
- Total cash needed
- —
Loan-product check · same deal, 3 products live
Conventional
25% down · 7.5% · 30yr
- Down + closing
- —
- Monthly P&I
- —
- Monthly cashflow
- —
- DSCR
- —
- Eligible?
- —
Personal DTI + credit; lowest rate.
DSCR
20% down · 8.5% · 30yr
- Down + closing
- —
- Monthly P&I
- —
- Monthly cashflow
- —
- DSCR
- —
- Eligible?
- —
No personal income docs; deal must DSCR.
Hard money
10% down · 12.0% · 12mo
- Down + closing
- —
- Monthly P&I
- —
- Monthly cashflow
- —
- DSCR
- —
- Eligible?
- —
Short-term bridge; refi at stabilization.
Rent comps 20 comps
| Address | Beds | Baths | Sqft | Rent | $/sqft | DOM | Units | Dist |
|---|---|---|---|---|---|---|---|---|
| 1920 Dakota Dr N Fargo, ND | 2.0–3.0 | 1.0–2.0 | 842 | $1,730 | $2.05 | 13d | 6 | 0.70mi |
| 1951 Dakota Dr N Fargo, ND | 2.0–3.0 | 2.0 | 1051 | $1,395 | $1.33 | 13d | 5 | 0.74mi |
| 1900 Dakota Dr N Fargo, ND | 3.0–4.0 | 2.0–3.0 | 1324 | $1,425 | $1.08 | 13d | 7 | 0.74mi |
| 1142 17th St N Fargo, ND | 2.0 | 2.0 | 1009 | $1,320 | $1.31 | 20d | 1 | 0.92mi |
| 904 16th St N Unit 12 Fargo, ND | 2.0 | 1.0 | 700 | $760 | $1.09 | 13d | 1 | 0.93mi |
| 1010 16th St N Unit 1010-15 Fargo, ND | 2.0 | 1.0 | 711 | $775 | $1.09 | 20d | 1 | 0.93mi |
| 1125 17th St N Unit 1125-2 Fargo, ND | 2.0 | 1.0 | 1345 | $850 | $0.63 | 20d | 1 | 0.94mi |
| 902 15th St N Unit 4/5 Fargo, ND | 3.0 | 2.0 | 1200 | $995 | $0.83 | 20d | 1 | 1.00mi |
| 1510 11th Ave N Unit 2 Fargo, ND | 2.0 | 1.0 | 900 | $775 | $0.86 | 13d | 1 | 1.01mi |
| 1515 11th Ave N Fargo, ND | 4.0 | 1.0–4.0 | 862 | $2,136 | $2.48 | 13d | 18 | 1.03mi |
| 899 Barrett St Apt 104 Fargo, ND | 2.0 | 2.0 | 1311 | $1,425 | $1.09 | 13d | 1 | 1.15mi |
| 1820 Dakota Dr Fargo, ND | 4.0 | 1.0–3.0 | 972 | $1,595 | $1.64 | 13d | 8 | 1.26mi |
| 1321 5th Ave N Fargo, ND | 2.0 | 1.0 | 880 | $998 | $1.13 | 13d | 3 | 1.31mi |
| 909 12th St N Unit 2 Fargo, ND | 2.0 | 1.0 | 762 | $1,000 | $1.31 | 20d | 1 | 1.39mi |
| 929 Page Dr Unit 302 Fargo, ND | 3.0 | 1.0 | 1000 | $960 | $0.96 | 20d | 1 | 1.40mi |
| 929 Page Dr Apt 203 Fargo, ND | 2.0 | 1.0 | 868 | $815 | $0.94 | 20d | 1 | 1.40mi |
| 1005 12th St N Fargo, ND | 2.0 | 2.0 | 1224 | $1,645 | $1.34 | 20d | 1 | 1.41mi |
| 1015 Page Dr Apt 301 Fargo, ND | 2.0 | 1.0 | 850 | $745 | $0.88 | 20d | 1 | 1.43mi |
| 312 11th St N Fargo, ND | 2.0 | 1.0–2.0 | 874 | $1,575 | $1.80 | 13d | 17 | 1.47mi |
| 1102 22nd St S Fargo, ND | 1.0–2.0 | 1.0 | 800 | $815 | $1.02 | 13d | 9 | 1.49mi |
Listing history 8 events
-
2026-06-07statusdays on market $180,000 Pending 24 DOM
-
2026-06-02days on market $180,000 Active 21 DOM
-
2026-06-01days on market $180,000 Active 20 DOM
-
2026-05-31days on market $180,000 Active 19 DOM
-
2026-05-30days on market $180,000 Active 18 DOM
-
2026-05-21price $180,000
-
2026-05-12$190,000 Active
-
2026-05-04soldstatus $135,000
ⓘ Source: listings_history table (triggers on properties + properties_extension) + one-shot
backfill from property_details.listing_events for pre-trigger history.
Tax reassessment forecast ND · Resets to sale price
- Current annual tax
- $1,835 · $153/mo
- Projected year-2 tax
- $1,835 · $153/mo
- Expected delta
- $0/yr ($0/mo · 0.0%)
ⓘ Screening estimate from a state-policy table — verify with the county assessor before closing.
Climate risk First Street
- Flood 1/10 Low FEMA zone X (shaded) · 0% chance over 30 yrs
- Wildfire 1/10 Low
- Heat 2/10 Low 7 d/yr ≥98°F today · 12 d/yr by 30 yrs out
- Wind 2/10 Low
- Air quality 3/10 Moderate 3 unhealthy d/yr today · 3 by 30 yrs out
Nearby sold comps map
Loading sold comps map…
Walkable amenities ~0.75 mi
Loading nearby amenities…
Taxation est. · year 1
- Rental income
- $14,810
- − Mortgage interest
- −$10,083
- − Property taxes
- −$1,835
- − Insurance
- −$900
- − Repairs & maintenance
- −$1,185
- − Management
- −$1,185
- − Depreciation
- −$5,236
- Taxable loss
- −$5,613
- Est. tax savings @ 24.0%
- +$1,347
- After-tax cash flow
- $-1,015/yr
For passive investors: Depreciation is non-cash, so a rental often shows a tax loss while cash-flowing — sheltering income. Rental losses are passive: they offset passive income freely, and up to $25,000/yr can offset ordinary (W-2) income if you actively participate and your MAGI is under $100k (phasing out to $0 by $150k); unused losses carry forward. On sale, claimed depreciation is recaptured at up to 25%, and gains may owe capital-gains tax (a 1031 exchange can defer both). Figures are a year-1 estimate at your 24.0% rate — not tax advice; consult a CPA.
Schools (NCES district)
- District
- Fargo 1
- NCES district ID
- 3806780
- Math proficiency
- 41% ▼ -7.00%
- Reading proficiency
- 44% ▼ -7.00%
- Median HH income
- $46,524
- Composite
- 36.23/100
- National rank
- #4721
- State rank
- #28 of 53 in ND
Livability — Fargo
- Score
- 85/100
- State rank
- #1
- US rank
- #605
Category grades
Schools grade is shown separately in the Schools card above.
Census & demographics
- Census place
- Fargo, ND
- County
- Cass County · 177,143 people
- City population
- 130,876
- Metro
- Fargo, ND-MN
- Population (ZIP)
- 32,912
- Household income
- $59,533
- Rent vs Own
- Severe rent burden
- 1919.0
Population outlook (Cass County) Hauer SSP2
- Today (2025)
- 223,771 people
- By 2030
- 251,835 · +12.5%
- By 2040
- 311,816 · +39.3%
- By 2050
- 378,694 · +69.2%
- By 2075
- 571,386 · +155.3%
- By 2100
- 769,727 · +244.0%
Race, ethnicity, and origin ACS 2023
- Neighborhood character
- Predominantly White (84%)
- Race & ethnicity
- White 84% Hispanic / Latino 5% Two or more races 5% Black 4% Asian 3%
- Hispanic origin (detail)
- Mexican 2% Puerto Rican 2%
- Common ancestry
- Portuguese 27% Romanian 3% Scottish 2%
- Foreign-born
- 4% · Canada, China
- Languages at home
- 92% English-only · Spanish 3% Other Indo-European 2%
Political lean MEDSL · Cass
- 2024 margin
- Lean R (+8.4) · D 44.9% · R 53.3% · Other 1.9%
- 2008→2024 swing
- -15.5pp toward R · 2008: 7.1pp · 2024: -8.4pp
- All cycles
- 2024: R+8.4 2020: R+2.7 2016: R+10.7 2012: R+3.0 2008: D+7.1
Not yet ingested
- Civics
- —
Market trends
- HPI YoY
- ▼ -171.16%
- Current HPI
- 155.885
- Rent YoY
- ▲ 4.71%
- Metro
- Fargo, ND-MN
- State GDP YoY
- ▲ 2.09%
- F500 in state
- 2
Industry mix (Fortune 500 HQ in ND)
| Industry | F500 HQs | Revenue |
|---|---|---|
| Utilities / Construction | 1 | $6B |
|
||
Price history
+33.3% since first listed3 events — show timeline
- 2026-05-21 Price Changed $180,000 NORTHSTARMLS as Distributed by MLS Grid
- 2026-05-12 Listed $190,000 NORTHSTARMLS as Distributed by MLS Grid
- 2026-05-04 Sold (Public Records) $135,000 Public Records
Property tax history
+0.0%/yrLatest (2025): $1,835 · -33.9% YoY. Source: county tax records.
Cash-flow waterfall
monthlySold comps — $/sqft
last 12 mo · ≤1 miLoading sold comps…