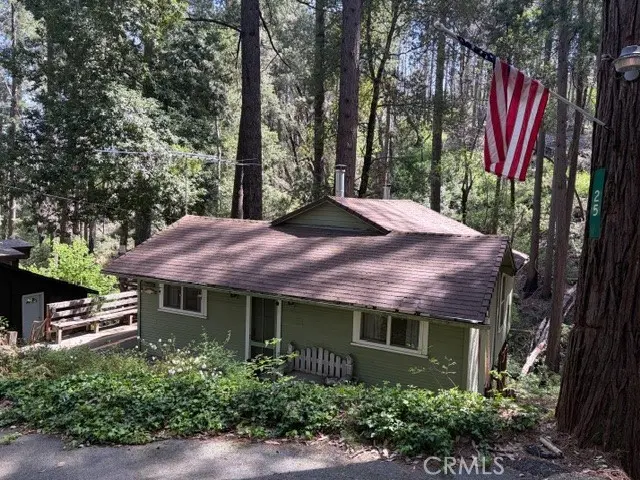
25 Toyon Trl · Berry Creek, CA
Flood risk 1/10 · Minimal
- FEMA flood zone
- X (unshaded)
- Chance of flooding over 30 yrs
- 0.0%
- Est. flood insurance / yr
- $507 – $1,088
Fire risk 4/10 · Minor
- Est. fire insurance / yr
- $659 – $1,223
Heat risk 5/10 · Moderate
- Hot days now (above 98°F)
- 7 days/yr
- Hot days in 30 yrs
- 15 days/yr
Wind risk 1/10 · Minimal
- Chance of severe wind over 30 yrs
- —
Air-quality risk 10/10 · Severe
- Unhealthy air days now
- 43 days/yr
- Unhealthy air days in 30 yrs
- 45 days/yr
Risk factors via First Street. Map © Google.
Why this score? — see what drove the D grade
The composite is a weighted blend of 9 inputs, each scored 0–100. Each bar is that input's sub-score; the figure is the points it added to the 100-point composite (weight × sub-score).
- Cash flow +12.6/30.0
- ARV discount +7.5/15.0
- Appreciation +4.7/10.0
- 1% rule +3.7/10.0
- DSCR +3.7/10.0
- Schools +2.8/10.0
- Rent growth +2.5/5.0
- Livability +2.5/5.0
- Condition / age +2.5/5.0
$98,500
🖨 Deal sheet 📄 Offer letter ✓ Due diligence
Listing remarks
Lake Madrone is where you can still find the quintessential "Cabin in the Woods" and a bargain price. The time is now to create those unforgettable memories with the family that will last a lifetime. Swimming beach, boating, fishing, horseshoes, picnic table, firepit and More! Short 30-minute drive around Lake Oroville up to the cooler summer lake.
Key facts
- 6,098 sq ft lot
- Built 1930
- Listed 38 days
Property features AI
Finance
- Other: Zoning: TM1; Directions: Hwy 162 to first Lake Madrone gate; Toyon Trail is first road on the right
- Financial info: Subject to special assessments
- HOA & community: Part of Lake Madrone Ass (annual fee $250); Secondary association Madrone Water (annual fee $300); Tertiary fee $35 annually; Association amenities include fire pit, outdoor cooking area, and picnic area; Community offers watersports, biking, hiking, fishing; mountainous and lake setting
Exterior
- Parking: Private road access (maintained)
- Security: Gated community with card/code access and automatic gate
- Utilities: Water: private/other (see remarks); Septic tank; Electricity connected; Telephone available in street
- Home design: Single-story cabin; Entry at front; One total unit; Fixer condition
- Construction: Wood construction; Composition roof; Pillar/post/pier foundation; Utility basement; Year built from public records
- Exterior features: Cabin structure; Wood deck and wood patio; No pool; No fencing; Lot is steeply sloped and rectangular; Lake rights
Interior
- Kitchen: Electric range; Microwave; Refrigerator; 220V outlet in kitchen; Eating area in kitchen
- Bedrooms: One main-floor bedroom
- Flooring: Wood flooring
- Bathrooms: One full bathroom with shower
- Heating & cooling: Wood stove heating; Has heating
- Interior features: Unfinished walls; Wood frame windows; Front entry; One-level layout; Has view; Card/code access with automatic gated community
- Laundry & utility: No laundry hookups listed; Utility basement
Neighborhood map
What this means for you Summary
Snapshot
- This is a 1-bed/1.0-bath single-family listed at $98k.
Deal economics
- At list price, monthly cash flow is $-13 ($-161/yr) — negative.
- To cash-flow at today's rent, offer at most $96k (2.4% below list).
- To meet the 1% rule (rent ≥ 1% of price), the offer needs to be $86k (12.7% below list).
- Recommended offer: $86k (12.7% below list) — sets the bar for 1% rule.
Location & tenants
- Location reads 50/100 on livability (#1,117 in CA) — a working-class tenant base; expect higher turnover. Strengths: crime B+; Watch: schools F, amenities F, commute F.
- Oroville Union High (town): math 19% / reading 49% proficiency, ranked #300 of 517 in CA (top 58%) — families likely to look elsewhere, expect single-tenant / working-renter base with shorter leases.
- Market conditions: 91 active listings in the ZIP; 946 units permitted in Butte County in 2024 (254 in 5+ unit buildings).
Forward outlook
- In year one you build about $32 of equity ($681 loan paydown + $-649 appreciation (-0.7% local appreciation)).
- Butte County population projected at +10% by 2050 — modest demand growth; plan on rents tracking national, not racing it.
Negotiation context
- It's been on market 39 days — a 3% lower offer ($96k) is reasonable based on typical stale-listing flexibility.
- 2 sale attempts with the ask held roughly flat each time — persistent listings suggest the price (not the market) is what's stuck; bring a comps-based counter.
Risks & watch-outs
- Watch-outs: built in 1930 — expect roof / HVAC / electrical / plumbing capex.
- Climate carrying-cost: extreme-heat days projected 7→15/yr by 2055 (HVAC capex compounding) — expect insurance premiums to compound above CPI over the hold.
Questions for the listing agent
- What do current leases actually rent for vs. the listed asking? Can we see a recent rent roll and the last 12 months of T-12 income?
- It's been on market 39 days. Have you received any prior offers? Is the seller open to a 13% concession, seller financing, or rate buy-down credit?
- Built in 1930 — when were the roof, HVAC, electrical panel, plumbing, and water heater last replaced?
- What does the HOA fee cover, when was the last increase, and are there any pending special assessments or reserve-fund shortfalls?
- Is there a deadline driving the sale (1031 exchange, divorce, estate, relocation)? That informs how much negotiation room exists.
- Schools are F-rated, which usually means shorter tenancies and higher turnover. Who's the typical renter profile here, and what's been the actual vacancy rate?
- The area grade is low — what's the realistic commute time and amenity access for the typical tenant pool here? Any planned neighborhood developments (good or bad) we should know about?
- What's the average days-on-market for RENTAL listings here right now (not sales)? A rising rental-DOM trend means longer vacancies and softer asking-rent achievability than the comps imply.
- What's the recent tenant-quality profile in this submarket — average credit score on applications, eviction rate, late-payment / NSF rate, and stable-employment percentage? A property-management company in the area should have these aggregated.
- How much new for-sale + rental construction is in the pipeline within 1–3 miles? Heavy new supply typically softens prices + rents 12–24 months out; constrained supply supports both.
Investment metrics
- 1% rule
- 0.87% ✗
- Cap rate
- 6.13%
- Cash-on-cash
- -0.58%
- DSCR
- 0.97
- GRM
- 9.5
CMA / ARV
No comps found within radius.
Projected returns pro-forma
-0.66% appreciation · 3.0% rent growth · sell at horizon
- IRR
- -5.5%
- Equity multiple
- 0.76×
- Total profit
- $-6,724
- Equity at exit
- $25,399
- IRR
- 1.0%
- Equity multiple
- 1.10×
- Total profit
- $2,751
- Equity at exit
- $28,080
Cash invested: $27,580 (down + closing). Projections, not guarantees.
Landlord ↔ Tenant lean methodology
- Overall (STATE)
- 18 Strongly Tenant-Friendly
- State California
- 18 Strongly Tenant-Friendly · D+13
- County
- — inherits STATE
- City
- — inherits STATE
ZIP-level market 95916
- Home prices YoY
- -0.5%
- Active inventory
- 91
- Price-to-rent
- 9.5×
Monthly cashflow live
- Estimated rent
- $860 medium interval (Pro) →
- Mortgage (P&I)
- −$517
- Tax from tax record
- −$86 /mo · $1,033/yr
- Insurance
- −$41
- HOA
- −$49
- Vacancy / Maint / Mgmt
- −$181
- Net cashflow
- $-13
Break-even live
UW: 25.0% down · 7.5% · 30yr · 1.5% tax · 5.0% vac · 8.0% maint · 8.0% mgmt
Financing live
Cash to close
- Down payment
- $24,625
- Closing costs
- $2,955
- Reserves months
- —
- Total cash needed
- —
Loan-product check · same deal, 3 products live
Conventional
25% down · 7.5% · 30yr
- Down + closing
- —
- Monthly P&I
- —
- Monthly cashflow
- —
- DSCR
- —
- Eligible?
- —
Personal DTI + credit; lowest rate.
DSCR
20% down · 8.5% · 30yr
- Down + closing
- —
- Monthly P&I
- —
- Monthly cashflow
- —
- DSCR
- —
- Eligible?
- —
No personal income docs; deal must DSCR.
Hard money
10% down · 12.0% · 12mo
- Down + closing
- —
- Monthly P&I
- —
- Monthly cashflow
- —
- DSCR
- —
- Eligible?
- —
Short-term bridge; refi at stabilization.
HOA detail
- Monthly dues
- $49 · $588/yr
Listing history 20 events
-
2026-06-19days on market $98,500 Active 39 DOM
-
2026-06-18days on market $98,500 Active 38 DOM
-
2026-06-17days on market $98,500 Active 37 DOM
-
2026-06-16days on market $98,500 Active 36 DOM
-
2026-06-15days on market $98,500 Active 35 DOM
-
2026-06-14days on market $98,500 Active 33 DOM
-
2026-06-13days on market $98,500 Active 32 DOM
-
2026-06-10days on market $98,500 Active 30 DOM
-
2026-06-09days on market $98,500 Active 29 DOM
-
2026-06-08days on market $98,500 Active 28 DOM
-
2026-06-07days on market $98,500 Active 27 DOM
-
2026-06-05days on market $98,500 Active 24 DOM
-
2026-06-03days on market $98,500 Active 23 DOM
-
2026-06-02days on market $98,500 Active 22 DOM
-
2026-06-01days on market $98,500 Active 21 DOM
-
2026-05-31days on market $98,500 Active 20 DOM
-
2026-05-30days on market $98,500 Active 19 DOM
-
2026-05-15status Active
-
2026-05-01status Pending Sale
-
2026-04-27$98,500 Active
ⓘ Source: listings_history table (triggers on properties + properties_extension) + one-shot
backfill from property_details.listing_events for pre-trigger history.
Tax reassessment forecast CA · Resets to sale price
- Current annual tax
- $1,033 · $86/mo
- Projected year-2 tax
- $1,033 · $86/mo
- Expected delta
- $0/yr ($0/mo · 0.0%)
ⓘ Screening estimate from a state-policy table — verify with the county assessor before closing.
Climate risk First Street
- Flood 1/10 Low FEMA zone X (unshaded) · 0% chance over 30 yrs
- Wildfire 4/10 Moderate
- Heat 5/10 Major 7 d/yr ≥98°F today · 15 d/yr by 30 yrs out
- Wind 1/10 Low
- Air quality 10/10 Extreme 43 unhealthy d/yr today · 45 by 30 yrs out
Nearby sold comps map
Loading sold comps map…
Walkable amenities ~0.75 mi
Loading nearby amenities…
Taxation est. · year 1
- Rental income
- $10,318
- − Mortgage interest
- −$5,518
- − Property taxes
- −$1,033
- − Insurance
- −$492
- − Repairs & maintenance
- −$825
- − Management
- −$825
- − HOA
- −$588
- − Depreciation
- −$2,865
- Taxable loss
- −$1,829
- Est. tax savings @ 24.0%
- +$439
- After-tax cash flow
- $278/yr
For passive investors: Depreciation is non-cash, so a rental often shows a tax loss while cash-flowing — sheltering income. Rental losses are passive: they offset passive income freely, and up to $25,000/yr can offset ordinary (W-2) income if you actively participate and your MAGI is under $100k (phasing out to $0 by $150k); unused losses carry forward. On sale, claimed depreciation is recaptured at up to 25%, and gains may owe capital-gains tax (a 1031 exchange can defer both). Figures are a year-1 estimate at your 24.0% rate — not tax advice; consult a CPA.
Schools (NCES district)
- District
- Oroville Union High
- NCES district ID
- 0629130
- Math proficiency
- 19% ▼ -2.00%
- Reading proficiency
- 49% ▼ -4.00%
- Median HH income
- $38,085
- Composite
- 28.26/100
- National rank
- #6794
- State rank
- #300 of 517 in CA
Livability — Berry Creek
- Score
- 50/100
- State rank
- #1117
- US rank
- #25616
Category grades
Schools grade is shown separately in the Schools card above.
Census & demographics
- Census place
- Berry Creek, CA
- City population
- 765
- Population (ZIP)
- 765
Population outlook (Butte County) Hauer SSP2
- Today (2025)
- 237,527 people
- By 2030
- 243,804 · +2.6%
- By 2040
- 253,899 · +6.9%
- By 2050
- 262,561 · +10.5%
- By 2075
- 283,709 · +19.4%
- By 2100
- 282,689 · +19.0%
Race, ethnicity, and origin ACS 2023
- Neighborhood character
- Predominantly White (86%)
- Race & ethnicity
- White 86% Hispanic / Latino 7% Two or more races 3% Native American 3%
- Hispanic origin (detail)
- Mexican 3% Puerto Rican 2%
- Common ancestry
- Hungarian 4% Slovak 3% Serbian 2%
- Foreign-born
- 1% · Canada
- Languages at home
- 98% English-only · Spanish 1% Other Indo-European 1%
Political lean MEDSL · Butte
- 2024 margin
- Toss-up / Even · D 46.8% · R 49.9% · Other 3.3%
- 2008→2024 swing
- -5.5pp toward R · 2008: 2.4pp · 2024: -3.1pp
- All cycles
- 2024: R+3.1 2020: D+1.7 2016: R+4.0 2012: R+3.9 2008: D+2.4
Not yet ingested
- Civics
- —
Market trends
- HPI YoY
- ▼ -0.66%
- Current HPI
- 147.2351
- Rent YoY
- —
- Metro
- —
- State GDP YoY
- ▲ 3.21%
- F500 in state
- 116
Industry mix (Fortune 500 HQ in CA)
| Industry | F500 HQs | Revenue |
|---|---|---|
| Technology | 27 | $1,492B |
|
||
| Financial Services | 3 | $174B |
|
||
| Retail | 3 | $44B |
|
||
| Insurance | 3 | $26B |
|
||
| Media / Entertainment | 2 | $115B |
|
||
| Pharmaceuticals / Biotech | 2 | $62B |
|
||
Price history
3 events — show timeline
- 2026-05-15 Relisted — CRMLS
- 2026-05-01 Pending — CRMLS
- 2026-04-27 Listed $98,500 CRMLS
Property tax history
+1.8%/yrLatest (2025): $1,033 · +4.4% YoY. Source: county tax records.
Cash-flow waterfall
monthlySold comps — $/sqft
last 12 mo · ≤1 miLoading sold comps…