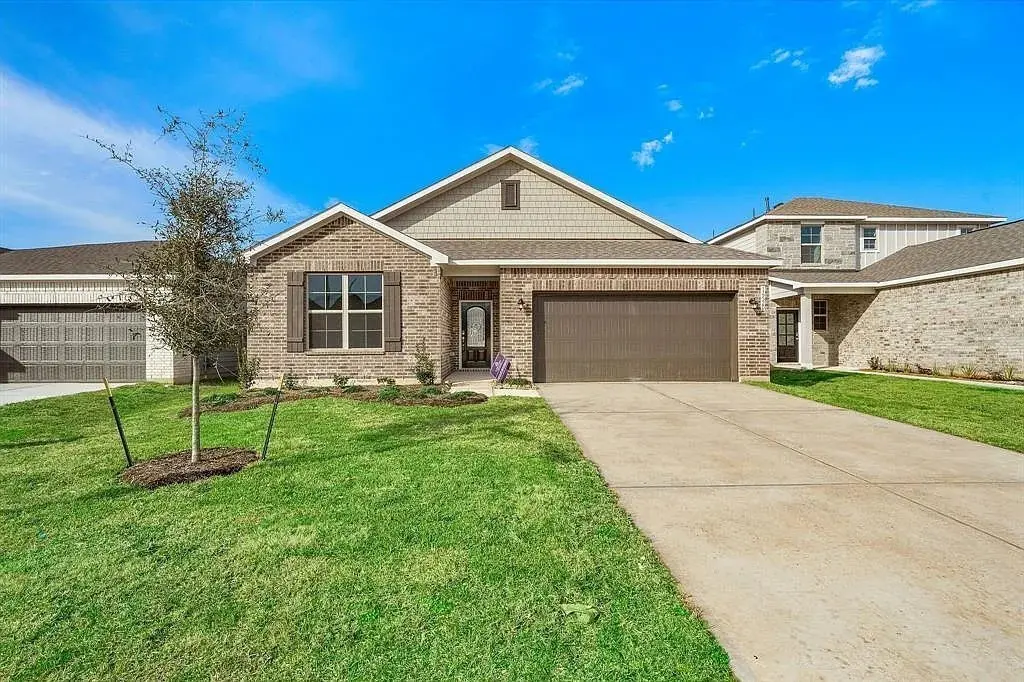
14520 Jelly Pines Dr · Grangerland, TX
Flood risk 1/10 · Minimal
- FEMA flood zone
- X (unshaded)
- Chance of flooding over 30 yrs
- 0.0%
- Est. flood insurance / yr
- $507 – $1,088
Fire risk 4/10 · Minor
- Est. fire insurance / yr
- $1,222 – $2,270
Heat risk 8/10 · Major
- Hot days now (above 112°F)
- 7 days/yr
- Hot days in 30 yrs
- 24 days/yr
Wind risk 8/10 · Major
- Chance of severe wind over 30 yrs
- 99.0%
Air-quality risk 3/10 · Minor
- Unhealthy air days now
- 2 days/yr
- Unhealthy air days in 30 yrs
- 3 days/yr
Risk factors via First Street. Map © Google.
Why this score? — see what drove the D grade
The composite is a weighted blend of 9 inputs, each scored 0–100. Each bar is that input's sub-score; the figure is the points it added to the 100-point composite (weight × sub-score).
- Cash flow +9.7/30.0
- ARV discount +7.6/15.0
- Schools +5.1/10.0
- Condition / age +4.8/5.0
- 1% rule +4.6/10.0
- Rent growth +3.3/5.0
- DSCR +2.8/10.0
- Livability +2.5/5.0
- Appreciation +0.0/10.0
$275,000
🖨 Deal sheet 📄 Offer letter ✓ Due diligence
Listing remarks MLS
Great standard features, including granite countertops in kitchen and all baths, 42 inch cabinets, whirlpool brand appliances, tankless water heater, full sod front and back, home automation powered by Google, large walk-in showers, coach lights and more!
Key facts
- Home automation
- Granite countertops
- 6,481 sq ft lot
Tags
Property features AI
Finance
- Other: Has additional parcels
- Financial info: Lease considered
- HOA & community: Community pool; Association managed by Associa Principal Mgmt Group; Annual association fee of $650
Exterior
- Parking: Attached 2-car garage
- Utilities: Public water; Public sewer
- Home design: Residential property; Single-story; Slab foundation; Built in 2021
- Construction: Brick and structural insulated panel construction; Composition roof
- Exterior features: Back yard fence; Subdivision lot
Interior
- Kitchen: Dishwasher; Disposal; Gas oven; Microwave; ENERGY STAR qualified appliances; Tankless water heater
- Bedrooms: Primary bedroom (first floor) — 15x13; Bedroom (first floor) — 13x11; Bedroom (first floor) — 13x11; Bedroom (first floor) — 13x10
- Flooring: Carpet; Plank; Tile; Vinyl
- Bathrooms: 3 full bathrooms
- Heating & cooling: Central heating (gas); Central air conditioning (electric); Attic fan
- Interior features: Double vanity; Separate shower; Ceiling fans; Programmable thermostat; Insulated doors
- Laundry & utility: Washer hookup; Electric dryer hookup
Neighborhood map
What this means for you Summary
Snapshot
- This is a 4-bed/2.5-bath single-family listed at $275k. Condition is rated excellent.
Deal economics
- At list price, monthly cash flow is $-180 ($-2k/yr) — negative.
- To cash-flow at today's rent, offer at most $243k (11.6% below list).
- To meet the 1% rule (rent ≥ 1% of price), the offer needs to be $263k (4.5% below list).
- Recommended offer: $243k (11.6% below list) — sets the bar for cash-flow.
Location & tenants
- Location reads: area grade D — affects rentability + tenant quality, not the cash-flow math above.
- Conroe ISD (other): math 57% / reading 57% proficiency, ranked #69 of 826 in TX (top 8%) — acceptable for families but not a draw, mixed tenant base, ~2y average lease.
- Zoned schools: Caney Creek H S (math 33% / reading 42%, grade F, #888 of 1,632 statewide, top 55%, 2,504 students, 79% FRL) — zoned schools average 79% FRL vs 34% district-wide (45 pts higher); higher-poverty schools than district average — tighter screening recommended.
- Zoned-school proficiency averages 38% at this address vs 57% district-wide (-20 pts) — the specific schools serving this property underperform the Conroe ISD average; the district grade overstates school quality for this exact location.
- Market conditions: Rents rising (+3.3%/yr); 1111 active listings in the ZIP; 2 comparable units currently listed for rent nearby; solid renter incomes; 13,259 units permitted in Montgomery County in 2024 (1,402 in 5+ unit buildings).
- This rent runs 37% of the median local income ($85k/yr) — at the standard rent-burdened threshold; future hikes will face affordability resistance.
Forward outlook
- Local home prices are declining (-3.0%/yr); year-one equity from $2k of loan paydown is wiped out by about $8k of value loss. Plan a longer hold.
- Montgomery County population projected at +65% by 2050 — long-run rental-demand tailwind backs the buy-and-hold thesis.
Negotiation context
- Only 10 days on market — expect competitive offers; lowballing is unlikely to land.
- 4 sale attempts since 5y ago; this cycle's ask is 12995% above the opening price — seller raised mid-cycle; expect resistance to lowballs.
Risks & watch-outs
- Watch-outs: property tax is 2.8% of price.
- Climate carrying-cost: severe wind risk, 99% chance of damaging wind over 30y; extreme-heat days projected 7→24/yr by 2055 (HVAC capex compounding) — expect insurance premiums to compound above CPI over the hold.
Questions for the listing agent
- What do current leases actually rent for vs. the listed asking? Can we see a recent rent roll and the last 12 months of T-12 income?
- Property tax is high relative to price — has the assessment been appealed recently, and will the sale trigger a re-assessment?
- What does the HOA fee cover, when was the last increase, and are there any pending special assessments or reserve-fund shortfalls?
- Is there a deadline driving the sale (1031 exchange, divorce, estate, relocation)? That informs how much negotiation room exists.
- The area grade is low — what's the realistic commute time and amenity access for the typical tenant pool here? Any planned neighborhood developments (good or bad) we should know about?
- What's the average days-on-market for RENTAL listings here right now (not sales)? A rising rental-DOM trend means longer vacancies and softer asking-rent achievability than the comps imply.
- What's the recent tenant-quality profile in this submarket — average credit score on applications, eviction rate, late-payment / NSF rate, and stable-employment percentage? A property-management company in the area should have these aggregated.
- How much new for-sale + rental construction is in the pipeline within 1–3 miles? Heavy new supply typically softens prices + rents 12–24 months out; constrained supply supports both.
Investment metrics
- 1% rule
- 0.96% ✗
- Cap rate
- 5.51%
- Cash-on-cash
- -2.81%
- DSCR
- 0.88
- GRM
- 8.7
CMA / ARV
- ARV (on-the-fly)
- $275,536
- Comps found
- 12
Show comp detail 12 sales within ~0.75 mi
| Address | Dist | Beds/Ba | Sqft | Sold | Price | $/sf | Match |
|---|---|---|---|---|---|---|---|
| 16812 Needlepoint Dr | 0.43mi | 3/2.5 (-1) | 2,026 (0%) | 1mo | $269,765 | $133 | 74 |
| 16866 Needlepoint Dr | 0.50mi | 4/2.5 | 2,049 (+1%) | 2mo | $279,212 | $136 | 73 |
| 16858 Needlepoint Dr | 0.48mi | 4/3.0 | 2,125 (+5%) | 3mo | $332,813 | $157 | 65 |
| 14305 Grey Pointe | 0.68mi | 4/2.5 | 1,981 (-2%) | 0mo | $269,790 | $136 | 64 |
| 14167 Granger Pointe Ln | 0.70mi | 4/2.5 | 1,981 (-2%) | 3mo | $285,790 | $144 | 62 |
| 14308 Grey Pointe Ct | 0.72mi | 4/2.5 | 1,981 (-2%) | 1mo | $264,640 | $134 | 62 |
| 14308 Ash Tree Dr | 0.49mi | 3/2.0 (-1) | 1,932 (-5%) | 2mo | $269,900 | $140 | 61 |
| 14143 Granger Pointe Ln | 0.74mi | 4/2.5 | 1,981 (-2%) | 2mo | $252,790 | $128 | 60 |
| 17014 Hazelnut Dr | 0.55mi | 3/2.0 (-1) | 1,932 (-5%) | 3mo | $274,900 | $142 | 57 |
| 16980 Hazelnut Dr | 0.59mi | 3/2.0 (-1) | 1,869 (-8%) | 3mo | $259,900 | $139 | 50 |
| 14154 Granger Pointe | 0.72mi | 4/2.5 | 2,255 (+11%) | 1mo | $269,540 | $120 | 47 |
| 14309 Grey Pointe | 0.68mi | 4/2.5 | 2,255 (+11%) | 3mo | $277,540 | $123 | 47 |
Match score weights: distance 35% · size 25% · config 20% · recency 20%. Top-matched comps best support the ARV.
Projected returns pro-forma
-3.0% appreciation · 3.3% rent growth · sell at horizon
- IRR
- -20.4%
- Equity multiple
- 0.29×
- Total profit
- $-54,978
- Equity at exit
- $41,003
- IRR
- -12.6%
- Equity multiple
- 0.24×
- Total profit
- $-58,312
- Equity at exit
- $23,777
Cash invested: $77,000 (down + closing). Projections, not guarantees.
Landlord ↔ Tenant lean methodology
- Overall (STATE)
- 87 Strongly Landlord-Friendly
- State Texas
- 87 Strongly Landlord-Friendly · R+5
- County
- — inherits STATE
- City
- — inherits STATE
ZIP-level market 77302
- Rents YoY
- 3.3%
- Active inventory
- 1111
- Price-to-rent
- 8.7×
Monthly cashflow live
- Estimated rent
- $2,627 medium interval (Pro) →
- Mortgage (P&I)
- −$1,442
- Tax from tax record
- −$644 /mo · $7,733/yr
- Insurance
- −$115
- HOA
- −$54
- Vacancy / Maint / Mgmt
- −$552
- Net cashflow
- $-180
Break-even live
UW: 25.0% down · 7.5% · 30yr · 1.5% tax · 5.0% vac · 8.0% maint · 8.0% mgmt
Financing live
Cash to close
- Down payment
- $68,750
- Closing costs
- $8,250
- Reserves months
- —
- Total cash needed
- —
Loan-product check · same deal, 3 products live
Conventional
25% down · 7.5% · 30yr
- Down + closing
- —
- Monthly P&I
- —
- Monthly cashflow
- —
- DSCR
- —
- Eligible?
- —
Personal DTI + credit; lowest rate.
DSCR
20% down · 8.5% · 30yr
- Down + closing
- —
- Monthly P&I
- —
- Monthly cashflow
- —
- DSCR
- —
- Eligible?
- —
No personal income docs; deal must DSCR.
Hard money
10% down · 12.0% · 12mo
- Down + closing
- —
- Monthly P&I
- —
- Monthly cashflow
- —
- DSCR
- —
- Eligible?
- —
Short-term bridge; refi at stabilization.
Rent comps 2 comps
| Address | Beds | Baths | Sqft | Rent | $/sqft | DOM | Units | Dist |
|---|---|---|---|---|---|---|---|---|
| 16703 Twisted Pine Dr Conroe, TX | 3.0–4.0 | 2.0–3.0 | 1671 | $2,230 | $1.33 | 1d | 13 | 0.33mi |
| 15271 Country West Dr Conroe, TX | 3.0 | 2.0 | 1568 | $1,350 | $0.86 | 43d | 1 | 1.07mi |
HOA detail
- Monthly dues
- $54 · $648/yr
- Likely covers
- waterpool
Listing history 9 events
-
2026-05-17$2,100
-
2026-05-16$275,000 Active
-
2024-03-02historical $2,100
-
2024-02-15price $2,100
-
2024-02-10price $2,150
-
2023-12-10$2,200
-
2021-12-10soldstatus Sold 255-char remark
Show marketing remark (255 chars)
Great standard features, including granite countertops in kitchen and all baths, 42 inch cabinets, whirlpool brand appliances, tankless water heater, full sod front and back, home automation powered by Google, large walk-in showers, coach lights and more!
-
2021-11-01status Pending 255-char remark
Show marketing remark (255 chars)
Great standard features, including granite countertops in kitchen and all baths, 42 inch cabinets, whirlpool brand appliances, tankless water heater, full sod front and back, home automation powered by Google, large walk-in showers, coach lights and more!
-
2021-08-05$302,340 Active 255-char remark
Show marketing remark (255 chars)
Great standard features, including granite countertops in kitchen and all baths, 42 inch cabinets, whirlpool brand appliances, tankless water heater, full sod front and back, home automation powered by Google, large walk-in showers, coach lights and more!
ⓘ Source: listings_history table (triggers on properties + properties_extension) + one-shot
backfill from property_details.listing_events for pre-trigger history.
Tax reassessment forecast TX · Resets to sale price
- Current annual tax
- $7,733 · $644/mo
- Projected year-2 tax
- $7,733 · $644/mo
- Expected delta
- $0/yr ($0/mo · 0.0%)
ⓘ Screening estimate from a state-policy table — verify with the county assessor before closing.
Climate risk First Street
- Flood 1/10 Low FEMA zone X (unshaded) · 0% chance over 30 yrs
- Wildfire 4/10 Moderate
- Heat 8/10 Severe 7 d/yr ≥112°F today · 24 d/yr by 30 yrs out
- Wind 8/10 Severe 99% chance of damaging wind over 30 yrs
- Air quality 3/10 Moderate 2 unhealthy d/yr today · 3 by 30 yrs out
Nearby sold comps map
Loading sold comps map…
Walkable amenities ~0.75 mi
Loading nearby amenities…
Taxation est. · year 1
- Rental income
- $31,519
- − Mortgage interest
- −$15,404
- − Property taxes
- −$7,733
- − Insurance
- −$1,375
- − Repairs & maintenance
- −$2,522
- − Management
- −$2,522
- − HOA
- −$648
- − Depreciation
- −$8,000
- Taxable loss
- −$6,684
- Est. tax savings @ 24.0%
- +$1,604
- After-tax cash flow
- $-557/yr
For passive investors: Depreciation is non-cash, so a rental often shows a tax loss while cash-flowing — sheltering income. Rental losses are passive: they offset passive income freely, and up to $25,000/yr can offset ordinary (W-2) income if you actively participate and your MAGI is under $100k (phasing out to $0 by $150k); unused losses carry forward. On sale, claimed depreciation is recaptured at up to 25%, and gains may owe capital-gains tax (a 1031 exchange can defer both). Figures are a year-1 estimate at your 24.0% rate — not tax advice; consult a CPA.
Condition & rehab AI · 12 photos
This home is in excellent condition with modern upgrades and a move-in-ready appearance. It offers a great opportunity for both resale and rental value with minimal additional work needed.
Value-add opportunities
- Both landscaping — enhances curb appeal and adds value
- Both painting — fresh paint can make a home more appealing
- Both upgrading light fixtures — modern light fixtures can improve aesthetics and energy efficiency
Renovation cost estimate screening
Value-add ROI direction
- Both landscaping — enhances curb appeal and adds value ↑
- Both painting — fresh paint can make a home more appealing ↑
- Both upgrading light fixtures — modern light fixtures can improve aesthetics and energy efficiency ↑
ⓘ Cost ranges are severity-bucket heuristics (US national rule-of-thumb). Get contractor quotes + a written scope before underwriting a rehab budget.
Schools (NCES district)
- District
- Conroe ISD
- NCES district ID
- 4815000
- Math proficiency
- 57% ▼ -6.00%
- Reading proficiency
- 57% ▼ -1.00%
- Median HH income
- $71,541
- Composite
- 50.65/100
- National rank
- #1833
- State rank
- #69 of 826 in TX
Livability — Grangerland
No livability data for this city. (Only ~50 U.S. cities are tracked.)
Census & demographics
- County
- Montgomery County · 663,713 people
- Metro
- Houston-The Woodlands-Sugar Land, TX
- Population (ZIP)
- 21,546
- Household income
- $84,673
- Rent vs Own
- Severe rent burden
- 205.0
Population outlook (Montgomery County) Hauer SSP2
- Today (2025)
- 713,896 people
- By 2030
- 805,263 · +12.8%
- By 2040
- 992,708 · +39.1%
- By 2050
- 1,179,590 · +65.2%
- By 2075
- 1,628,084 · +128.1%
- By 2100
- 1,937,880 · +171.5%
Race, ethnicity, and origin ACS 2023
- Neighborhood character
- Majority White (63%)
- Race & ethnicity
- White 63% Hispanic / Latino 29% Two or more races 19% Black 3% Asian 1%
- Hispanic origin (detail)
- Mexican 26% Puerto Rican 1%
- Common ancestry
- Lithuanian 3% Italian 2% Slovak 2%
- Foreign-born
- 13% · Canada, Vietnam, China
- Languages at home
- 78% English-only · Spanish 20% Russian/Polish/Slavic 1% Other Indo-European 0%
Political lean MEDSL · Montgomery
- 2024 margin
- Solid R (+45.5) · D 26.8% · R 72.3%
- 2008→2024 swing
- +7.2pp toward D · 2008: -52.7pp · 2024: -45.5pp
- All cycles
- 2024: R+45.5 2020: R+43.8 2016: R+51.4 2012: R+60.7 2008: R+52.7
Not yet ingested
- Civics
- —
Market trends
- HPI YoY
- ▼ -187.56%
- Current HPI
- 262.1879
- Rent YoY
- ▲ 3.30%
- Metro
- Houston-The Woodlands-Sugar Land, TX
- State GDP YoY
- ▲ 3.95%
- F500 in state
- 110
Industry mix (Fortune 500 HQ in TX)
| Industry | F500 HQs | Revenue |
|---|---|---|
| Energy | 16 | $1,198B |
|
||
| Technology | 5 | $198B |
|
||
| Engineering / Construction | 4 | $72B |
|
||
| Energy Services | 3 | $60B |
|
||
| Utilities | 3 | $41B |
|
||
| Healthcare | 2 | $330B |
|
||
Price history
-99.3% since first listed9 events — show timeline
- 2026-05-17 Listed for Rent $2,100 HARMLS
- 2026-05-16 Listed $275,000 HARMLS
- 2024-03-02 Rental Removed $2,100 HARMLS
- 2024-02-15 Price Changed $2,100 HARMLS
- 2024-02-10 Price Changed $2,150 HARMLS
- 2023-12-10 Listed for Rent $2,200 HARMLS
- 2021-12-10 Sold (MLS) — HARMLS
- 2021-11-01 Pending — HARMLS
- 2021-08-05 Listed $302,340 HARMLS
Property tax history
+0.9%/yrLatest (2025): $7,733 · -2.4% YoY. Source: county tax records.
Cash-flow waterfall
monthlySold comps — $/sqft
last 12 mo · ≤1 miLoading sold comps…