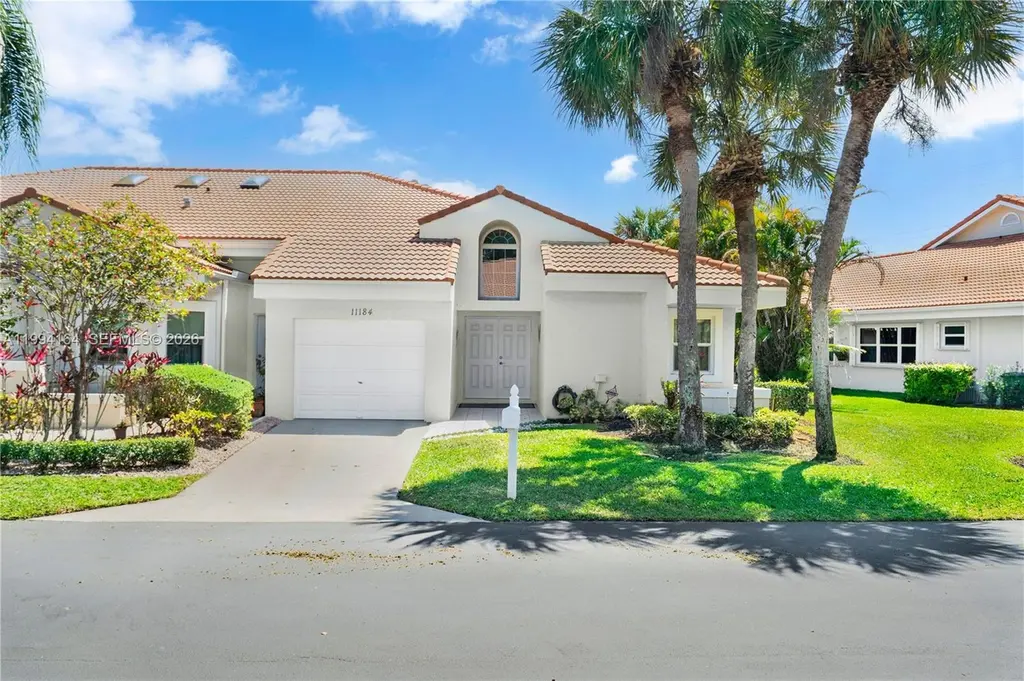
11184 Sangria Ct · Boca Raton, FL
Flood risk 1/10 · Minimal
- FEMA flood zone
- X (unshaded)
- Chance of flooding over 30 yrs
- 0.0%
- Est. flood insurance / yr
- $507 – $1,088
Fire risk 5/10 · Moderate
- Est. fire insurance / yr
- $947 – $1,759
Heat risk 10/10 · Severe
- Hot days now (above 107°F)
- 7 days/yr
- Hot days in 30 yrs
- 27 days/yr
Wind risk 10/10 · Severe
- Chance of severe wind over 30 yrs
- 99.0%
Air-quality risk 2/10 · Minimal
- Unhealthy air days now
- 2 days/yr
- Unhealthy air days in 30 yrs
- 2 days/yr
Risk factors via First Street. Map © Google.
Why this score? — see what drove the B- grade
The composite is a weighted blend of 9 inputs, each scored 0–100. Each bar is that input's sub-score; the figure is the points it added to the 100-point composite (weight × sub-score).
- Cash flow +21.1/30.0
- ARV discount +11.7/15.0
- Appreciation +7.3/10.0
- DSCR +6.7/10.0
- 1% rule +5.5/10.0
- Schools +4.3/10.0
- Livability +3.9/5.0
- Rent growth +2.5/5.0
- Condition / age +2.5/5.0
$379,000
🖨 Deal sheet 📄 Offer letter ✓ Due diligence
Listing remarks MLS
WONDERFUL LIGHT & BRIGHT CORNER VILLA W/GARAGE. LAKEVIEW! TILE THRU-OUT LIVING AREA! FLORIDA ROOM & FAMILY ROOM. ROOF-2009. VERY LITTLE WALLPAPER. SHOWS BEAUTIFULLY! ACTIVE CLUBHOUSE, POOL, TENNIS, FITNESS RM. ASSOC SAYS 55 COMM. NO PETS. EZSHOW
Key facts
- Gated community
- New flooring
- Enclosed patio
Tags
Property features AI
Finance
- Financial info: Pets allowed conditionally (restrictions may apply)
- HOA & community: Monthly association fee; Association fee includes amenities, common areas, grounds maintenance, structure maintenance, sewer, and security; Association amenities include pool and tennis courts; Senior community
Exterior
- Parking: Covered parking; Garage door opener; 1 covered garage space; Two or more total parking spaces
- Security: Phone entry; Security guard; Complex fenced
- Utilities: Cable available
- Home design: Single-story; Has attached property; Entry at level 1
- Construction: Block construction; Effective year built
- Exterior features: Lakefront property; Association pool; Tennis courts; Security/high-impact doors; Complex fenced; Phone entry; Security guard; Has a view
Interior
- Kitchen: Electric range; Microwave; Dishwasher; Refrigerator
- Bedrooms: Primary bedroom on main level
- Flooring: Tile flooring
- Bathrooms: 2 full bathrooms
- Heating & cooling: Central heating; Central air conditioning
- Interior features: First-floor entry; Bedroom on the main level; Main-level primary bedroom
- Laundry & utility: Washer and dryer; Electric water heater
Neighborhood map
What this means for you Summary
Snapshot
- This is a 2-bed/2.0-bath single-family listed at $379k.
Deal economics
- At list price, monthly cash flow is $540 ($6k/yr) — positive.
- The deal already cash-flows at list — no discount required.
- Meets the 1% rule at list price ($4k rent vs $379k).
- Recommended offer: $368k (3.0% below list) — sets the bar for market timing.
- Cap rate 8.0% vs local median 2.8% in Boca Raton — top-decile yield for the area; either an underpriced asset or a hidden risk that comps aren't pricing in. Stress-test before assuming the spread holds.
Location & tenants
- Location reads 77/100 on livability (#192 in FL, #3,070 nationally) — a middle-class / working-renter tenant base. Strengths: schools A+, employment A+, health & safety A+; Watch: amenities D, cost of living F.
- Palm Beach (suburban): math 46% / reading 53% proficiency, ranked #34 of 73 in FL (top 47%) — families likely to look elsewhere, expect single-tenant / working-renter base with shorter leases.
- Market conditions: 92 active listings in the ZIP; 14 comparable units currently listed for rent nearby; rentals at typical pace (median 19d on market — plan ~3-4 weeks tenant-placement turnaround); high-income renter base; 3,974 units permitted in Palm Beach County in 2024 (1,012 in 5+ unit buildings).
- This rent runs 32% of the median local income ($147k/yr) — at the standard rent-burdened threshold; future hikes will face affordability resistance.
Forward outlook
- In year one you build about $20k of equity ($3k loan paydown + $18k appreciation (4.7% local appreciation)).
- Palm Beach County population projected at +30% by 2050 — long-run rental-demand tailwind backs the buy-and-hold thesis.
- At projected returns (4.7% appreciation + 3.0% rent growth), your $106k cash investment doubles in ~4 years — after that, you're playing with house money.
- By year 2, paydown + projected appreciation supports a ~$33k cash-out refi (75% LTV) — recoverable capital for the next deal without selling this one.
Negotiation context
- It's been on market 51 days — a 3% lower offer ($368k) is reasonable based on typical stale-listing flexibility.
- 3 sale attempts since 14y ago with the ask held roughly flat each time — persistent listings suggest the price (not the market) is what's stuck; bring a comps-based counter.
- Current owner paid $127k; list at $379k implies a 198% gain — meaningful room to come down on a strong offer.
Risks & watch-outs
- Climate carrying-cost: severe wind risk, 99% chance of damaging wind over 30y; moderate wildfire risk; extreme-heat days projected 7→27/yr by 2055 (HVAC capex compounding) — expect insurance premiums to compound above CPI over the hold.
Questions for the listing agent
- It's been on market 51 days. Have you received any prior offers? Is the seller open to a 3% concession, seller financing, or rate buy-down credit?
- What does the HOA fee cover, when was the last increase, and are there any pending special assessments or reserve-fund shortfalls?
- Is there a deadline driving the sale (1031 exchange, divorce, estate, relocation)? That informs how much negotiation room exists.
- Schools are A-rated — typically a magnet for longer-tenancy family renters. What's the average tenant stay here, and is there a school-zone premium baked into asking?
- What's the average days-on-market for RENTAL listings here right now (not sales)? A rising rental-DOM trend means longer vacancies and softer asking-rent achievability than the comps imply.
- What's the recent tenant-quality profile in this submarket — average credit score on applications, eviction rate, late-payment / NSF rate, and stable-employment percentage? A property-management company in the area should have these aggregated.
- How much new for-sale + rental construction is in the pipeline within 1–3 miles? Heavy new supply typically softens prices + rents 12–24 months out; constrained supply supports both.
Investment metrics
- 1% rule
- 1.05% ✓
- Cap rate
- 8.00%
- Cash-on-cash
- 6.11%
- DSCR
- 1.27
- GRM
- 7.9
CMA / ARV
- ARV (on-the-fly)
- $417,934
- Comps found
- 1
Show comp detail 1 sale within ~0.75 mi
| Address | Dist | Beds/Ba | Sqft | Sold | Price | $/sf | Match |
|---|---|---|---|---|---|---|---|
| 10608 180th Pl S | 0.55mi | 3/2.0 (+1) | 1,857 (+8%) | 9mo | $450,000 | $242 | 49 |
Match score weights: distance 35% · size 25% · config 20% · recency 20%. Top-matched comps best support the ARV.
Projected returns pro-forma
4.68% appreciation · 3.0% rent growth · sell at horizon
- IRR
- 17.4%
- Equity multiple
- 2.08×
- Total profit
- $114,908
- Equity at exit
- $207,416
- IRR
- 17.7%
- Equity multiple
- 4.03×
- Total profit
- $321,164
- Equity at exit
- $352,032
Cash invested: $106,120 (down + closing). Projections, not guarantees.
Landlord ↔ Tenant lean methodology
- Overall (STATE)
- 87 Strongly Landlord-Friendly
- State Florida
- 87 Strongly Landlord-Friendly · R+3
- County
- — inherits STATE
- City
- — inherits STATE
ZIP-level market 33498
- Home prices YoY
- 1.5%
- Active inventory
- 92
- Price-to-rent
- 7.9×
Monthly cashflow live
- Estimated rent
- $3,974 high interval (Pro) →
- Mortgage (P&I)
- −$1,988
- Tax from tax record
- −$193 /mo · $2,315/yr
- Insurance
- −$158
- HOA
- −$261
- Vacancy / Maint / Mgmt
- −$835
- Net cashflow
- $540
Break-even live
UW: 25.0% down · 7.5% · 30yr · 1.5% tax · 5.0% vac · 8.0% maint · 8.0% mgmt
Financing live
Cash to close
- Down payment
- $94,750
- Closing costs
- $11,370
- Reserves months
- —
- Total cash needed
- —
Loan-product check · same deal, 3 products live
Conventional
25% down · 7.5% · 30yr
- Down + closing
- —
- Monthly P&I
- —
- Monthly cashflow
- —
- DSCR
- —
- Eligible?
- —
Personal DTI + credit; lowest rate.
DSCR
20% down · 8.5% · 30yr
- Down + closing
- —
- Monthly P&I
- —
- Monthly cashflow
- —
- DSCR
- —
- Eligible?
- —
No personal income docs; deal must DSCR.
Hard money
10% down · 12.0% · 12mo
- Down + closing
- —
- Monthly P&I
- —
- Monthly cashflow
- —
- DSCR
- —
- Eligible?
- —
Short-term bridge; refi at stabilization.
Rent comps 14 comps
| Address | Beds | Baths | Sqft | Rent | $/sqft | DOM | Units | Dist |
|---|---|---|---|---|---|---|---|---|
| 10875 Lake Front Pl Unit 10875 Boca Raton, FL | 2.0 | 2.0 | 1204 | $2,300 | $1.91 | 24d | 1 | 0.35mi |
| 10781 Cypress Lake Ter Boca Raton, FL | 3.0 | 2.0 | 1450 | $3,800 | $2.62 | 18d | 1 | 0.49mi |
| 10781 Cypress Lake Ter Boca Raton, FL | 3.0 | 2.0 | 1450 | $3,600 | $2.48 | 18d | 1 | 0.49mi |
| 10780 Cypress Lake Ter Boca Raton, FL | 3.0 | 2.0 | 1450 | $3,500 | $2.41 | 8d | 1 | 0.50mi |
| 10766 Crescendo Cir Unit X Boca Raton, FL | 3.0 | 2.5 | 2223 | $4,500 | $2.02 | 24d | 1 | 0.86mi |
| 18965 Adagio Dr Boca Raton, FL | 3.0 | 2.0 | 1795 | $5,250 | $2.92 | 24d | 1 | 0.94mi |
| 9975 Boca Gardens Trl Unit A Boca Raton, FL | 3.0 | 2.0 | 1276 | $3,300 | $2.59 | 8d | 1 | 1.28mi |
| 9928 Moss Pond Dr Boca Raton, FL | 3.0 | 2.5 | 1843 | $4,500 | $2.44 | 24d | 1 | 1.41mi |
| 9928 Moss Pond Dr Unit 9928 Boca Raton, FL | 3.0 | 2.5 | 1843 | $4,500 | $2.44 | 15d | 1 | 1.41mi |
| 9928 Moss Pond Dr Boca Raton, FL | 3.0 | 2.5 | 1843 | $4,500 | $2.44 | 12d | 1 | 1.41mi |
| 9850 Ridgecreek Rd Boca Raton, FL | 3.0 | 2.0 | 1364 | $3,600 | $2.64 | 24d | 1 | 1.48mi |
| 18813 Cloud Lake Cir Boca Raton, FL | 3.0 | 2.0 | 1132 | $3,400 | $3.00 | 4d | 1 | 1.48mi |
| 18813 Cloud Lake Cir Boca Raton, FL | 3.0 | 2.0 | 1132 | $3,500 | $3.09 | 5d | 1 | 1.48mi |
| 9841 Ridgecreek Rd Boca Raton, FL | 3.0 | 2.0 | 1435 | $4,500 | $3.14 | 24d | 1 | 1.50mi |
HOA detail
- Monthly dues
- $261 · $3,132/yr
- Likely covers
- pool
Listing history 9 events
-
2026-06-13statusdays on market $379,000 Pending 51 DOM
-
2026-06-09days on market $379,000 Active 48 DOM
-
2026-06-08days on market $379,000 Active 47 DOM
-
2026-06-07days on market $379,000 Active 46 DOM
-
2026-06-04days on market $379,000 Active 43 DOM
-
2026-06-03days on market $379,000 Active 42 DOM
-
2026-06-02days on market $379,000 Active 41 DOM
-
2026-06-01days on market $379,000 Active 40 DOM
-
2026-05-31days on market $379,000 Active 39 DOM
ⓘ Source: listings_history table (triggers on properties + properties_extension) + one-shot
backfill from property_details.listing_events for pre-trigger history.
Tax reassessment forecast FL · Resets to sale price
- Current annual tax
- $2,315 · $193/mo
- Projected year-2 tax
- $3,146 · $262/mo
- Expected delta
- +$831/yr (+$69/mo · 35.9%)
ⓘ Screening estimate from a state-policy table — verify with the county assessor before closing.
Climate risk First Street
- Flood 1/10 Low FEMA zone X (unshaded) · 0% chance over 30 yrs
- Wildfire 5/10 Major
- Heat 10/10 Extreme 7 d/yr ≥107°F today · 27 d/yr by 30 yrs out
- Wind 10/10 Extreme 99% chance of damaging wind over 30 yrs
- Air quality 2/10 Low 2 unhealthy d/yr today · 2 by 30 yrs out
Nearby sold comps map
Loading sold comps map…
Walkable amenities ~0.75 mi
Loading nearby amenities…
Taxation est. · year 1
- Rental income
- $47,693
- − Mortgage interest
- −$21,230
- − Property taxes
- −$2,315
- − Insurance
- −$1,895
- − Repairs & maintenance
- −$3,815
- − Management
- −$3,815
- − HOA
- −$3,132
- − Depreciation
- −$11,025
- Taxable income
- $465
- Est. tax owed @ 24.0%
- −$112
- After-tax cash flow
- $6,374/yr
For passive investors: Depreciation is non-cash, so a rental often shows a tax loss while cash-flowing — sheltering income. Rental losses are passive: they offset passive income freely, and up to $25,000/yr can offset ordinary (W-2) income if you actively participate and your MAGI is under $100k (phasing out to $0 by $150k); unused losses carry forward. On sale, claimed depreciation is recaptured at up to 25%, and gains may owe capital-gains tax (a 1031 exchange can defer both). Figures are a year-1 estimate at your 24.0% rate — not tax advice; consult a CPA.
Schools (NCES district)
- District
- Palm Beach
- NCES district ID
- 1201500
- Math proficiency
- 46% ▼ -16.00%
- Reading proficiency
- 53% ▼ -4.00%
- Median HH income
- $53,943
- Composite
- 42.72/100
- National rank
- #3160
- State rank
- #34 of 73 in FL
Livability — Boca Raton
- Score
- 77/100
- State rank
- #192
- US rank
- #3070
Category grades
Schools grade is shown separately in the Schools card above.
Census & demographics
- County
- Palm Beach County · 1,438,312 people
- City population
- 250,102
- Metro
- Miami-Fort Lauderdale-Pompano Beach, FL
- Population (ZIP)
- 16,853
- Household income
- $146,765
- Rent vs Own
- Severe rent burden
- 65.0
Population outlook (Palm Beach County) Hauer SSP2
- Today (2025)
- 1,637,487 people
- By 2030
- 1,743,255 · +6.5%
- By 2040
- 1,948,712 · +19.0%
- By 2050
- 2,132,979 · +30.3%
- By 2075
- 2,530,027 · +54.5%
- By 2100
- 2,706,979 · +65.3%
Race, ethnicity, and origin ACS 2023
- Neighborhood character
- Predominantly White (68%)
- Race & ethnicity
- White 68% Hispanic / Latino 20% Two or more races 16% Asian 3% Black 2%
- Hispanic origin (detail)
- Mexican 2% Cuban 6%
- Common ancestry
- Romanian 17% Scotch-Irish 6% Italian 3%
- Foreign-born
- 28% · Canada, Dominican Republic, China
- Languages at home
- 72% English-only · Spanish 12% Other Indo-European 6% Russian/Polish/Slavic 5%
Political lean MEDSL · Palm Beach
- 2024 margin
- Toss-up / Even · D 50.0% · R 49.2%
- 2008→2024 swing
- -22.1pp toward R · 2008: 22.9pp · 2024: 0.8pp
- All cycles
- 2024: D+0.8 2020: D+12.8 2016: D+15.3 2012: D+17.0 2008: D+22.9
Not yet ingested
- Civics
- —
Market trends
- HPI YoY
- ▲ 4.68%
- Current HPI
- 325.4026
- Rent YoY
- —
- Metro
- Miami-Fort Lauderdale-Pompano Beach, FL
- State GDP YoY
- ▲ 3.28%
- F500 in state
- 36
Industry mix (Fortune 500 HQ in FL)
| Industry | F500 HQs | Revenue |
|---|---|---|
| Industrial Technology | 2 | $29B |
|
||
| Insurance | 2 | $17B |
|
||
| Retail | 1 | $60B |
|
||
| Technology Distribution | 1 | $58B |
|
||
| Homebuilding | 1 | $35B |
|
||
| Technology Manufacturing | 1 | $35B |
|
||
Price history
+199.6% since first listed9 events — show timeline
- 2026-05-27 Relisted — MARMLS
- 2026-04-30 Price Changed $379,000 MARMLS
- 2026-04-30 Price Changed $369,000 MARMLS
- 2026-04-02 Listed $379,000 MARMLS
- 2013-01-08 Sold (Public Records) $127,000 Public Records
- 2012-12-11 Sold (MLS) $127,000 Beaches MLS
- 2012-11-01 Listing Removed — Beaches MLS
- 2012-09-13 Listed $139,900 Beaches MLS
- 1988-09-21 Sold (Public Records) $126,500 Public Records
Property tax history
+1.8%/yrLatest (2025): $2,315 · +3.4% YoY. Source: county tax records.
Cash-flow waterfall
monthlySold comps — $/sqft
last 12 mo · ≤1 miLoading sold comps…