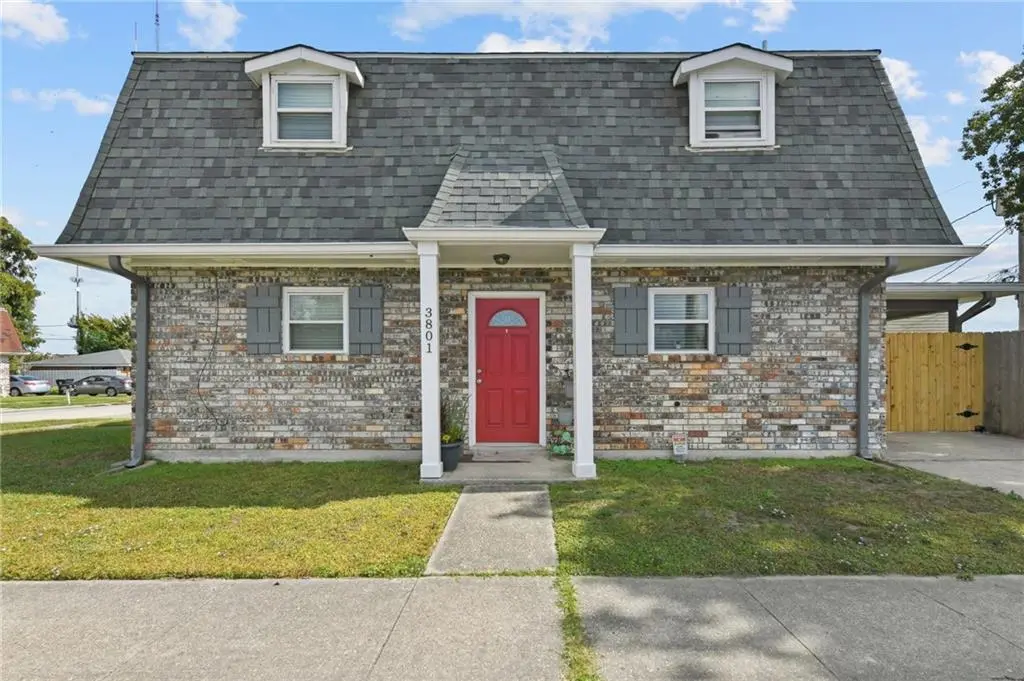
3801 Laplace St · Chalmette, LA
Flood risk 8/10 · Major
- FEMA flood zone
- AE
- Chance of flooding over 30 yrs
- 0.76%
- Est. flood insurance / yr
- $1,737 – $8,500
Fire risk 2/10 · Minimal
- Est. fire insurance / yr
- $1,269 – $2,357
Heat risk 10/10 · Severe
- Hot days now (above 108°F)
- 7 days/yr
- Hot days in 30 yrs
- 22 days/yr
Wind risk 10/10 · Severe
- Chance of severe wind over 30 yrs
- 99.0%
Air-quality risk 3/10 · Minor
- Unhealthy air days now
- 3 days/yr
- Unhealthy air days in 30 yrs
- 3 days/yr
Risk factors via First Street. Map © Google.
Why this score? — see what drove the C- grade
The composite is a weighted blend of 9 inputs, each scored 0–100. Each bar is that input's sub-score; the figure is the points it added to the 100-point composite (weight × sub-score).
- Cash flow +16.7/30.0
- ARV discount +15.0/15.0
- DSCR +5.2/10.0
- Schools +5.0/10.0
- 1% rule +4.0/10.0
- Rent growth +3.3/5.0
- Livability +3.2/5.0
- Condition / age +2.5/5.0
- Appreciation +0.0/10.0
$234,000
🖨 Deal sheet (PDF) 📄 Offer letter ✓ Due diligence
Listing remarks MLS
Income Producing Townhouse style Double on a corner lot with new roof and new insulated windows. Located in a Federal Opportunity Zone! Ideal for owner occupant as this property lives like 2 separate homes with totally separate entrances on different streets. Each unit has its own driveway parking. Both sides have open kitchens downstairs with living room, laundry closet, half bath and living room. Each unit has 2 large bedrooms upstairs and 1 full bathroom. The Laplace St side enjoys a large back yard with covered patio and gated parking for your boat or trailer. Long term tenants on the Pierre St side.
Key facts
- Open kitchens
- Separate entrances
- Driveway parking
Tags
Property features AI
Finance
- Financial info: Two units total (multi-unit); Tenants pay electricity
Exterior
- Parking: Driveway parking; Three or more parking spaces; Boat parking available; RV access/parking
- Utilities: Public water; Public sewer
- Home design: Two-story property
- Construction: Brick construction; Asphalt shingle roof; Slab foundation; Property in very good condition
- Exterior features: Fenced yard; Corner lot; City lot; Lot dimensions approximately 50 x 100
Interior
- Bathrooms: Two full bathrooms; Two half bathrooms
- Heating & cooling: Central heating; Central air conditioning
- Interior features: Screens on windows
- Laundry & utility: In-unit laundry
Neighborhood map
What this means for you Summary
Snapshot
- This is a 4-bed/3.0-bath townhouse listed at $234k.
Deal economics
- At list price, monthly cash flow is $-281 ($-3k/yr) — negative.
- To cash-flow at today's rent, offer at most $184k (21.2% below list).
- To meet the 1% rule (rent ≥ 1% of price), the offer needs to be $211k (10.0% below list).
- Recommended offer: $184k (21.2% below list) — sets the bar for cash-flow.
- Cap rate 7.0% vs local median 5.4% in Chalmette — top-decile yield for the area; either an underpriced asset or a hidden risk that comps aren't pricing in. Stress-test before assuming the spread holds.
Location & tenants
- Location reads 65/100 on livability (#137 in LA) — a middle-class / working-renter tenant base. Strengths: cost of living A+, housing A+, health & safety A; Watch: crime F, amenities F, commute F.
- Market conditions: Rents rising (+3.1%/yr); 214 active listings in the ZIP; 12 comparable units currently listed for rent nearby; rentals at typical pace (median 26d on market — plan ~3-4 weeks tenant-placement turnaround); 112 units permitted in St. Bernard Parish in 2024 (0 in 5+ unit buildings).
- At $2,105/mo this rent would consume 46% of the median local household income ($55k/yr) (locally 881% of renters already pay >50% of income on rent) — very limited rent-growth headroom before tenants either downsize or default.
Forward outlook
- Local home prices are declining (-3.0%/yr); year-one equity from $2k of loan paydown is wiped out by about $7k of value loss. Plan a longer hold.
- St. Bernard County population projected at +89% by 2050 — long-run rental-demand tailwind backs the buy-and-hold thesis.
Negotiation context
- It's been on market 40 days — a 3% lower offer ($227k) is reasonable based on typical stale-listing flexibility.
- 5 sale attempts since 6y ago with the ask held roughly flat each time — persistent listings suggest the price (not the market) is what's stuck; bring a comps-based counter.
- Current owner paid $160k; 46% above their basis — modest negotiation headroom, anchor on the comps not their cost.
Risks & watch-outs
- Watch-outs: flood insurance adds $427/mo.
- Climate carrying-cost: in FEMA flood zone AE (mandatory federal flood insurance); severe wind risk, 99% chance of damaging wind over 30y; extreme-heat days projected 7→22/yr by 2055 (HVAC capex compounding) — expect insurance premiums to compound above CPI over the hold.
Questions for the listing agent
- What do current leases actually rent for vs. the listed asking? Can we see a recent rent roll and the last 12 months of T-12 income?
- It's been on market 40 days. Have you received any prior offers? Is the seller open to a 21% concession, seller financing, or rate buy-down credit?
- Built in 1975 — when were the roof, HVAC, electrical panel, plumbing, and water heater last replaced?
- What's the actual annual flood-insurance premium (NFIP or private), and is the property in a SFHA with mandatory coverage?
- Is there a deadline driving the sale (1031 exchange, divorce, estate, relocation)? That informs how much negotiation room exists.
- Crime grade is F in this area — have there been break-ins, vandalism, or insurance claims at this property in the last 3 years? What carrier currently insures it and at what premium?
- What's the average days-on-market for RENTAL listings here right now (not sales)? A rising rental-DOM trend means longer vacancies and softer asking-rent achievability than the comps imply.
- What's the recent tenant-quality profile in this submarket — average credit score on applications, eviction rate, late-payment / NSF rate, and stable-employment percentage? A property-management company in the area should have these aggregated.
- How much new for-sale + rental construction is in the pipeline within 1–3 miles? Heavy new supply typically softens prices + rents 12–24 months out; constrained supply supports both.
Investment metrics
- 1% rule
- 0.90% ✗
- Cap rate
- 7.04%
- Cash-on-cash
- 2.67%
- DSCR
- 1.12
- GRM
- 9.3
CMA / ARV
- ARV (median comp)
- $281,388
- List price
- $234,000
- Delta
- -16.84%
- Verdict
- UNDERPRICED
- Comps
- 2 within 1.0 mi
Projected returns pro-forma
-3.0% appreciation · 3.11% rent growth · sell at horizon
- IRR
- -24.8%
- Equity multiple
- 0.16×
- Total profit
- $-55,321
- Equity at exit
- $34,890
- IRR
- -19.7%
- Equity multiple
- -0.06×
- Total profit
- $-69,278
- Equity at exit
- $20,232
Cash invested: $65,520 (down + closing). Projections, not guarantees.
Landlord ↔ Tenant lean methodology
- Overall (STATE)
- 90 Strongly Landlord-Friendly
- State Louisiana
- 90 Strongly Landlord-Friendly · R+12
- County
- — inherits STATE
- City
- — inherits STATE
ZIP-level market 70043
- Rents YoY
- 3.1%
- Active inventory
- 214
- Price-to-rent
- 9.3×
Monthly cashflow live
- Estimated rent
- $2,105 high interval (Pro) →
- Mortgage (P&I)
- −$1,227
- Tax from tax record
- −$193 /mo · $2,312/yr
- Insurance
- −$98
- Flood insurance flood zone
- −$427 /mo · $5,118/yr
- HOA
- −$0
- Vacancy / Maint / Mgmt
- −$442
- Net cashflow
- $-281
Break-even live
Sensitivity live
| Price | -10% $-148 | -5% $-214 | +0% $-281 | +5% $-347 | +10% $-413 |
|---|---|---|---|---|---|
| Rent | -10% $-447 | -5% $-364 | +0% $-281 | +5% $-197 | +10% $-114 |
| Rate | -1.0pp $-163 | -0.5pp $-221 | base $-281 | +0.5pp $-341 | +1.0pp $-403 |
UW: 25.0% down · 7.5% · 30yr · 1.5% tax · 5.0% vac · 8.0% maint · 8.0% mgmt
Financing live
Cash to close
- Down payment
- $58,500
- Closing costs
- $7,020
- Reserves months
- —
- Total cash needed
- —
Loan-product check · same deal, 3 products live
Conventional
25% down · 7.5% · 30yr
- Down + closing
- —
- Monthly P&I
- —
- Monthly cashflow
- —
- DSCR
- —
- Eligible?
- —
Personal DTI + credit; lowest rate.
DSCR
20% down · 8.5% · 30yr
- Down + closing
- —
- Monthly P&I
- —
- Monthly cashflow
- —
- DSCR
- —
- Eligible?
- —
No personal income docs; deal must DSCR.
Hard money
10% down · 12.0% · 12mo
- Down + closing
- —
- Monthly P&I
- —
- Monthly cashflow
- —
- DSCR
- —
- Eligible?
- —
Short-term bridge; refi at stabilization.
Rent comps 12 comps
| Address | Beds | Baths | Sqft | Rent | $/sqft | DOM | Units | Dist |
|---|---|---|---|---|---|---|---|---|
| 3708 Veronica Dr Chalmette, LA | 3.0 | 2.0 | 1818 | $2,550 | $1.40 | 3d | 1 | 0.45mi |
| 3321 Plaza Dr Chalmette, LA | 3.0 | 2.0 | 1400 | $1,650 | $1.18 | 12d | 1 | 0.48mi |
| 3606 Pakenham Dr Unit 3606 Chalmette, LA | 3.0 | 2.0 | 1400 | $1,800 | $1.29 | 13d | 1 | 0.71mi |
| 3012 Volpe Dr Chalmette, LA | 3.0 | 2.0 | 1812 | $2,500 | $1.38 | 45d | 1 | 0.83mi |
| 3629 Charles Dr Chalmette, LA | 3.0 | 2.0 | 1405 | $1,600 | $1.14 | 16d | 1 | 0.85mi |
| 2518 Delambert St Chalmette, LA | 3.0 | 2.0 | 1617 | $1,825 | $1.13 | 45d | 1 | 0.90mi |
| 2708 Volpe Dr Chalmette, LA | 3.0 | 2.0 | 1556 | $2,300 | $1.48 | 23d | 1 | 0.98mi |
| 2707 Jackson Blvd Chalmette, LA | 3.0 | 3.0 | 1733 | $2,300 | $1.33 | 45d | 1 | 1.01mi |
| 2707 Jackson Blvd Chalmette, LA | 3.0 | 2.5 | 1733 | $2,300 | $1.33 | 25d | 1 | 1.01mi |
| 2429 Octavia Dr Chalmette, LA | 3.0 | 2.0 | 1700 | $1,575 | $0.93 | 25d | 1 | 1.05mi |
| 1804 Wisconsin St Chalmette, LA | 3.0 | 3.0 | 2350 | $2,000 | $0.85 | 25d | 1 | 1.05mi |
| 8413 Benjamin Dr Chalmette, LA | 3.0 | 2.0 | 1800 | $2,300 | $1.28 | 5d | 1 | 1.28mi |
Listing history 26 events
-
2026-06-21days on market $234,000 Active 40 DOM
-
2026-06-18days on market $234,000 Active 37 DOM
-
2026-06-17days on market $234,000 Active 36 DOM
-
2026-06-16days on market $234,000 Active 35 DOM
-
2026-06-15days on market $234,000 Active 34 DOM
-
2026-06-13days on market $234,000 Active 32 DOM
-
2026-06-10days on market $234,000 Active 29 DOM
-
2026-06-09days on market $234,000 Active 28 DOM
-
2026-06-08days on market $234,000 Active 27 DOM
-
2026-06-07days on market $234,000 Active 26 DOM
-
2026-06-03days on market $234,000 Active 22 DOM
-
2026-06-02days on market $234,000 Active 21 DOM
-
2026-06-01days on market $234,000 Active 20 DOM
-
2026-05-31days on market $234,000 Active 19 DOM
-
2026-05-12$234,000 Active 611-char remark
Show marketing remark (611 chars)
Income Producing Townhouse style Double on a corner lot with new roof and new insulated windows. Located in a Federal Opportunity Zone! Ideal for owner occupant as this property lives like 2 separate homes with totally separate entrances on different streets. Each unit has its own driveway parking. Both sides have open kitchens downstairs with living room, laundry closet, half bath and living room. Each unit has 2 large bedrooms upstairs and 1 full bathroom. The Laplace St side enjoys a large back yard with covered patio and gated parking for your boat or trailer. Long term tenants on the Pierre St side.
-
2026-04-30price $234,000
-
2026-04-30price $234,000
-
2026-01-19price $239,000
-
2026-01-19price $239,000
-
2025-11-10$249,000 Active
-
2021-01-04soldstatus $160,000
-
2020-12-30soldstatus $160,000 Closed
-
2020-11-30status Pending
-
2020-11-23$154,900
-
2020-11-23$154,900 Active
ⓘ Source: listings_history table (triggers on properties + properties_extension) + one-shot
backfill from property_details.listing_events for pre-trigger history.
Tax reassessment forecast LA · Resets to sale price
- Current annual tax
- $2,312 · $193/mo
- Projected year-2 tax
- $2,312 · $193/mo
- Expected delta
- $0/yr ($0/mo · 0.0%)
ⓘ Screening estimate from a state-policy table — verify with the county assessor before closing.
Climate risk First Street
- Flood 8/10 Severe FEMA zone AE · 76% chance over 30 yrs
- Wildfire 2/10 Low
- Heat 10/10 Extreme 7 d/yr ≥108°F today · 22 d/yr by 30 yrs out
- Wind 10/10 Extreme 99% chance of damaging wind over 30 yrs
- Air quality 3/10 Moderate 3 unhealthy d/yr today · 3 by 30 yrs out
Nearby sold comps map
Loading sold comps map…
Walkable amenities ~0.75 mi
Loading nearby amenities…
Taxation est. · year 1
- Rental income
- $25,265
- − Mortgage interest
- −$13,108
- − Property taxes
- −$2,312
- − Insurance
- −$6,289
- − Repairs & maintenance
- −$2,021
- − Management
- −$2,021
- − Depreciation
- −$6,807
- Taxable loss
- −$7,293
- Est. tax savings @ 24.0%
- +$1,750
- After-tax cash flow
- $-1,616/yr
For passive investors: Depreciation is non-cash, so a rental often shows a tax loss while cash-flowing — sheltering income. Rental losses are passive: they offset passive income freely, and up to $25,000/yr can offset ordinary (W-2) income if you actively participate and your MAGI is under $100k (phasing out to $0 by $150k); unused losses carry forward. On sale, claimed depreciation is recaptured at up to 25%, and gains may owe capital-gains tax (a 1031 exchange can defer both). Figures are a year-1 estimate at your 24.0% rate — not tax advice; consult a CPA.
Schools (NCES district)
No district data.
Livability — Chalmette
- Score
- 65/100
- State rank
- #137
- US rank
- #12500
Category grades
Schools grade is shown separately in the Schools card above.
Census & demographics
- Census place
- Chalmette, LA
- County
- Saint Bernard Parish · 22,638 people
- City population
- 22,638
- Metro
- New Orleans-Metairie, LA
- Population (ZIP)
- 22,638
- Household income
- $55,068
- Rent vs Own
- Severe rent burden
- 881.0
Population outlook (St. Bernard County) Hauer SSP2
- Today (2025)
- 66,513 people
- By 2030
- 77,768 · +16.9%
- By 2040
- 101,296 · +52.3%
- By 2050
- 125,770 · +89.1%
- By 2075
- 188,160 · +182.9%
- By 2100
- 239,339 · +259.8%
Race, ethnicity, and origin ACS 2023
- Neighborhood character
- Diverse neighborhood (Simpson 0.61)
- Race & ethnicity
- White 55% Black 26% Hispanic / Latino 12% Two or more races 10% Asian 2%
- Hispanic origin (detail)
- Mexican 2%
- Common ancestry
- Lithuanian 13% Slovak 2%
- Foreign-born
- 6% · Canada, Vietnam
- Languages at home
- 88% English-only · Spanish 8% Arabic 1% Vietnamese 1%
Political lean MEDSL · St. Bernard
- 2024 margin
- Strong R (+29.3) · D 34.5% · R 63.8% · Other 1.7%
- 2008→2024 swing
- +16.1pp toward D · 2008: -45.4pp · 2024: -29.3pp
- All cycles
- 2024: R+29.3 2020: R+28.5 2016: R+33.4 2012: R+24.7 2008: R+45.4
Not yet ingested
- Civics
- —
Market trends
- HPI YoY
- ▼ -211.77%
- Current HPI
- 194.8123
- Rent YoY
- ▲ 3.11%
- Metro
- New Orleans-Metairie, LA
- State GDP YoY
- ▲ 3.29%
- F500 in state
- 10
Industry mix (Fortune 500 HQ in LA)
| Industry | F500 HQs | Revenue |
|---|---|---|
| Telecommunications | 2 | $23B |
|
||
| Utilities | 1 | $12B |
|
||
| Wholesale / Distribution | 1 | $5B |
|
||
| Advertising | 1 | $2B |
|
||
Price history
+51.1% since first listed12 events — show timeline
- 2026-05-12 Listed $234,000 GSREIN
- 2026-05-12 Listed $234,000 AcadianaMLS
- 2026-04-30 Price Changed $234,000 AcadianaMLS
- 2026-04-30 Price Changed $234,000 GSREIN
- 2026-01-19 Price Changed $239,000 AcadianaMLS
- 2026-01-19 Price Changed $239,000 GSREIN
- 2025-11-10 Listed $249,000 AcadianaMLS
- 2021-01-04 Sold (Public Records) $160,000 Public Records
- 2020-12-30 Sold (MLS) $160,000 GSREIN
- 2020-11-30 Pending — GSREIN
- 2020-11-23 Listed $154,900 GSREIN
- 2020-11-23 Listed $154,900 AcadianaMLS
Property tax history
+5.5%/yrLatest (2025): $2,312 · -0.7% YoY. Source: county tax records.
Cash-flow waterfall
monthlySold comps — $/sqft
last 12 mo · ≤1 miLoading sold comps…