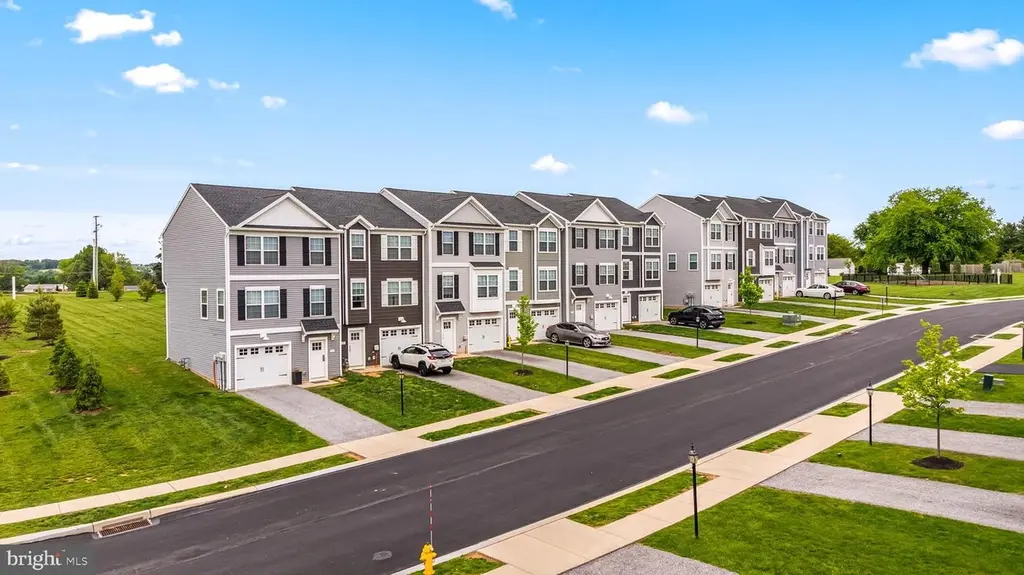
454 Bradford Dr · York, PA
Flood risk 1/10 · Minimal
- FEMA flood zone
- X (unshaded)
- Chance of flooding over 30 yrs
- 0.0%
- Est. flood insurance / yr
- $507 – $1,088
Fire risk 1/10 · Minimal
- Est. fire insurance / yr
- $511 – $949
Heat risk 5/10 · Moderate
- Hot days now (above 100°F)
- 7 days/yr
- Hot days in 30 yrs
- 15 days/yr
Wind risk 4/10 · Minor
- Chance of severe wind over 30 yrs
- 18.0%
Air-quality risk 3/10 · Minor
- Unhealthy air days now
- 2 days/yr
- Unhealthy air days in 30 yrs
- 5 days/yr
Risk factors via First Street. Map © Google.
Why this score? — see what drove the D- grade
The composite is a weighted blend of 9 inputs, each scored 0–100. Each bar is that input's sub-score; the figure is the points it added to the 100-point composite (weight × sub-score).
- Cash flow +11.7/30.0
- ARV discount +7.8/15.0
- Schools +4.8/10.0
- Livability +3.8/5.0
- DSCR +3.5/10.0
- Rent growth +2.5/5.0
- Condition / age +2.5/5.0
- 1% rule +2.2/10.0
- Appreciation +0.0/10.0
$279,900
🖨 Deal sheet 📄 Offer letter ✓ Due diligence
Listing remarks
Inquire for incentives * Welcome home to 454 Bradford Dr in Red Lion PA! Located in the Hudson Ridge community within the Dallastown Area School District, this newly constructed interior townhome offers approximately 1,720 square feet of modern living space with quick move-in opportunities available, as well as additional to-be-built options. Designed with a bright, open layout and 9+ foot ceilings throughout, this 3 bedroom, 2.5 bath home combines functionality, natural light and contemporary finishes in a convenient location. The main living level features an open floor plan connecting the kitchen, dining and living areas. The kitchen is equipped with granite countertops, an island, buil
Key facts
- Open floor plan
- Optional rear deck
- Granite countertops
Tags
Property features AI
Finance
- HOA & community: HOA fee of $25 monthly; HOA covers common area maintenance
Exterior
- Parking: Attached front-entry garage with inside access and garage door opener (1-car); Asphalt driveway with 2 additional spaces; Total of 3 garage/parking spaces; Off-street parking available
- Utilities: Public water; Public sewer; Electric hot water
- Home design: Interior townhouse/rowhouse; Fee simple ownership; Property in excellent to very good condition; Construction not completed (builder: Burkentine Builders)
- Construction: Vinyl siding, stick-built construction; Architectural shingle roof; Slab foundation; Above-grade structure
- Exterior features: Not in a federal flood zone; Pets allowed (cats and dogs)
Interior
- Kitchen: Built-in microwave; Dishwasher; Electric oven/range; Stainless steel appliances
- Bedrooms: Three bedrooms on upper level; Entry-level bedroom
- Flooring: Luxury vinyl plank; Carpet
- Bathrooms: Two full bathrooms (upper level); One half bathroom
- Heating & cooling: Forced air heating (natural gas); Central air conditioning
- Interior features: Open floor plan; Breakfast area; Kitchen island; Pantry; Recessed lighting; Upgraded countertops; Walk-in closets; Ceiling fans; Sliding glass door; Walk-in shower; Tub/shower combination; 9'+ and cathedral ceilings; Sprinkler system
- Laundry & utility: Washer/dryer hookups (upper floor)
Neighborhood map
What this means for you Summary
Snapshot
- This is a 3-bed/2.5-bath townhouse listed at $280k.
Deal economics
- At list price, monthly cash flow is $-80 ($-958/yr) — negative.
- To cash-flow at today's rent, offer at most $266k (5.0% below list).
- To meet the 1% rule (rent ≥ 1% of price), the offer needs to be $202k (27.9% below list).
- Recommended offer: $202k (27.9% below list) — sets the bar for 1% rule.
Location & tenants
- Location reads 75/100 on livability (#427 in PA, #3,987 nationally) — a middle-class / working-renter tenant base. Strengths: cost of living A+, health & safety A+, housing A; Watch: amenities D+, crime F, employment F.
- Dallastown Area SD (suburban): math 47% / reading 63% proficiency, ranked #102 of 539 in PA (top 19%) — acceptable for families but not a draw, mixed tenant base, ~2y average lease.
- Zoned schools: Dallastown Area Ms (math 30% / reading 55%, grade D-, #216 of 512 statewide, top 43%, 1,027 students, 34% FRL); Dallastown Area Shs (math 71% / reading 24%, grade D, #164 of 437 statewide, top 38%, 2,014 students, 33% FRL).
- Market conditions: 147 active listings in the ZIP; 8 comparable units currently listed for rent nearby; rentals at typical pace (median 21d on market — plan ~3-4 weeks tenant-placement turnaround); solid renter incomes; 1,328 units permitted in York County in 2024 (338 in 5+ unit buildings).
Forward outlook
- Local home prices are declining (-3.0%/yr); year-one equity from $2k of loan paydown is wiped out by about $8k of value loss. Plan a longer hold.
Negotiation context
- It's been on market 21 days — a 2% lower offer ($276k) is reasonable based on typical stale-listing flexibility.
Risks & watch-outs
- Climate carrying-cost: extreme-heat days projected 7→15/yr by 2055 (HVAC capex compounding) — expect insurance premiums to compound above CPI over the hold.
Questions for the listing agent
- What do current leases actually rent for vs. the listed asking? Can we see a recent rent roll and the last 12 months of T-12 income?
- What does the HOA fee cover, when was the last increase, and are there any pending special assessments or reserve-fund shortfalls?
- Is there a deadline driving the sale (1031 exchange, divorce, estate, relocation)? That informs how much negotiation room exists.
- Crime grade is F in this area — have there been break-ins, vandalism, or insurance claims at this property in the last 3 years? What carrier currently insures it and at what premium?
- The area grade is low — what's the realistic commute time and amenity access for the typical tenant pool here? Any planned neighborhood developments (good or bad) we should know about?
- What's the average days-on-market for RENTAL listings here right now (not sales)? A rising rental-DOM trend means longer vacancies and softer asking-rent achievability than the comps imply.
- What's the recent tenant-quality profile in this submarket — average credit score on applications, eviction rate, late-payment / NSF rate, and stable-employment percentage? A property-management company in the area should have these aggregated.
- How much new for-sale + rental construction is in the pipeline within 1–3 miles? Heavy new supply typically softens prices + rents 12–24 months out; constrained supply supports both.
Investment metrics
- 1% rule
- 0.72% ✗
- Cap rate
- 5.95%
- Cash-on-cash
- -1.22%
- DSCR
- 0.95
- GRM
- 11.6
CMA / ARV
- ARV (on-the-fly)
- $282,080
- Comps found
- 12
Show comp detail 12 sales within ~0.75 mi
| Address | Dist | Beds/Ba | Sqft | Sold | Price | $/sf | Match |
|---|---|---|---|---|---|---|---|
| 442 Bradford Dr #56 | 0.03mi | 3/3.0 | 1,720 (0%) | 2mo | $276,400 | $161 | 96 |
| 438 Bradford Dr #58 | 0.03mi | 3/3.0 | 1,720 (0%) | 2mo | $289,300 | $168 | 95 |
| 435 Bradford Dr #187 | 0.05mi | 3/2.5 | 1,720 (0%) | 5mo | $274,900 | $160 | 94 |
| 439 Bradford Dr #185 | 0.05mi | 3/2.5 | 1,720 (0%) | 6mo | $286,500 | $167 | 93 |
| 443 Bradford Dr #183 | 0.04mi | 4/3.5 (+1) | 1,720 (0%) | 1mo | $314,700 | $183 | 89 |
| 320 Avon Dr | 0.19mi | 3/2.5 | 1,700 (-1%) | 2mo | $290,000 | $171 | 88 |
| 246 Hudson Blvd | 0.22mi | 3/2.5 | 1,810 (+5%) | 0mo | $291,000 | $161 | 81 |
| 444 Bradford Dr #55 | 0.02mi | 3/3.0 | 1,900 (+10%) | 0mo | $307,150 | $162 | 79 |
| 350 Avon Dr #270 | 0.13mi | 3/2.5 | 1,900 (+10%) | 4mo | $299,900 | $158 | 73 |
| 433 Bradford Dr #188 | 0.06mi | 4/3.5 (+1) | 1,900 (+10%) | 5mo | $326,500 | $172 | 67 |
| 169 Jonathan Way N | 0.49mi | 4/1.5 (+1) | 1,778 (+3%) | 3mo | $240,000 | $135 | 60 |
| 10 Steeple Ave | 0.55mi | 3/2.5 | 1,464 (-15%) | 4mo | $239,900 | $164 | 46 |
Match score weights: distance 35% · size 25% · config 20% · recency 20%. Top-matched comps best support the ARV.
Projected returns pro-forma
-3.0% appreciation · 3.0% rent growth · sell at horizon
- IRR
- -18.4%
- Equity multiple
- 0.35×
- Total profit
- $-50,569
- Equity at exit
- $41,734
- IRR
- -10.8%
- Equity multiple
- 0.35×
- Total profit
- $-51,106
- Equity at exit
- $24,201
Cash invested: $78,372 (down + closing). Projections, not guarantees.
Landlord ↔ Tenant lean methodology
- Overall (STATE)
- 62 Landlord-Friendly
- State Pennsylvania
- 62 Landlord-Friendly · EVEN
- County
- — inherits STATE
- City
- — inherits STATE
ZIP-level market 17356
- Home prices YoY
- -21.0%
- Active inventory
- 147
- Price-to-rent
- 11.6×
Monthly cashflow live
- Estimated rent
- $2,019 high interval (Pro) →
- Mortgage (P&I)
- −$1,468
- Tax from tax record
- −$65 /mo · $782/yr
- Insurance
- −$117
- HOA
- −$25
- Vacancy / Maint / Mgmt
- −$424
- Net cashflow
- $-80
Break-even live
UW: 25.0% down · 7.5% · 30yr · 1.5% tax · 5.0% vac · 8.0% maint · 8.0% mgmt
Financing live
Cash to close
- Down payment
- $69,975
- Closing costs
- $8,397
- Reserves months
- —
- Total cash needed
- —
Loan-product check · same deal, 3 products live
Conventional
25% down · 7.5% · 30yr
- Down + closing
- —
- Monthly P&I
- —
- Monthly cashflow
- —
- DSCR
- —
- Eligible?
- —
Personal DTI + credit; lowest rate.
DSCR
20% down · 8.5% · 30yr
- Down + closing
- —
- Monthly P&I
- —
- Monthly cashflow
- —
- DSCR
- —
- Eligible?
- —
No personal income docs; deal must DSCR.
Hard money
10% down · 12.0% · 12mo
- Down + closing
- —
- Monthly P&I
- —
- Monthly cashflow
- —
- DSCR
- —
- Eligible?
- —
Short-term bridge; refi at stabilization.
Rent comps 8 comps
| Address | Beds | Baths | Sqft | Rent | $/sqft | DOM | Units | Dist |
|---|---|---|---|---|---|---|---|---|
| 321 Avon Dr Red Lion, PA | 3.0 | 2.5 | 1720 | $2,050 | $1.19 | 43d | 1 | 0.16mi |
| 259 Stratford Dr Red Lion, PA | 4.0 | 2.5 | 1625 | $2,250 | $1.38 | 43d | 1 | 0.22mi |
| 406 Valor Way Red Lion, PA | 3.0 | 2.5 | 1252 | $1,875 | $1.50 | 21d | 1 | 0.23mi |
| 224 Sienna Ln Yoe, PA | 3.0 | 2.5 | 1252 | $1,979 | $1.58 | 21d | 1 | 0.31mi |
| 66 Cadbury Dr Red Lion, PA | 4.0 | 2.5 | 1625 | $2,250 | $1.38 | 13d | 1 | 0.33mi |
| 198 Cadbury Dr Red Lion, PA | 4.0 | 2.5 | 1625 | $2,250 | $1.38 | 13d | 1 | 0.36mi |
| 306 Orchard Ct Red Lion, PA | 2.0 | 1.5 | 1300 | $1,495 | $1.15 | 21d | 1 | 0.76mi |
| 21 Windsor Way Red Lion, PA | 3.0 | 2.0–2.5 | 1385 | $2,150 | $1.55 | 13d | 8 | 0.90mi |
HOA detail
- Monthly dues
- $25 · $300/yr
Listing history 16 events
-
2026-06-18days on market $279,900 Active 21 DOM
-
2026-06-17days on market $279,900 Active 20 DOM
-
2026-06-16days on market $279,900 Active 19 DOM
-
2026-06-15days on market $279,900 Active 18 DOM
-
2026-06-14days on market $279,900 Active 16 DOM
-
2026-06-13days on market $279,900 Active 15 DOM
-
2026-06-10days on market $279,900 Active 13 DOM
-
2026-06-09days on market $279,900 Active 12 DOM
-
2026-06-08days on market $279,900 Active 11 DOM
-
2026-06-07days on market $279,900 Active 10 DOM
-
2026-06-03days on market $279,900 Active 6 DOM
-
2026-06-02days on market $279,900 Active 5 DOM
-
2026-06-01days on market $279,900 Active 4 DOM
-
2026-05-31days on market $279,900 Active 3 DOM
-
2026-05-30days on market $279,900 Active 2 DOM
-
2026-05-28$279,900 Active
ⓘ Source: listings_history table (triggers on properties + properties_extension) + one-shot
backfill from property_details.listing_events for pre-trigger history.
Tax reassessment forecast PA · Partial reset (capped growth)
- Current annual tax
- $782 · $65/mo
- Projected year-2 tax
- $2,602 · $217/mo
- Expected delta
- +$1,820/yr (+$152/mo · 232.9%)
ⓘ Screening estimate from a state-policy table — verify with the county assessor before closing.
Climate risk First Street
- Flood 1/10 Low FEMA zone X (unshaded) · 0% chance over 30 yrs
- Wildfire 1/10 Low
- Heat 5/10 Major 7 d/yr ≥100°F today · 15 d/yr by 30 yrs out
- Wind 4/10 Moderate 18% chance of damaging wind over 30 yrs
- Air quality 3/10 Moderate 2 unhealthy d/yr today · 5 by 30 yrs out
Nearby sold comps map
Loading sold comps map…
Walkable amenities ~0.75 mi
Loading nearby amenities…
Taxation est. · year 1
- Rental income
- $24,224
- − Mortgage interest
- −$15,679
- − Property taxes
- −$782
- − Insurance
- −$1,400
- − Repairs & maintenance
- −$1,938
- − Management
- −$1,938
- − HOA
- −$300
- − Depreciation
- −$8,143
- Taxable loss
- −$5,954
- Est. tax savings @ 24.0%
- +$1,429
- After-tax cash flow
- $471/yr
For passive investors: Depreciation is non-cash, so a rental often shows a tax loss while cash-flowing — sheltering income. Rental losses are passive: they offset passive income freely, and up to $25,000/yr can offset ordinary (W-2) income if you actively participate and your MAGI is under $100k (phasing out to $0 by $150k); unused losses carry forward. On sale, claimed depreciation is recaptured at up to 25%, and gains may owe capital-gains tax (a 1031 exchange can defer both). Figures are a year-1 estimate at your 24.0% rate — not tax advice; consult a CPA.
Schools (NCES district)
- District
- Dallastown Area SD
- NCES district ID
- 4207230
- Math proficiency
- 47% ▼ -5.00%
- Reading proficiency
- 63% ▼ -9.00%
- Median HH income
- $61,805
- Composite
- 48.0/100
- National rank
- #2199
- State rank
- #102 of 539 in PA
Livability — York
- Score
- 75/100
- State rank
- #427
- US rank
- #3987
Category grades
Schools grade is shown separately in the Schools card above.
Census & demographics
- County
- York County · 278,806 people
- City population
- 184,764
- Metro
- York-Hanover, PA
- Population (ZIP)
- 22,869
- Household income
- $86,561
- Rent vs Own
- Severe rent burden
- 559.0
Population outlook (York County) Hauer SSP2
- Today (2025)
- 454,205 people
- By 2030
- 457,407 · +0.7%
- By 2040
- 457,529 · +0.7%
- By 2050
- 448,261 · -1.3%
- By 2075
- 427,388 · -5.9%
- By 2100
- 384,218 · -15.4%
Race, ethnicity, and origin ACS 2023
- Neighborhood character
- Predominantly White (89%)
- Race & ethnicity
- White 89% Black 4% Two or more races 4% Asian 2% Hispanic / Latino 2%
- Common ancestry
- Romanian 3% Slovak 3% Serbian 2%
- Foreign-born
- 4% · China
- Languages at home
- 95% English-only · Russian/Polish/Slavic 1% Chinese 1% Other Indo-European 1%
Political lean MEDSL · York
- 2024 margin
- Strong R (+25.3) · D 36.9% · R 62.1%
- 2008→2024 swing
- -11.7pp toward R · 2008: -13.6pp · 2024: -25.3pp
- All cycles
- 2024: R+25.3 2020: R+24.6 2016: R+29.3 2012: R+21.2 2008: R+13.6
Not yet ingested
- Civics
- —
Market trends
- HPI YoY
- ▼ -69.16%
- Current HPI
- 259.7294
- Rent YoY
- —
- Metro
- York-Hanover, PA
- State GDP YoY
- ▲ 1.68%
- F500 in state
- 34
Industry mix (Fortune 500 HQ in PA)
| Industry | F500 HQs | Revenue |
|---|---|---|
| Healthcare | 2 | $309B |
|
||
| Insurance | 2 | $27B |
|
||
| Telecommunications / Media | 1 | $124B |
|
||
| Industrial Distribution | 1 | $22B |
|
||
| Financial Services | 1 | $20B |
|
||
| Chemicals / Materials | 1 | $18B |
|
||
Price history
1 event — show timeline
- 2026-05-28 Listed $279,900 BRIGHT MLS
Cash-flow waterfall
monthlySold comps — $/sqft
last 12 mo · ≤1 miLoading sold comps…