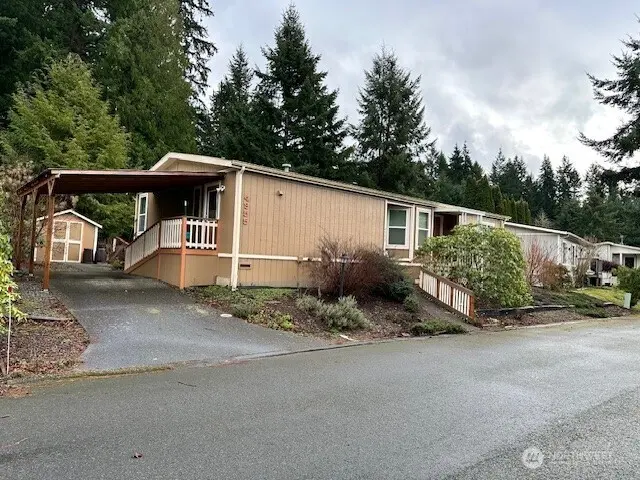
4955 Wheel Dr · Langley, WA
Flood risk 1/10 · Minimal
- FEMA flood zone
- X (unshaded)
- Chance of flooding over 30 yrs
- 0.0%
- Est. flood insurance / yr
- $507 – $1,088
Fire risk 3/10 · Minor
- Est. fire insurance / yr
- $604 – $1,122
Heat risk 2/10 · Minimal
- Hot days now (above 84°F)
- 8 days/yr
- Hot days in 30 yrs
- 18 days/yr
Wind risk 1/10 · Minimal
- Chance of severe wind over 30 yrs
- —
Air-quality risk 6/10 · Moderate
- Unhealthy air days now
- 8 days/yr
- Unhealthy air days in 30 yrs
- 9 days/yr
Risk factors via First Street. Map © Google.
Why this score? — see what drove the C+ grade
The composite is a weighted blend of 9 inputs, each scored 0–100. Each bar is that input's sub-score; the figure is the points it added to the 100-point composite (weight × sub-score).
- Cash flow +30.0/30.0
- DSCR +10.0/10.0
- 1% rule +7.7/10.0
- Schools +5.0/10.0
- Livability +4.0/5.0
- Rent growth +2.5/5.0
- Condition / age +2.5/5.0
- ARV discount +1.4/15.0
- Appreciation +0.0/10.0
$219,000
🖨 Deal sheet (PDF) 📄 Offer letter ✓ Due diligence
Listing remarks
Enjoy the comfort of living in a 55+ community in a 3 bd, 2 full bath home with many updated features. Open living rm, eating/ dining area and kitchen with eating bar. Free standing wood stove / w/ w carpet w/ vinyl in kitchen, baths and utility room. Ramp from carport to the back utility door entrance, living room sliders to back deck & small porch at front entrance. New paint inside and out in 2016 windows and some new appliances in 2017, roof 2018 & water heater in 2022. Monthly land rental fee includes the taxes on the lot plus water & septic which is inspected yearly. Road maintenance, dumpster for trash, mailbox. book lending spot and a community park with gazebo and
Key facts
- Green area
- Gazebo
- Community park
Tags
Neighborhood map
What this means for you Summary
Snapshot
- This is a 3-bed/2.0-bath manufactured listed at $219k.
Deal economics
- At list price, monthly cash flow is $878 ($11k/yr) — positive.
- The deal already cash-flows at list — no discount required.
- Meets the 1% rule at list price ($3k rent vs $219k).
- Recommended offer: $193k (12.0% below list) — sets the bar for market timing.
- Cap rate 11.1% vs local median 1.3% in Langley — top-decile yield for the area; either an underpriced asset or a hidden risk that comps aren't pricing in. Stress-test before assuming the spread holds.
Location & tenants
- Location reads 80/100 on livability (#88 in WA, #1,696 nationally) — a professional / high-income tenant draw. Strengths: crime A+, amenities A+, commute A+; Watch: cost of living F.
- South Whidbey School District (rural): math 47% / reading 64% proficiency, ranked #87 of 291 in WA (top 30%) — acceptable for families but not a draw, mixed tenant base, ~2y average lease.
- Market conditions: 95 active listings in the ZIP; solid renter incomes; 402 units permitted in Island County in 2024 (54 in 5+ unit buildings).
- This rent runs 33% of the median local income ($102k/yr) — at the standard rent-burdened threshold; future hikes will face affordability resistance.
Forward outlook
- Local home prices are declining (-3.0%/yr); year-one equity from $2k of loan paydown is wiped out by about $7k of value loss. Plan a longer hold.
- Island County population projected to shrink 6% by 2050 — rents likely to lag national; underwrite the cash flow, not the appreciation.
- At projected returns (-3.0% appreciation + 3.0% rent growth), your $61k cash investment doubles in ~7 years — after that, you're playing with house money.
Negotiation context
- It's been on market 161 days — a 12% lower offer ($193k) is reasonable based on typical stale-listing flexibility.
- Current owner paid $72k; list at $219k implies a 202% gain — meaningful room to come down on a strong offer.
Questions for the listing agent
- It's been on market 161 days. Have you received any prior offers? Is the seller open to a 12% concession, seller financing, or rate buy-down credit?
- Why hasn't it sold? Are there any deal-killer items the seller is aware of (foundation, flood, title, zoning, code violations)?
- Is there a deadline driving the sale (1031 exchange, divorce, estate, relocation)? That informs how much negotiation room exists.
- Schools are B-rated — typically a magnet for longer-tenancy family renters. What's the average tenant stay here, and is there a school-zone premium baked into asking?
- What's the average days-on-market for RENTAL listings here right now (not sales)? A rising rental-DOM trend means longer vacancies and softer asking-rent achievability than the comps imply.
- What's the recent tenant-quality profile in this submarket — average credit score on applications, eviction rate, late-payment / NSF rate, and stable-employment percentage? A property-management company in the area should have these aggregated.
- How much new for-sale + rental construction is in the pipeline within 1–3 miles? Heavy new supply typically softens prices + rents 12–24 months out; constrained supply supports both.
Investment metrics
- 1% rule
- 1.27% ✓
- Cap rate
- 11.10%
- Cash-on-cash
- 17.18%
- DSCR
- 1.76
- GRM
- 6.6
CMA / ARV
- ARV (median comp)
- $193,000
- List price
- $219,000
- Delta
- 13.47%
- Verdict
- OVERPRICED
- Comps
- 2 within 1.0 mi
Show comp detail 2 sales within ~0.75 mi
| Address | Dist | Beds/Ba | Sqft | Sold | Price | $/sf | Match |
|---|---|---|---|---|---|---|---|
| 4958 Wheel Dr | 0.00mi | 2/2.0 (-1) | 1,120 (-9%) | 2mo | $206,000 | $184 | 78 |
| 4973 Wheel Dr | 0.09mi | 2/2.0 (-1) | 1,323 (+8%) | 14mo | $227,500 | $172 | 66 |
Match score weights: distance 35% · size 25% · config 20% · recency 20%. Top-matched comps best support the ARV.
Projected returns pro-forma
-3.0% appreciation · 3.0% rent growth · sell at horizon
- IRR
- 8.5%
- Equity multiple
- 1.33×
- Total profit
- $20,345
- Equity at exit
- $32,654
- IRR
- 17.7%
- Equity multiple
- 2.46×
- Total profit
- $89,396
- Equity at exit
- $18,935
Cash invested: $61,320 (down + closing). Projections, not guarantees.
Landlord ↔ Tenant lean methodology
- Overall (STATE)
- 28 Tenant-Leaning
- State Washington
- 28 Tenant-Leaning · D+8
- County
- — inherits STATE
- City
- — inherits STATE
ZIP-level market 98260
- Active inventory
- 95
- Price-to-rent
- 6.6×
Monthly cashflow live
- Estimated rent
- $2,783 medium interval (Pro) →
- Mortgage (P&I)
- −$1,148
- Tax from tax record
- −$81 /mo · $970/yr
- Insurance
- −$91
- HOA
- −$0
- Vacancy / Maint / Mgmt
- −$584
- Net cashflow
- $878
Break-even live
Sensitivity live
| Price | -10% $1,002 | -5% $940 | +0% $878 | +5% $816 | +10% $754 |
|---|---|---|---|---|---|
| Rent | -10% $658 | -5% $768 | +0% $878 | +5% $988 | +10% $1,098 |
| Rate | -1.0pp $988 | -0.5pp $934 | base $878 | +0.5pp $821 | +1.0pp $763 |
UW: 25.0% down · 7.5% · 30yr · 1.5% tax · 5.0% vac · 8.0% maint · 8.0% mgmt
Financing live
Cash to close
- Down payment
- $54,750
- Closing costs
- $6,570
- Reserves months
- —
- Total cash needed
- —
Loan-product check · same deal, 3 products live
Conventional
25% down · 7.5% · 30yr
- Down + closing
- —
- Monthly P&I
- —
- Monthly cashflow
- —
- DSCR
- —
- Eligible?
- —
Personal DTI + credit; lowest rate.
DSCR
20% down · 8.5% · 30yr
- Down + closing
- —
- Monthly P&I
- —
- Monthly cashflow
- —
- DSCR
- —
- Eligible?
- —
No personal income docs; deal must DSCR.
Hard money
10% down · 12.0% · 12mo
- Down + closing
- —
- Monthly P&I
- —
- Monthly cashflow
- —
- DSCR
- —
- Eligible?
- —
Short-term bridge; refi at stabilization.
Listing history 20 events
-
2026-06-19days on market $219,000 Active 161 DOM
-
2026-06-18days on market $219,000 Active 160 DOM
-
2026-06-17days on market $219,000 Active 159 DOM
-
2026-06-16days on market $219,000 Active 158 DOM
-
2026-06-15days on market $219,000 Active 157 DOM
-
2026-06-14days on market $219,000 Active 155 DOM
-
2026-06-13days on market $219,000 Active 154 DOM
-
2026-06-10days on market $219,000 Active 152 DOM
-
2026-06-09days on market $219,000 Active 151 DOM
-
2026-06-08days on market $219,000 Active 150 DOM
-
2026-06-07days on market $219,000 Active 149 DOM
-
2026-06-05days on market $219,000 Active 146 DOM
-
2026-06-02days on market $219,000 Active 144 DOM
-
2026-06-01days on market $219,000 Active 143 DOM
-
2026-05-31days on market $219,000 Active 142 DOM
-
2026-05-30days on market $219,000 Active 141 DOM
-
2026-04-24price $219,000
-
2026-01-09$230,000 Active
-
2000-09-01soldstatus $72,500
-
1986-12-01soldstatus $39,734
ⓘ Source: listings_history table (triggers on properties + properties_extension) + one-shot
backfill from property_details.listing_events for pre-trigger history.
Tax reassessment forecast WA · Resets to sale price
- Current annual tax
- $970 · $81/mo
- Projected year-2 tax
- $2,146 · $179/mo
- Expected delta
- +$1,177/yr (+$98/mo · 121.4%)
ⓘ Screening estimate from a state-policy table — verify with the county assessor before closing.
Climate risk First Street
- Flood 1/10 Low FEMA zone X (unshaded) · 0% chance over 30 yrs
- Wildfire 3/10 Moderate
- Heat 2/10 Low 8 d/yr ≥84°F today · 18 d/yr by 30 yrs out
- Wind 1/10 Low
- Air quality 6/10 Major 8 unhealthy d/yr today · 9 by 30 yrs out
Nearby sold comps map
Loading sold comps map…
Walkable amenities ~0.75 mi
Loading nearby amenities…
Taxation est. · year 1
- Rental income
- $33,392
- − Mortgage interest
- −$12,267
- − Property taxes
- −$970
- − Insurance
- −$1,095
- − Repairs & maintenance
- −$2,671
- − Management
- −$2,671
- − Depreciation
- −$6,371
- Taxable income
- $7,347
- Est. tax owed @ 24.0%
- −$1,763
- After-tax cash flow
- $8,771/yr
For passive investors: Depreciation is non-cash, so a rental often shows a tax loss while cash-flowing — sheltering income. Rental losses are passive: they offset passive income freely, and up to $25,000/yr can offset ordinary (W-2) income if you actively participate and your MAGI is under $100k (phasing out to $0 by $150k); unused losses carry forward. On sale, claimed depreciation is recaptured at up to 25%, and gains may owe capital-gains tax (a 1031 exchange can defer both). Figures are a year-1 estimate at your 24.0% rate — not tax advice; consult a CPA.
Schools (NCES district)
- District
- South Whidbey School District
- NCES district ID
- 5308190
- Math proficiency
- 47% ▲ 2.00%
- Reading proficiency
- 64% ▲ 4.00%
- Median HH income
- $62,601
- Composite
- 50.31/100
- National rank
- #4050
- State rank
- #87 of 291 in WA
Livability — Langley
- Score
- 80/100
- State rank
- #88
- US rank
- #1696
Category grades
Schools grade is shown separately in the Schools card above.
Census & demographics
- County
- Island County · 71,196 people
- City population
- 5,320
- Metro
- Oak Harbor, WA
- Population (ZIP)
- 5,320
- Household income
- $101,987
- Rent vs Own
- Severe rent burden
- 152.0
Population outlook (Island County) Hauer SSP2
- Today (2025)
- 82,019 people
- By 2030
- 81,329 · -0.8%
- By 2040
- 78,552 · -4.2%
- By 2050
- 77,042 · -6.1%
- By 2075
- 80,799 · -1.5%
- By 2100
- 84,451 · +3.0%
Race, ethnicity, and origin ACS 2023
- Neighborhood character
- Predominantly White (89%)
- Race & ethnicity
- White 89% Two or more races 6% Asian 3% Hispanic / Latino 2%
- Common ancestry
- Portuguese 9% Slovak 7% Lithuanian 5%
- Foreign-born
- 4% · Canada, South Korea, Vietnam
- Languages at home
- 97% English-only · Spanish 2% Other Indo-European 1% Other Asian/Pacific 1%
Political lean MEDSL · Island
- 2024 margin
- D (+16.6) · D 56.8% · R 40.3% · Other 2.9%
- 2008→2024 swing
- +10.3pp toward D · 2008: 6.2pp · 2024: 16.6pp
- All cycles
- 2024: D+16.6 2020: D+12.0 2016: D+5.9 2012: D+4.4 2008: D+6.2
Not yet ingested
- Civics
- —
Market trends
- HPI YoY
- ▼ -370.15%
- Current HPI
- 211.9851
- Rent YoY
- —
- Metro
- Oak Harbor, WA
- State GDP YoY
- ▲ 4.65%
- F500 in state
- 22
Industry mix (Fortune 500 HQ in WA)
| Industry | F500 HQs | Revenue |
|---|---|---|
| Retail | 2 | $269B |
|
||
| Technology / Retail | 1 | $638B |
|
||
| Technology | 1 | $245B |
|
||
| Telecommunications | 1 | $38B |
|
||
| Food / Beverage | 1 | $36B |
|
||
| Automotive / Trucks | 1 | $34B |
|
||
Price history
+451.2% since first listed4 events — show timeline
- 2026-04-24 Price Changed $219,000 NWMLS as Distributed by MLS Grid
- 2026-01-09 Listed $230,000 NWMLS as Distributed by MLS Grid
- 2000-09-01 Sold (Public Records) $72,500 Public Records
- 1986-12-01 Sold (Public Records) $39,734 Public Records
Property tax history
+6.0%/yrLatest (2026): $970 · +6.8% YoY. Source: county tax records.
Cash-flow waterfall
monthlySold comps — $/sqft
last 12 mo · ≤1 miLoading sold comps…