4 Lakewood Ln · Quogue, NY
Flood risk 1/10 · Minimal
- FEMA flood zone
- X (unshaded)
- Chance of flooding over 30 yrs
- 0.0%
- Est. flood insurance / yr
- $473 – $860
Fire risk 2/10 · Minimal
- Est. fire insurance / yr
- $691 – $1,283
Heat risk 4/10 · Minor
- Hot days now (above 90°F)
- 7 days/yr
- Hot days in 30 yrs
- 19 days/yr
Wind risk 8/10 · Major
- Chance of severe wind over 30 yrs
- 80.0%
Air-quality risk 2/10 · Minimal
- Unhealthy air days now
- 2 days/yr
- Unhealthy air days in 30 yrs
- 2 days/yr
Risk factors via First Street. Map © Google.
Why this score? — see what drove the D+ grade
The composite is a weighted blend of 9 inputs, each scored 0–100. Each bar is that input's sub-score; the figure is the points it added to the 100-point composite (weight × sub-score).
- Cash flow +12.5/30.0
- ARV discount +7.5/15.0
- Appreciation +7.0/10.0
- Schools +6.6/10.0
- DSCR +3.7/10.0
- 1% rule +3.6/10.0
- Livability +3.4/5.0
- Rent growth +2.5/5.0
- Condition / age +2.5/5.0
$2,495,000
🖨 Deal sheet (PDF) 📄 Offer letter ✓ Due diligence
Listing remarks
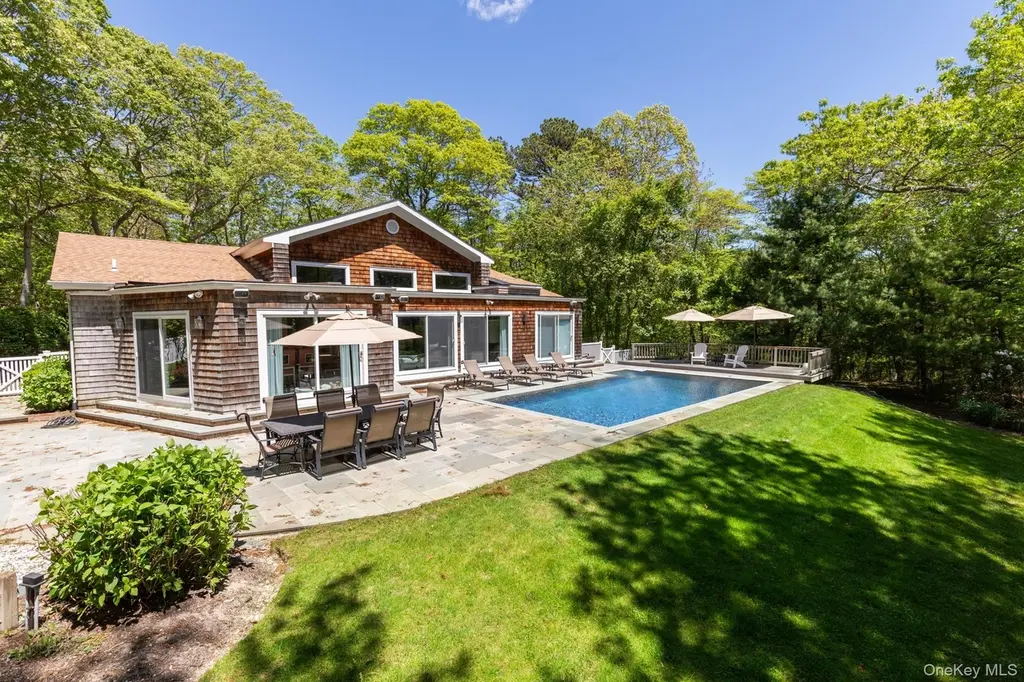
Tucked away on a quiet lane in Quogue, this single-level home gives you the perfect mix of privacy, simplicity, and amazing outdoor space on a full acre. Hitting the market for the first time, the house spans over 2,250 square feet and features an easy, open layout. The living, dining, and kitchen areas flow effortlessly to the outdoors, intimate evenings or larger gatherings. All three bedrooms are on the main floor, including a primary suite with its own bath and peaceful views of the property. The finished lower level adds extra flexible space—perfect for a media room, home gym, or extra guest accommodations. Step outside, and you’ll find the pool at the heart of a beautifull
Key facts
- Outdoor space
- Finished lower level
- 1.03 acre lot
Tags
Property features AI
Exterior
- Parking: Private driveway
- Utilities: Electric service by PSEG; Cesspool sewage; Cable connected; Electricity connected; Phone connected; Sewer connected; Trash collection (private); Underground utilities; Water connected; Backup generator
- Home design: Single family residence; One level
- Construction: Cedar, frame, and shake siding construction; Year built not provided
- Exterior features: Private yard with front and back landscaping; Sprinklers front and rear; Partially wooded / private wooded setting; Near golf course and shops; Rain gutters; Outdoor speakers; Private in-ground vinyl pool
Interior
- Kitchen: Dishwasher; Electric range / oven / range; Microwave; Refrigerator; Wine refrigerator; Pantry; Breakfast bar; Eat-in kitchen; Open kitchen
- Bedrooms: Bedroom on first floor
- Flooring: Carpet; Ceramic tile; Hardwood
- Bathrooms: 3 full bathrooms
- Heating & cooling: Baseboard heating (oil); Central air conditioning
- Interior features: First-floor bedroom; First-floor full bath; Breakfast bar; Built-in features; Cathedral ceilings; Ceiling fans; Central vacuum; Eat-in kitchen; Entrance foyer; High ceilings; Open floorplan; Open kitchen; Pantry; Primary bathroom; Recessed lighting; Sound system with speakers; Walk-in closets; Washer/dryer hookup; Finished walk-out basement
- Laundry & utility: Washer; Washer/dryer hookup; Oil water heater
Neighborhood map
What this means for you Summary
Snapshot
- This is a 3-bed/3.0-bath single-family listed at $2.50M.
Deal economics
- At list price, monthly cash flow is $-367 ($-4k/yr) — negative.
- To cash-flow at today's rent, offer at most $2.44M (2.1% below list).
- To meet the 1% rule (rent ≥ 1% of price), the offer needs to be $2.14M (14.4% below list).
- Recommended offer: $2.14M (14.4% below list) — sets the bar for 1% rule.
Location & tenants
- Location reads 67/100 on livability (#600 in NY) — a middle-class / working-renter tenant base. Strengths: crime A+, employment A+, health & safety B+; Watch: amenities F, commute F, cost of living F.
- Quogue Union Free School District (suburban): math 70% / reading 80% proficiency, ranked #125 of 755 in NY (top 17%) — strong family-tenant draw, lease renewals of 3-5y typical; only 4% free/reduced lunch — higher-income household profile.
- Zoned schools: Quogue Elementary School (math 87% / reading 92%, grade A+, #45 of 2,108 statewide, top 3%, 84 students, 0% FRL) — zoned schools at 0% FRL track the district average.
- Zoned-school proficiency averages 90% at this address vs 75% district-wide (+14 pts) — the actual schools serving this property are materially stronger than the Quogue Union Free School District average implies; a family-tenant draw the district grade alone would hide.
- Market conditions: 37 active listings in the ZIP; 14 comparable units currently listed for rent nearby; rentals at typical pace (median 27d on market — plan ~3-4 weeks tenant-placement turnaround); 1,366 units permitted in Suffolk County in 2024 (216 in 5+ unit buildings).
Forward outlook
- In year one you build about $117k of equity ($17k loan paydown + $100k appreciation (4.0% local appreciation)).
- Suffolk County population projected to shrink 5% by 2050 — rents likely to lag national; underwrite the cash flow, not the appreciation.
- By year 2, paydown + projected appreciation supports a ~$189k cash-out refi (75% LTV) — recoverable capital for the next deal without selling this one.
Negotiation context
- It's been on market 44 days — a 3% lower offer ($2.42M) is reasonable based on typical stale-listing flexibility.
Risks & watch-outs
- Climate carrying-cost: severe wind risk, 80% chance of damaging wind over 30y — expect insurance premiums to compound above CPI over the hold.
Questions for the listing agent
- What do current leases actually rent for vs. the listed asking? Can we see a recent rent roll and the last 12 months of T-12 income?
- It's been on market 44 days. Have you received any prior offers? Is the seller open to a 14% concession, seller financing, or rate buy-down credit?
- Is there a deadline driving the sale (1031 exchange, divorce, estate, relocation)? That informs how much negotiation room exists.
- Schools are A-rated — typically a magnet for longer-tenancy family renters. What's the average tenant stay here, and is there a school-zone premium baked into asking?
- The area grade is low — what's the realistic commute time and amenity access for the typical tenant pool here? Any planned neighborhood developments (good or bad) we should know about?
- What's the average days-on-market for RENTAL listings here right now (not sales)? A rising rental-DOM trend means longer vacancies and softer asking-rent achievability than the comps imply.
- What's the recent tenant-quality profile in this submarket — average credit score on applications, eviction rate, late-payment / NSF rate, and stable-employment percentage? A property-management company in the area should have these aggregated.
- How much new for-sale + rental construction is in the pipeline within 1–3 miles? Heavy new supply typically softens prices + rents 12–24 months out; constrained supply supports both.
Investment metrics
- 1% rule
- 0.86% ✗
- Cap rate
- 6.12%
- Cash-on-cash
- -0.63%
- DSCR
- 0.97
- GRM
- 9.7
CMA / ARV
- ARV (median comp)
- $1,305,655
- List price
- $2,495,000
- Delta
- 91.09%
- Verdict
- OVERPRICED
- Comps
- 20 within 1.0 mi
Show comp detail 7 sales within ~0.75 mi
| Address | Dist | Beds/Ba | Sqft | Sold | Price | $/sf | Match |
|---|---|---|---|---|---|---|---|
| 61 W Side Ave | 0.47mi | 4/3.5 (+1) | 2,408 (+7%) | 13mo | $925,000 | $384 | 49 |
| 16 Walker Ct | 0.70mi | 4/3.0 (+1) | 2,400 (+6%) | 6mo | $1,900,000 | $792 | 47 |
| 647 Montauk Hwy | 0.48mi | 3/2.5 | 1,936 (-14%) | 6mo | $840,000 | $434 | 47 |
| 15 Sunset Ave | 0.59mi | 3/3.5 | 2,419 (+7%) | 16mo | $1,650,000 | $682 | 46 |
| 13 West End Ave | 0.60mi | 3/2.0 | 1,987 (-12%) | 5mo | $840,000 | $423 | 44 |
| 2 Box Tree Rd | 0.46mi | 4/2.5 (+1) | 2,500 (+11%) | 18mo | $1,300,000 | $520 | 38 |
| 24 Sunset Ave | 0.64mi | 4/3.0 (+1) | 2,400 (+6%) | 24mo | $1,625,000 | $677 | 35 |
Match score weights: distance 35% · size 25% · config 20% · recency 20%. Top-matched comps best support the ARV.
Projected returns pro-forma
4.01% appreciation · 3.0% rent growth · sell at horizon
- IRR
- 9.8%
- Equity multiple
- 1.59×
- Total profit
- $413,819
- Equity at exit
- $1,266,845
- IRR
- 11.6%
- Equity multiple
- 2.93×
- Total profit
- $1,345,451
- Equity at exit
- $2,073,500
Cash invested: $698,600 (down + closing). Projections, not guarantees.
Landlord ↔ Tenant lean methodology
- Overall (STATE)
- 15 Strongly Tenant-Friendly
- State New York
- 15 Strongly Tenant-Friendly · D+10
- County
- — inherits STATE
- City
- — inherits STATE
ZIP-level market 11959
- Home prices YoY
- 1.1%
- Active inventory
- 37
- Price-to-rent
- 9.7×
Monthly cashflow live
- Estimated rent
- $21,362 high interval (Pro) →
- Mortgage (P&I)
- −$13,084
- Tax est. 1.5%
- −$3,119 /mo · $37,425/yr
- Insurance
- −$1,040
- HOA
- −$0
- Vacancy / Maint / Mgmt
- −$4,486
- Net cashflow
- $-367
Break-even live
Sensitivity live
| Price | -10% $1,358 | -5% $496 | +0% $-367 | +5% $-1,229 | +10% $-2,091 |
|---|---|---|---|---|---|
| Rent | -10% $-2,054 | -5% $-1,210 | +0% $-367 | +5% $477 | +10% $1,321 |
| Rate | -1.0pp $890 | -0.5pp $268 | base $-367 | +0.5pp $-1,013 | +1.0pp $-1,671 |
UW: 25.0% down · 7.5% · 30yr · 1.5% tax · 5.0% vac · 8.0% maint · 8.0% mgmt
Financing live
Cash to close
- Down payment
- $623,750
- Closing costs
- $74,850
- Reserves months
- —
- Total cash needed
- —
Loan-product check · same deal, 3 products live
Conventional
25% down · 7.5% · 30yr
- Down + closing
- —
- Monthly P&I
- —
- Monthly cashflow
- —
- DSCR
- —
- Eligible?
- —
Personal DTI + credit; lowest rate.
DSCR
20% down · 8.5% · 30yr
- Down + closing
- —
- Monthly P&I
- —
- Monthly cashflow
- —
- DSCR
- —
- Eligible?
- —
No personal income docs; deal must DSCR.
Hard money
10% down · 12.0% · 12mo
- Down + closing
- —
- Monthly P&I
- —
- Monthly cashflow
- —
- DSCR
- —
- Eligible?
- —
Short-term bridge; refi at stabilization.
Rent comps 14 comps
| Address | Beds | Baths | Sqft | Rent | $/sqft | DOM | Units | Dist |
|---|---|---|---|---|---|---|---|---|
| 24 Quogue Riverhead Rd Quogue, NY | 3.0 | 3.0 | 2054 | $15,000 | $7.30 | 26d | 1 | 0.43mi |
| 8 Paynes Ln East Quogue, NY | 4.0 | 2.0 | 1776 | $18,000 | $10.14 | 46d | 1 | 0.45mi |
| 11 Post Xing East Quogue, NY | 3.0 | 2.0 | 2926 | $20,000 | $6.84 | 21d | 1 | 0.49mi |
| 85 Lewis Rd East Quogue, NY | 3.0 | 2.0 | 1593 | $4,450 | $2.79 | 46d | 1 | 0.61mi |
| 2941 Quogue Riverhead Rd East Quogue, NY | 3.0 | 2.5 | 2044 | $80,000 | $39.14 | 26d | 1 | 0.71mi |
| 114 Spinney Rd East Quogue, NY | 4.0 | 3.0 | 2201 | $18,000 | $8.18 | 21d | 1 | 0.77mi |
| 1 Whippoorwill Ln East Quogue, NY | 4.0 | 4.0 | 2483 | $29,000 | $11.68 | 7d | 1 | 1.00mi |
| 2 Bayside Ave East Quogue, NY | 4.0 | 3.0 | 2280 | $80,000 | $35.09 | 24d | 1 | 1.07mi |
| 21 Bayside Ave East Quogue, NY | 4.0 | 3.0 | 2900 | $14,000 | $4.83 | 0d | 1 | 1.09mi |
| 10 Fox Hollow Dr East Quogue, NY | 4.0 | 3.5 | 2750 | $30,000 | $10.91 | 46d | 1 | 1.11mi |
| 32 Lewis Rd East Quogue, NY | 4.0 | 2.0 | 1666 | $30,000 | $18.01 | 26d | 1 | 1.19mi |
| 30 Lewis Rd East Quogue, NY | 4.0 | 4.0 | 1592 | $30,000 | $18.84 | 46d | 1 | 1.21mi |
| 73 Spinney Rd East Quogue, NY | 3.0 | 2.5 | 2400 | $25,000 | $10.42 | 21d | 1 | 1.31mi |
| 69 Whippoorwill Ln Patchogue, NY | 4.0 | 4.0 | 2945 | $20,000 | $6.79 | 0d | 1 | 1.38mi |
Listing history 16 events
-
2026-06-21days on market $2,495,000 Active 44 DOM
-
2026-06-18days on market $2,495,000 Active 41 DOM
-
2026-06-17days on market $2,495,000 Active 40 DOM
-
2026-06-16days on market $2,495,000 Active 39 DOM
-
2026-06-15days on market $2,495,000 Active 38 DOM
-
2026-06-13days on market $2,495,000 Active 36 DOM
-
2026-06-13days on market $2,495,000 Active 35 DOM
-
2026-06-09days on market $2,495,000 Active 32 DOM
-
2026-06-08days on market $2,495,000 Active 31 DOM
-
2026-06-07days on market $2,495,000 Active 30 DOM
-
2026-06-04days on market $2,495,000 Active 27 DOM
-
2026-06-03days on market $2,495,000 Active 26 DOM
-
2026-06-02days on market $2,495,000 Active 25 DOM
-
2026-06-01days on market $2,495,000 Active 24 DOM
-
2026-05-31days on market $2,495,000 Active 23 DOM
-
2026-05-08$2,495,000 Active 973-char remark
ⓘ Source: listings_history table (triggers on properties + properties_extension) + one-shot
backfill from property_details.listing_events for pre-trigger history.
Climate risk First Street
- Flood 1/10 Low FEMA zone X (unshaded) · 0% chance over 30 yrs
- Wildfire 2/10 Low
- Heat 4/10 Moderate 7 d/yr ≥90°F today · 19 d/yr by 30 yrs out
- Wind 8/10 Severe 80% chance of damaging wind over 30 yrs
- Air quality 2/10 Low 2 unhealthy d/yr today · 2 by 30 yrs out
Nearby sold comps map
Loading sold comps map…
Walkable amenities ~0.75 mi
Loading nearby amenities…
Taxation est. · year 1
- Rental income
- $256,341
- − Mortgage interest
- −$139,759
- − Property taxes
- −$37,425
- − Insurance
- −$12,475
- − Repairs & maintenance
- −$20,507
- − Management
- −$20,507
- − Depreciation
- −$72,582
- Taxable loss
- −$46,914
- Est. tax savings @ 24.0%
- +$11,259
- After-tax cash flow
- $6,860/yr
For passive investors: Depreciation is non-cash, so a rental often shows a tax loss while cash-flowing — sheltering income. Rental losses are passive: they offset passive income freely, and up to $25,000/yr can offset ordinary (W-2) income if you actively participate and your MAGI is under $100k (phasing out to $0 by $150k); unused losses carry forward. On sale, claimed depreciation is recaptured at up to 25%, and gains may owe capital-gains tax (a 1031 exchange can defer both). Figures are a year-1 estimate at your 24.0% rate — not tax advice; consult a CPA.
Schools (NCES district)
- District
- Quogue Union Free School District
- NCES district ID
- 3624060
- Math proficiency
- 70% ▼ -10.00%
- Reading proficiency
- 80% ▬ 0.00%
- Median HH income
- $66,746
- Composite
- 66.09/100
- National rank
- #960
- State rank
- #125 of 755 in NY
Livability — Quogue
- Score
- 67/100
- State rank
- #600
- US rank
- #10895
Category grades
Schools grade is shown separately in the Schools card above.
Census & demographics
- Census place
- Quogue, NY
- City population
- 576
- Population (ZIP)
- 576
Population outlook (Suffolk County) Hauer SSP2
- Today (2025)
- 1,505,262 people
- By 2030
- 1,498,318 · -0.5%
- By 2040
- 1,471,101 · -2.3%
- By 2050
- 1,424,848 · -5.3%
- By 2075
- 1,337,157 · -11.2%
- By 2100
- 1,217,720 · -19.1%
Race, ethnicity, and origin ACS 2023
- Neighborhood character
- Predominantly White (71%)
- Race & ethnicity
- White 71% Two or more races 23% Hispanic / Latino 23% Black 3%
- Hispanic origin (detail)
- Common ancestry
- Italian 21% Portuguese 7% Scotch-Irish 4%
- Foreign-born
- 18% · Canada
- Languages at home
- 83% English-only · Spanish 17%
Political lean MEDSL · Suffolk
- 2024 margin
- Lean R (+10.0) · D 45.0% · R 55.0%
- 2008→2024 swing
- -16.0pp toward R · 2008: 6.0pp · 2024: -10.0pp
- All cycles
- 2024: R+10.0 2020: R+0.0 2016: R+8.2 2012: D+2.9 2008: D+6.0
Not yet ingested
- Civics
- —
Market trends
- HPI YoY
- ▲ 4.01%
- Current HPI
- 364.8746
- Rent YoY
- —
- Metro
- —
- State GDP YoY
- ▲ 2.60%
- F500 in state
- 92
Industry mix (Fortune 500 HQ in NY)
| Industry | F500 HQs | Revenue |
|---|---|---|
| Financial Services | 10 | $950B |
|
||
| Consumer Goods | 9 | $162B |
|
||
| Insurance | 4 | $225B |
|
||
| Telecommunications | 2 | $144B |
|
||
| Pharmaceuticals | 2 | $112B |
|
||
| Media / Entertainment | 2 | $69B |
|
||
Price history
1 event — show timeline
- 2026-05-08 Listed $2,495,000 OneKey® MLS as Distributed by MLS Grid
Property tax history
-1.0%/yrLatest (2025): $2,554 · +5.8% YoY. Source: county tax records.
Cash-flow waterfall
monthlySold comps — $/sqft
last 12 mo · ≤1 miLoading sold comps…