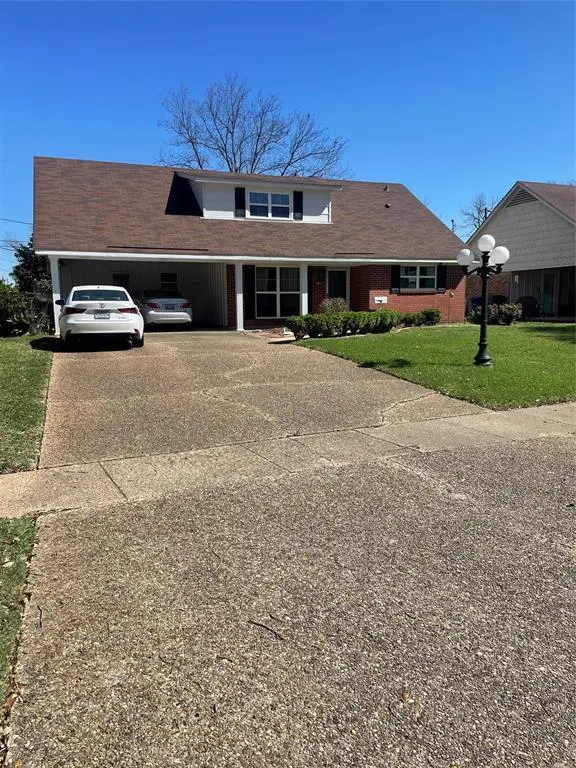
6109 Lovers Lane Ln · Shreveport, LA
Flood risk 1/10 · Minimal
- FEMA flood zone
- X
- Chance of flooding over 30 yrs
- 0.0%
- Est. flood insurance / yr
- $507 – $1,088
Fire risk 2/10 · Minimal
- Est. fire insurance / yr
- $1,269 – $2,357
Heat risk 7/10 · Major
- Hot days now (above 110°F)
- 7 days/yr
- Hot days in 30 yrs
- 22 days/yr
Wind risk 6/10 · Moderate
- Chance of severe wind over 30 yrs
- 73.0%
Air-quality risk 2/10 · Minimal
- Unhealthy air days now
- 0 days/yr
- Unhealthy air days in 30 yrs
- 1 days/yr
Risk factors via First Street. Map © Google.
Why this score? — see what drove the D- grade
The composite is a weighted blend of 9 inputs, each scored 0–100. Each bar is that input's sub-score; the figure is the points it added to the 100-point composite (weight × sub-score).
- Cash flow +12.3/30.0
- ARV discount +9.2/15.0
- DSCR +3.6/10.0
- Rent growth +3.5/5.0
- Livability +3.0/5.0
- 1% rule +2.7/10.0
- Condition / age +2.5/5.0
- Schools +2.2/10.0
- Appreciation +0.0/10.0
$245,000
🖨 Deal sheet (PDF) 📄 Offer letter ✓ Due diligence
Listing remarks MLS
2047 Sq ft 2 story home has 4 bedrooms and 2 baths and has a very open floor plan. Kitchen and downstairs baths have been remodeled. Roof recently inspected and has lots of years left. HVAC system is newer. Very large kitchen dining area. Living dining area is large also and has newer wood floors. Lots of windows across the back. Kit has stainless appliances including a refrigerator that remains but not warranted. Beautiful large back yard and patio to enjoy. One of the best locations central to everything in the heart of town!
Key facts
- Remodeled kitchen
- Newer wood floors
- Remodeled baths
Tags
Neighborhood map
What this means for you Summary
Snapshot
- This is a 4-bed/2.0-bath single-family listed at $245k.
Deal economics
- At list price, monthly cash flow is $-47 ($-565/yr) — negative.
- To cash-flow at today's rent, offer at most $237k (3.4% below list).
- To meet the 1% rule (rent ≥ 1% of price), the offer needs to be $189k (22.7% below list).
- Recommended offer: $189k (22.7% below list) — sets the bar for 1% rule.
Location & tenants
- Location reads 59/100 on livability (#270 in LA) — a working-class tenant base; expect higher turnover. Strengths: cost of living A+, housing A; Watch: crime F, amenities F, commute F.
- Caddo Parish (urban): math 21% / reading 32% proficiency, ranked #53 of 98 in LA (top 54%) — low school quality limits family demand, transient renter base, plan for 1-2y turnover; 64% free/reduced lunch — lower-income household profile, screen leases tightly.
- Zoned schools: Riverside Elementary School (math 29% / reading 38%, grade F, #296 of 646 statewide, top 46%, 458 students, 64% FRL); Caddo Parish Middle Magnet School (math 79% / reading 93%, grade A+, #1 of 218 statewide, top 0%, 1,003 students, 23% FRL); Captain Shreve High School (math 25% / reading 41%, grade F, #116 of 265 statewide, top 44%, 1,851 students, 49% FRL) — zoned schools average 45% FRL vs 64% district-wide (19 pts lower); this property's tenant base skews higher-income than the district average.
- Zoned-school proficiency averages 51% at this address vs 26% district-wide (+24 pts) — the actual schools serving this property are materially stronger than the Caddo Parish average implies; a family-tenant draw the district grade alone would hide.
- Market conditions: Rents rising (+3.9%/yr); 148 active listings in the ZIP; 12 comparable units currently listed for rent nearby; rentals lingering (median 46d on market — plan ~5-8 weeks vacancy on turnover, expect pricing pressure); 50% of comp listings sitting > 30 days — soft ceiling on asking rent; 221 units permitted in Caddo Parish in 2024 (0 in 5+ unit buildings).
- This rent runs 33% of the median local income ($68k/yr) — at the standard rent-burdened threshold; future hikes will face affordability resistance.
Forward outlook
- Local home prices are declining (-3.0%/yr); year-one equity from $2k of loan paydown is wiped out by about $7k of value loss. Plan a longer hold.
- Caddo County population projected at -15% by 2050 — secular population decline; favor cash flow + early exit over multi-decade hold.
Negotiation context
- It's been on market 101 days — a 9% lower offer ($223k) is reasonable based on typical stale-listing flexibility.
Risks & watch-outs
- Climate carrying-cost: major wind risk, 73% chance of damaging wind over 30y; extreme-heat days projected 7→22/yr by 2055 (HVAC capex compounding) — expect insurance premiums to compound above CPI over the hold.
Questions for the listing agent
- What do current leases actually rent for vs. the listed asking? Can we see a recent rent roll and the last 12 months of T-12 income?
- It's been on market 101 days. Have you received any prior offers? Is the seller open to a 23% concession, seller financing, or rate buy-down credit?
- Built in 1964 — when were the roof, HVAC, electrical panel, plumbing, and water heater last replaced?
- Why hasn't it sold? Are there any deal-killer items the seller is aware of (foundation, flood, title, zoning, code violations)?
- Is there a deadline driving the sale (1031 exchange, divorce, estate, relocation)? That informs how much negotiation room exists.
- Schools are D-rated, which usually means shorter tenancies and higher turnover. Who's the typical renter profile here, and what's been the actual vacancy rate?
- Crime grade is F in this area — have there been break-ins, vandalism, or insurance claims at this property in the last 3 years? What carrier currently insures it and at what premium?
- The area grade is low — what's the realistic commute time and amenity access for the typical tenant pool here? Any planned neighborhood developments (good or bad) we should know about?
- What's the average days-on-market for RENTAL listings here right now (not sales)? A rising rental-DOM trend means longer vacancies and softer asking-rent achievability than the comps imply.
- What's the recent tenant-quality profile in this submarket — average credit score on applications, eviction rate, late-payment / NSF rate, and stable-employment percentage? A property-management company in the area should have these aggregated.
- How much new for-sale + rental construction is in the pipeline within 1–3 miles? Heavy new supply typically softens prices + rents 12–24 months out; constrained supply supports both.
Investment metrics
- 1% rule
- 0.77% ✗
- Cap rate
- 6.06%
- Cash-on-cash
- -0.82%
- DSCR
- 0.96
- GRM
- 10.8
CMA / ARV
- ARV (median comp)
- $254,387
- List price
- $245,000
- Delta
- -3.69%
- Verdict
- FAIR
- Comps
- 20 within 1.0 mi
Show comp detail 12 sales within ~0.75 mi
| Address | Dist | Beds/Ba | Sqft | Sold | Price | $/sf | Match |
|---|---|---|---|---|---|---|---|
| 522 Levin Ln | 0.25mi | 3/2.0 (-1) | 1,609 (+1%) | 1mo | $193,000 | $120 | 82 |
| 333 Levin Ln | 0.28mi | 3/2.0 (-1) | 1,658 (+4%) | 1mo | $200,000 | $121 | 75 |
| 522 Oriole Ln | 0.31mi | 3/2.0 (-1) | 1,538 (-4%) | 5mo | $214,999 | $140 | 70 |
| 502 Mockingbird Ln | 0.51mi | 3/2.0 (-1) | 1,610 (+1%) | 5mo | $199,900 | $124 | 66 |
| 329 Tallow Ln | 0.21mi | 3/2.0 (-1) | 1,797 (+12%) | 3mo | $194,000 | $108 | 62 |
| 5101 Dixie Garden Dr | 0.39mi | 3/2.0 (-1) | 1,489 (-7%) | 4mo | $179,900 | $121 | 62 |
| 5822 River Rd | 0.43mi | 3/2.0 (-1) | 1,717 (+7%) | 1mo | $239,000 | $139 | 62 |
| 505 Meadowbrook Ln | 0.42mi | 3/2.0 (-1) | 1,781 (+11%) | 2mo | $99,000 | $56 | 55 |
| 5908 Leopold Ln | 0.69mi | 3/2.0 (-1) | 1,649 (+3%) | 5mo | $250,000 | $152 | 54 |
| 306 Baycliff Ln | 0.28mi | 3/2.0 (-1) | 1,836 (+15%) | 5mo | $210,000 | $114 | 53 |
| 309 E Southfield Rd | 0.56mi | 3/2.0 (-1) | 1,416 (-12%) | 1mo | $165,000 | $117 | 49 |
| 531 Haynes Ave | 0.61mi | 3/1.0 (-1) | 1,399 (-13%) | 4mo | $172,000 | $123 | 38 |
Match score weights: distance 35% · size 25% · config 20% · recency 20%. Top-matched comps best support the ARV.
Projected returns pro-forma
-3.0% appreciation · 3.93% rent growth · sell at horizon
- IRR
- -16.7%
- Equity multiple
- 0.40×
- Total profit
- $-40,972
- Equity at exit
- $36,530
- IRR
- -7.2%
- Equity multiple
- 0.53×
- Total profit
- $-32,317
- Equity at exit
- $21,183
Cash invested: $68,600 (down + closing). Projections, not guarantees.
Landlord ↔ Tenant lean methodology
- Overall (STATE)
- 90 Strongly Landlord-Friendly
- State Louisiana
- 90 Strongly Landlord-Friendly · R+12
- County
- — inherits STATE
- City
- — inherits STATE
ZIP-level market 71105
- Rents YoY
- 3.9%
- Active inventory
- 148
- Price-to-rent
- 10.8×
Monthly cashflow live
- Estimated rent
- $1,894 high interval (Pro) →
- Mortgage (P&I)
- −$1,285
- Tax from tax record
- −$156 /mo · $1,873/yr
- Insurance
- −$102
- HOA
- −$0
- Vacancy / Maint / Mgmt
- −$398
- Net cashflow
- $-47
Break-even live
Sensitivity live
| Price | -10% $92 | -5% $22 | +0% $-47 | +5% $-116 | +10% $-186 |
|---|---|---|---|---|---|
| Rent | -10% $-197 | -5% $-122 | +0% $-47 | +5% $28 | +10% $103 |
| Rate | -1.0pp $76 | -0.5pp $15 | base $-47 | +0.5pp $-111 | +1.0pp $-175 |
UW: 25.0% down · 7.5% · 30yr · 1.5% tax · 5.0% vac · 8.0% maint · 8.0% mgmt
Financing live
Cash to close
- Down payment
- $61,250
- Closing costs
- $7,350
- Reserves months
- —
- Total cash needed
- —
Loan-product check · same deal, 3 products live
Conventional
25% down · 7.5% · 30yr
- Down + closing
- —
- Monthly P&I
- —
- Monthly cashflow
- —
- DSCR
- —
- Eligible?
- —
Personal DTI + credit; lowest rate.
DSCR
20% down · 8.5% · 30yr
- Down + closing
- —
- Monthly P&I
- —
- Monthly cashflow
- —
- DSCR
- —
- Eligible?
- —
No personal income docs; deal must DSCR.
Hard money
10% down · 12.0% · 12mo
- Down + closing
- —
- Monthly P&I
- —
- Monthly cashflow
- —
- DSCR
- —
- Eligible?
- —
Short-term bridge; refi at stabilization.
Rent comps 12 comps
| Address | Beds | Baths | Sqft | Rent | $/sqft | DOM | Units | Dist |
|---|---|---|---|---|---|---|---|---|
| 6122 Burgundy Dr Shreveport, LA | 4.0 | 2.0 | 2222 | $2,500 | $1.13 | 45d | 1 | 0.26mi |
| 2033 Horton Ave Shreveport, LA | 3.0 | 2.0 | 1681 | $1,750 | $1.04 | 23d | 1 | 0.73mi |
| 154 Southfield Rd Shreveport, LA | 3.0 | 1.0 | 1258 | $1,395 | $1.11 | 45d | 1 | 0.77mi |
| 119 Charles Ave Shreveport, LA | 3.0 | 2.0 | 1518 | $1,800 | $1.19 | 45d | 1 | 0.81mi |
| 2011 Audubon Pl Shreveport, LA | 3.0 | 2.0 | 1932 | $1,800 | $0.93 | 45d | 1 | 0.84mi |
| 243 Justin Ave Shreveport, LA | 3.0 | 1.0 | 1236 | $1,400 | $1.13 | 45d | 1 | 0.97mi |
| 186 Charles Ave Shreveport, LA | 3.0 | 1.0 | 1320 | $1,675 | $1.27 | 23d | 1 | 0.99mi |
| 216 Pennsylvania Ave Shreveport, LA | 3.0 | 1.0 | 1199 | $1,250 | $1.04 | 23d | 1 | 1.24mi |
| 7800 Youree Dr Shreveport, LA | 1.0–3.0 | 1.0–2.0 | 1031 | $1,724 | $1.67 | 15d | 41 | 1.29mi |
| 204 Leo Ave Shreveport, LA | 4.0 | 2.0 | 1846 | $2,000 | $1.08 | 15d | 1 | 1.39mi |
| 1105 Island Park Blvd Shreveport, LA | 2.0–3.0 | 2.0 | 1280 | $1,781 | $1.39 | 15d | 9 | 1.45mi |
| 293 Eagle Bend Way Shreveport, LA | 3.0 | 2.0 | 1800 | $2,025 | $1.12 | 45d | 1 | 1.45mi |
Listing history 20 events
-
2026-06-21days on market $245,000 Active 101 DOM
-
2026-06-18days on market $245,000 Active 98 DOM
-
2026-06-17days on market $245,000 Active 97 DOM
-
2026-06-16days on market $245,000 Active 96 DOM
-
2026-06-15days on market $245,000 Active 95 DOM
-
2026-06-14days on market $245,000 Active 93 DOM
-
2026-06-13days on market $245,000 Active 92 DOM
-
2026-06-10days on market $245,000 Active 90 DOM
-
2026-06-09days on market $245,000 Active 89 DOM
-
2026-06-08days on market $245,000 Active 88 DOM
-
2026-06-07days on market $245,000 Active 87 DOM
-
2026-06-05days on market $245,000 Active 84 DOM
-
2026-06-03days on market $245,000 Active 83 DOM
-
2026-06-02days on market $245,000 Active 82 DOM
-
2026-06-01days on market $245,000 Active 81 DOM
-
2026-05-31days on market $245,000 Active 80 DOM
-
2026-05-30days on market $245,000 Active 79 DOM
-
2026-05-19price $245,000 533-char remark
Show marketing remark (533 chars)
2047 Sq ft 2 story home has 4 bedrooms and 2 baths and has a very open floor plan. Kitchen and downstairs baths have been remodeled. Roof recently inspected and has lots of years left. HVAC system is newer. Very large kitchen dining area. Living dining area is large also and has newer wood floors. Lots of windows across the back. Kit has stainless appliances including a refrigerator that remains but not warranted. Beautiful large back yard and patio to enjoy. One of the best locations central to everything in the heart of town!
-
2026-04-12price $264,950 533-char remark
Show marketing remark (533 chars)
2047 Sq ft 2 story home has 4 bedrooms and 2 baths and has a very open floor plan. Kitchen and downstairs baths have been remodeled. Roof recently inspected and has lots of years left. HVAC system is newer. Very large kitchen dining area. Living dining area is large also and has newer wood floors. Lots of windows across the back. Kit has stainless appliances including a refrigerator that remains but not warranted. Beautiful large back yard and patio to enjoy. One of the best locations central to everything in the heart of town!
-
2026-03-12$275,000 Active 533-char remark
Show marketing remark (533 chars)
2047 Sq ft 2 story home has 4 bedrooms and 2 baths and has a very open floor plan. Kitchen and downstairs baths have been remodeled. Roof recently inspected and has lots of years left. HVAC system is newer. Very large kitchen dining area. Living dining area is large also and has newer wood floors. Lots of windows across the back. Kit has stainless appliances including a refrigerator that remains but not warranted. Beautiful large back yard and patio to enjoy. One of the best locations central to everything in the heart of town!
ⓘ Source: listings_history table (triggers on properties + properties_extension) + one-shot
backfill from property_details.listing_events for pre-trigger history.
Tax reassessment forecast LA · Resets to sale price
- Current annual tax
- $1,873 · $156/mo
- Projected year-2 tax
- $1,873 · $156/mo
- Expected delta
- $0/yr ($0/mo · 0.0%)
ⓘ Screening estimate from a state-policy table — verify with the county assessor before closing.
Climate risk First Street
- Flood 1/10 Low FEMA zone X · 0% chance over 30 yrs
- Wildfire 2/10 Low
- Heat 7/10 Severe 7 d/yr ≥110°F today · 22 d/yr by 30 yrs out
- Wind 6/10 Major 73% chance of damaging wind over 30 yrs
- Air quality 2/10 Low 0 unhealthy d/yr today · 1 by 30 yrs out
Nearby sold comps map
Loading sold comps map…
Walkable amenities ~0.75 mi
Loading nearby amenities…
Taxation est. · year 1
- Rental income
- $22,723
- − Mortgage interest
- −$13,724
- − Property taxes
- −$1,873
- − Insurance
- −$1,225
- − Repairs & maintenance
- −$1,818
- − Management
- −$1,818
- − Depreciation
- −$7,127
- Taxable loss
- −$4,862
- Est. tax savings @ 24.0%
- +$1,167
- After-tax cash flow
- $602/yr
For passive investors: Depreciation is non-cash, so a rental often shows a tax loss while cash-flowing — sheltering income. Rental losses are passive: they offset passive income freely, and up to $25,000/yr can offset ordinary (W-2) income if you actively participate and your MAGI is under $100k (phasing out to $0 by $150k); unused losses carry forward. On sale, claimed depreciation is recaptured at up to 25%, and gains may owe capital-gains tax (a 1031 exchange can defer both). Figures are a year-1 estimate at your 24.0% rate — not tax advice; consult a CPA.
Schools (NCES district)
- District
- Caddo Parish
- NCES district ID
- 2200300
- Math proficiency
- 21% ▼ -33.00%
- Reading proficiency
- 32% ▼ -30.00%
- Median HH income
- $39,227
- Composite
- 22.23/100
- National rank
- #8148
- State rank
- #53 of 98 in LA
Livability — Shreveport
- Score
- 59/100
- State rank
- #270
- US rank
- #19730
Category grades
Schools grade is shown separately in the Schools card above.
Census & demographics
- Census place
- Shreveport, LA
- County
- Caddo Parish · 178,536 people
- City population
- 164,123
- Metro
- Shreveport-Bossier City, LA
- Population (ZIP)
- 20,179
- Household income
- $67,968
- Rent vs Own
- Severe rent burden
- 1007.0
Population outlook (Caddo County) Hauer SSP2
- Today (2025)
- 243,190 people
- By 2030
- 237,231 · -2.5%
- By 2040
- 222,502 · -8.5%
- By 2050
- 206,516 · -15.1%
- By 2075
- 165,706 · -31.9%
- By 2100
- 122,262 · -49.7%
Race, ethnicity, and origin ACS 2023
- Neighborhood character
- Predominantly White (68%)
- Race & ethnicity
- White 68% Black 20% Two or more races 7% Hispanic / Latino 5% Asian 4%
- Hispanic origin (detail)
- Mexican 2%
- Common ancestry
- Lithuanian 3% Serbian 3% Slovak 2%
- Foreign-born
- 5% · Canada, China
- Languages at home
- 93% English-only · Spanish 2% Other Indo-European 1% Russian/Polish/Slavic 1%
Political lean MEDSL · Caddo
- 2024 margin
- Toss-up / Even · D 51.6% · R 47.0% · Other 1.4%
- 2008→2024 swing
- +1.6pp toward D · 2008: 3.0pp · 2024: 4.6pp
- All cycles
- 2024: D+4.6 2020: D+6.8 2016: D+4.2 2012: D+4.9 2008: D+3.0
Not yet ingested
- Civics
- —
Market trends
- HPI YoY
- ▼ -96.75%
- Current HPI
- 129.572
- Rent YoY
- ▲ 3.93%
- Metro
- Shreveport-Bossier City, LA
- State GDP YoY
- ▲ 3.29%
- F500 in state
- 10
Industry mix (Fortune 500 HQ in LA)
| Industry | F500 HQs | Revenue |
|---|---|---|
| Telecommunications | 2 | $23B |
|
||
| Utilities | 1 | $12B |
|
||
| Wholesale / Distribution | 1 | $5B |
|
||
| Advertising | 1 | $2B |
|
||
Price history
-10.9% since first listed3 events — show timeline
- 2026-05-19 Price Changed $245,000 NTREIS
- 2026-04-12 Price Changed $264,950 NTREIS
- 2026-03-12 Listed $275,000 NTREIS
Property tax history
+8.1%/yrLatest (2025): $1,873 · +0.4% YoY. Source: county tax records.
Cash-flow waterfall
monthlySold comps — $/sqft
last 12 mo · ≤1 miLoading sold comps…