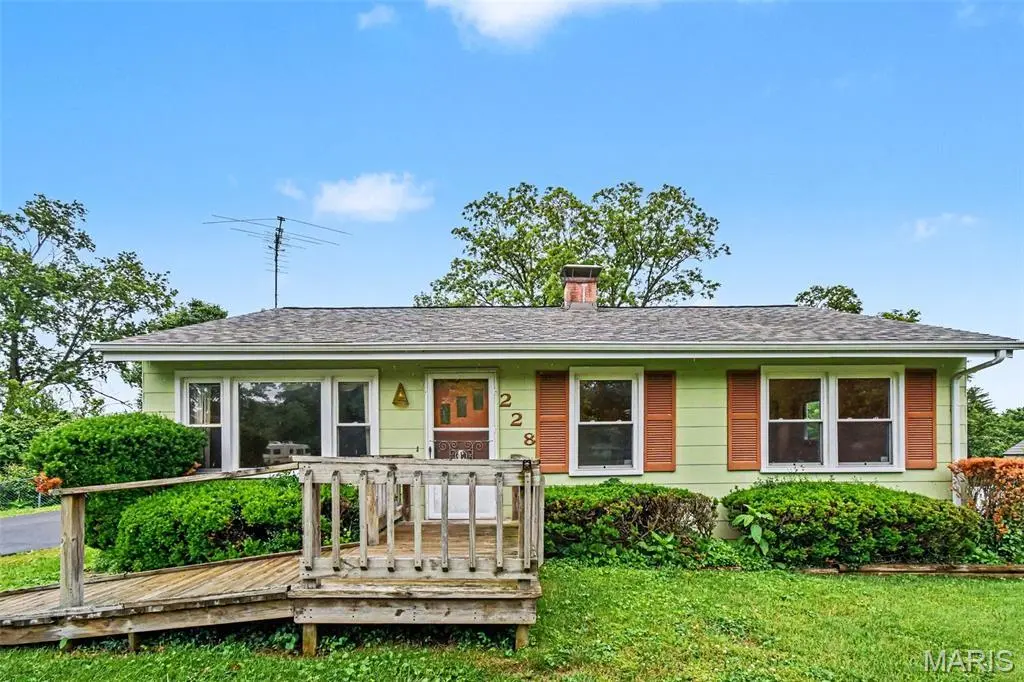
228 Newton Pl · Ballwin, MO
Flood risk 1/10 · Minimal
- FEMA flood zone
- X (unshaded)
- Chance of flooding over 30 yrs
- 0.0%
- Est. flood insurance / yr
- $473 – $860
Fire risk 1/10 · Minimal
- Est. fire insurance / yr
- $1,054 – $1,958
Heat risk 5/10 · Moderate
- Hot days now (above 107°F)
- 7 days/yr
- Hot days in 30 yrs
- 20 days/yr
Wind risk 2/10 · Minimal
- Chance of severe wind over 30 yrs
- 1.0%
Air-quality risk 2/10 · Minimal
- Unhealthy air days now
- 0 days/yr
- Unhealthy air days in 30 yrs
- 2 days/yr
Risk factors via First Street. Map © Google.
Why this score? — see what drove the C grade
The composite is a weighted blend of 9 inputs, each scored 0–100. Each bar is that input's sub-score; the figure is the points it added to the 100-point composite (weight × sub-score).
- Cash flow +17.6/30.0
- ARV discount +12.7/15.0
- DSCR +5.5/10.0
- Schools +5.4/10.0
- 1% rule +4.3/10.0
- Livability +4.3/5.0
- Rent growth +3.0/5.0
- Condition / age +2.5/5.0
- Appreciation +0.0/10.0
$225,900
🖨 Deal sheet 📄 Offer letter ✓ Due diligence
Listing remarks
Welcome Home to Ballwin! Nestled in one of Ballwin’s most desirable neighborhoods within a top-tier, highly rated school district, this charming three bedroom, one bathroom home offers the perfect blend of comfort and unbeatable convenience. While the main level provides a fantastic, versatile layout ready for your personal touch, the property truly shines with its exceptional exterior and lower-level features, boasting plenty of parking space for guests and a massive full basement that offers incredible storage or the perfect canvas to finish for additional living area. Just minutes away from a vibrant selection of shopping, dining, and local amenities—making this an incredibl
Key facts
- 0.46 acre lot
- Built 1955
- Listed 6 days
Property features AI
Finance
- Other: Above-grade living area reported as 925 (public records); Lot dimensions approximately 100 x 199 x 100 x 199; Lot size approximately 0.46 acre
- Financial info: Lease not considered
Exterior
- Utilities: Public water; Public sewer; Electric service by Ameren; Electricity connected; Natural gas connected; Sewer connected; Water connected
- Home design: Single family residence; House with one level; Owner by contract
- Construction: Built using other construction materials
- Exterior features: Level lot
Interior
- Bedrooms: Three bedrooms on the main level
- Bathrooms: One full bathroom on the main level
- Heating & cooling: Natural gas heating; Central air conditioning
- Interior features: Full basement; Five total rooms
Neighborhood map
What this means for you Summary
Snapshot
- This is a 3-bed/1.0-bath single-family listed at $226k.
Deal economics
- At list price, monthly cash flow is $177 ($2k/yr) — positive.
- The deal already cash-flows at list — no discount required.
- To meet the 1% rule (rent ≥ 1% of price), the offer needs to be $210k (7.1% below list).
- Recommended offer: $210k (7.1% below list) — sets the bar for 1% rule.
- Cap rate 7.2% vs local median 4.0% in Ballwin — top-decile yield for the area; either an underpriced asset or a hidden risk that comps aren't pricing in. Stress-test before assuming the spread holds.
Location & tenants
- Location reads 86/100 on livability (#2 in MO, #357 nationally) — a professional / high-income tenant draw. Strengths: crime A+, employment A+, housing A+; Watch: commute D.
- Rockwood R-VI (suburban): math 51% / reading 64% proficiency, ranked #9 of 324 in MO (top 3%) — acceptable for families but not a draw, mixed tenant base, ~2y average lease; only 10% free/reduced lunch — higher-income household profile.
- Zoned schools: Ballwin Elem. (math 45% / reading 57%, grade C-, #273 of 1,115 statewide, top 25%, 434 students, 18% FRL); Marquette Sr. High (math 53% / reading 79%, grade B, #17 of 521 statewide, top 3%, 2,155 students, 13% FRL).
- Market conditions: Rents rising (+1.9%/yr); 241 active listings in the ZIP; 5 comparable units currently listed for rent nearby; rentals leasing fast (median 2d on market — plan ~1-2 weeks tenant-placement turnaround); high-income renter base; 920 units permitted in St. Louis County in 2024 (250 in 5+ unit buildings).
Forward outlook
- Local home prices are declining (-3.0%/yr); year-one equity from $2k of loan paydown is wiped out by about $7k of value loss. Plan a longer hold.
Negotiation context
- Only 6 days on market — expect competitive offers; lowballing is unlikely to land.
Risks & watch-outs
- Watch-outs: built in 1955 — expect roof / HVAC / electrical / plumbing capex.
- Climate carrying-cost: extreme-heat days projected 7→20/yr by 2055 (HVAC capex compounding) — expect insurance premiums to compound above CPI over the hold.
Questions for the listing agent
- Built in 1955 — when were the roof, HVAC, electrical panel, plumbing, and water heater last replaced?
- Is there a deadline driving the sale (1031 exchange, divorce, estate, relocation)? That informs how much negotiation room exists.
- Schools are A-rated — typically a magnet for longer-tenancy family renters. What's the average tenant stay here, and is there a school-zone premium baked into asking?
- What's the average days-on-market for RENTAL listings here right now (not sales)? A rising rental-DOM trend means longer vacancies and softer asking-rent achievability than the comps imply.
- What's the recent tenant-quality profile in this submarket — average credit score on applications, eviction rate, late-payment / NSF rate, and stable-employment percentage? A property-management company in the area should have these aggregated.
- How much new for-sale + rental construction is in the pipeline within 1–3 miles? Heavy new supply typically softens prices + rents 12–24 months out; constrained supply supports both.
Investment metrics
- 1% rule
- 0.93% ✗
- Cap rate
- 7.24%
- Cash-on-cash
- 3.37%
- DSCR
- 1.15
- GRM
- 9.0
CMA / ARV
- ARV (on-the-fly)
- $255,300
- Comps found
- 12
Show comp detail 12 sales within ~0.75 mi
| Address | Dist | Beds/Ba | Sqft | Sold | Price | $/sf | Match |
|---|---|---|---|---|---|---|---|
| 617 Barton Ln | 0.19mi | 3/1.0 | 925 (0%) | 14mo | $275,000 | $297 | 79 |
| 241 Dennison Dr | 0.26mi | 3/1.0 | 925 (0%) | 13mo | $250,000 | $270 | 77 |
| 212 Ramsey Ln | 0.34mi | 3/2.0 | 925 (0%) | 23mo | $278,000 | $301 | 61 |
| 110 Coral Ter #5 | 0.33mi | 2/2.0 (-1) | 928 (+0%) | 17mo | $175,000 | $189 | 61 |
| 247 Ramsey Ln | 0.47mi | 3/1.0 | 1,008 (+9%) | 3mo | $230,000 | $228 | 61 |
| 442 Radford Ln | 0.50mi | 3/1.0 | 982 (+6%) | 9mo | $289,900 | $295 | 59 |
| 239 Ramsey Ln | 0.43mi | 3/1.0 | 1,000 (+8%) | 13mo | $219,999 | $220 | 56 |
| 117 Birchwood Dr | 0.43mi | 3/1.5 | 1,020 (+10%) | 12mo | $299,900 | $294 | 51 |
| 633 Highland Dr | 0.56mi | 3/1.0 | 960 (+4%) | 23mo | $264,800 | $276 | 48 |
| 236 Warner Ct | 0.52mi | 3/1.0 | 1,008 (+9%) | 19mo | $214,999 | $213 | 45 |
| 285 Ramsey Ln | 0.74mi | 3/1.0 | 1,008 (+9%) | 12mo | $129,900 | $129 | 41 |
| 639 Highland Dr | 0.58mi | 4/2.0 (+1) | 1,000 (+8%) | 16mo | $334,900 | $335 | 37 |
Match score weights: distance 35% · size 25% · config 20% · recency 20%. Top-matched comps best support the ARV.
Projected returns pro-forma
-3.0% appreciation · 1.94% rent growth · sell at horizon
- IRR
- -12.2%
- Equity multiple
- 0.56×
- Total profit
- $-27,539
- Equity at exit
- $33,682
- IRR
- -4.6%
- Equity multiple
- 0.71×
- Total profit
- $-18,400
- Equity at exit
- $19,532
Cash invested: $63,252 (down + closing). Projections, not guarantees.
Landlord ↔ Tenant lean methodology
- Overall (STATE)
- 81 Strongly Landlord-Friendly
- State Missouri
- 81 Strongly Landlord-Friendly · R+10
- County
- — inherits STATE
- City
- — inherits STATE
ZIP-level market 63021
- Rents YoY
- 1.9%
- Active inventory
- 241
- Price-to-rent
- 9.0×
Monthly cashflow live
- Estimated rent
- $2,098 high interval (Pro) →
- Mortgage (P&I)
- −$1,185
- Tax from tax record
- −$201 /mo · $2,415/yr
- Insurance
- −$94
- HOA
- −$0
- Vacancy / Maint / Mgmt
- −$441
- Net cashflow
- $177
Break-even live
UW: 25.0% down · 7.5% · 30yr · 1.5% tax · 5.0% vac · 8.0% maint · 8.0% mgmt
Financing live
Cash to close
- Down payment
- $56,475
- Closing costs
- $6,777
- Reserves months
- —
- Total cash needed
- —
Loan-product check · same deal, 3 products live
Conventional
25% down · 7.5% · 30yr
- Down + closing
- —
- Monthly P&I
- —
- Monthly cashflow
- —
- DSCR
- —
- Eligible?
- —
Personal DTI + credit; lowest rate.
DSCR
20% down · 8.5% · 30yr
- Down + closing
- —
- Monthly P&I
- —
- Monthly cashflow
- —
- DSCR
- —
- Eligible?
- —
No personal income docs; deal must DSCR.
Hard money
10% down · 12.0% · 12mo
- Down + closing
- —
- Monthly P&I
- —
- Monthly cashflow
- —
- DSCR
- —
- Eligible?
- —
Short-term bridge; refi at stabilization.
Rent comps 5 comps
| Address | Beds | Baths | Sqft | Rent | $/sqft | DOM | Units | Dist |
|---|---|---|---|---|---|---|---|---|
| 170 Steamboat Ln Ballwin, MO | 1.0–3.0 | 1.0–2.5 | 1177 | $2,302 | $1.95 | 1d | 10 | 0.51mi |
| 204 Hillsdale Dr Ballwin, MO | 3.0 | 1.0 | 925 | $1,995 | $2.16 | 43d | 1 | 0.91mi |
| 500 Seven Trails Dr Ballwin, MO | 1.0–2.0 | 1.0–2.0 | 1171 | $1,904 | $1.63 | 1d | 18 | 0.93mi |
| 920 Quail Terrace Ct Ballwin, MO | 2.0–3.0 | 1.0–2.0 | 1029 | $2,209 | $2.15 | 1d | 9 | 1.01mi |
| 455 Down Hill Dr Ballwin, MO | 3.0 | 2.0 | 1092 | $1,926 | $1.76 | 1d | 1 | 1.09mi |
Listing history 5 events
-
2026-05-22$225,900 Active
-
2026-05-21historical $225,900
-
1995-01-24soldstatus
-
1995-01-24soldstatus
-
1955-12-05soldstatus
ⓘ Source: listings_history table (triggers on properties + properties_extension) + one-shot
backfill from property_details.listing_events for pre-trigger history.
Tax reassessment forecast MO · Resets to sale price
- Current annual tax
- $2,415 · $201/mo
- Projected year-2 tax
- $2,415 · $201/mo
- Expected delta
- $0/yr ($0/mo · 0.0%)
ⓘ Screening estimate from a state-policy table — verify with the county assessor before closing.
Climate risk First Street
- Flood 1/10 Low FEMA zone X (unshaded) · 0% chance over 30 yrs
- Wildfire 1/10 Low
- Heat 5/10 Major 7 d/yr ≥107°F today · 20 d/yr by 30 yrs out
- Wind 2/10 Low 100% chance of damaging wind over 30 yrs
- Air quality 2/10 Low 0 unhealthy d/yr today · 2 by 30 yrs out
Nearby sold comps map
Loading sold comps map…
Walkable amenities ~0.75 mi
Loading nearby amenities…
Taxation est. · year 1
- Rental income
- $25,176
- − Mortgage interest
- −$12,654
- − Property taxes
- −$2,415
- − Insurance
- −$1,130
- − Repairs & maintenance
- −$2,014
- − Management
- −$2,014
- − Depreciation
- −$6,572
- Taxable loss
- −$1,622
- Est. tax savings @ 24.0%
- +$389
- After-tax cash flow
- $2,518/yr
For passive investors: Depreciation is non-cash, so a rental often shows a tax loss while cash-flowing — sheltering income. Rental losses are passive: they offset passive income freely, and up to $25,000/yr can offset ordinary (W-2) income if you actively participate and your MAGI is under $100k (phasing out to $0 by $150k); unused losses carry forward. On sale, claimed depreciation is recaptured at up to 25%, and gains may owe capital-gains tax (a 1031 exchange can defer both). Figures are a year-1 estimate at your 24.0% rate — not tax advice; consult a CPA.
Schools (NCES district)
- District
- Rockwood R-VI
- NCES district ID
- 2926850
- Math proficiency
- 51% ▼ -7.00%
- Reading proficiency
- 64% ▼ -2.00%
- Median HH income
- $98,721
- Composite
- 53.61/100
- National rank
- #1438
- State rank
- #9 of 324 in MO
Livability — Ballwin
- Score
- 86/100
- State rank
- #2
- US rank
- #357
Category grades
Schools grade is shown separately in the Schools card above.
Census & demographics
- Census place
- Ballwin, MO
- County
- Saint Louis County · 888,823 people
- City population
- 91,586
- Metro
- St. Louis, MO-IL
- Population (ZIP)
- 55,666
- Household income
- $120,177
- Rent vs Own
- Severe rent burden
- 932.0
Population outlook (St. Louis County) Hauer SSP2
- Today (2025)
- 1,025,227 people
- By 2030
- 1,028,023 · +0.3%
- By 2040
- 1,020,940 · -0.4%
- By 2050
- 1,007,280 · -1.8%
- By 2075
- 987,277 · -3.7%
- By 2100
- 921,984 · -10.1%
Race, ethnicity, and origin ACS 2023
- Neighborhood character
- Predominantly White (76%)
- Race & ethnicity
- White 76% Asian 10% Two or more races 9% Hispanic / Latino 5% Black 3%
- Hispanic origin (detail)
- Mexican 4%
- Common ancestry
- Lithuanian 3% Romanian 2% Italian 2%
- Foreign-born
- 11% · Canada, China, South Korea
- Languages at home
- 85% English-only · Other Indo-European 4% Spanish 3% Other Asian/Pacific 2%
Political lean MEDSL · St. Louis
- 2024 margin
- Strong D (+23.4) · D 60.8% · R 37.4% · Other 1.7%
- 2008→2024 swing
- +3.5pp toward D · 2008: 19.9pp · 2024: 23.4pp
- All cycles
- 2024: D+23.4 2020: D+24.0 2016: D+16.2 2012: D+13.7 2008: D+19.9
Not yet ingested
- Civics
- —
Market trends
- HPI YoY
- ▼ -209.71%
- Current HPI
- 221.4498
- Rent YoY
- ▲ 1.94%
- Metro
- St. Louis, MO-IL
- State GDP YoY
- ▲ 1.84%
- F500 in state
- 20
Industry mix (Fortune 500 HQ in MO)
| Industry | F500 HQs | Revenue |
|---|---|---|
| Healthcare | 1 | $163B |
|
||
| Insurance | 1 | $21B |
|
||
| Industrial Technology | 1 | $17B |
|
||
| Retail | 1 | $16B |
|
||
| Industrial Distribution | 1 | $10B |
|
||
| Utilities | 1 | $9B |
|
||
Price history
+0.0% since first listed5 events — show timeline
- 2026-05-22 Listed $225,900 MARIS as Distributed by MLS Grid
- 2026-05-21 Coming Soon $225,900 MARIS as Distributed by MLS Grid
- 1995-01-24 Sold (Public Records) — Public Records
- 1995-01-24 Sold (Public Records) — Public Records
- 1955-12-05 Sold (Public Records) — Public Records
Property tax history
+5.3%/yrLatest (2022): $2,415 · +0.7% YoY. Source: county tax records.
Cash-flow waterfall
monthlySold comps — $/sqft
last 12 mo · ≤1 miLoading sold comps…