26 Malauka Radial Run · Silver Springs Shores East, FL
Flood risk 1/10 · Minimal
- FEMA flood zone
- X (unshaded)
- Chance of flooding over 30 yrs
- 0.0%
- Est. flood insurance / yr
- $507 – $1,088
Fire risk 5/10 · Moderate
- Est. fire insurance / yr
- $947 – $1,759
Heat risk 8/10 · Major
- Hot days now (above 108°F)
- 7 days/yr
- Hot days in 30 yrs
- 21 days/yr
Wind risk 9/10 · Severe
- Chance of severe wind over 30 yrs
- 99.0%
Air-quality risk 3/10 · Minor
- Unhealthy air days now
- 3 days/yr
- Unhealthy air days in 30 yrs
- 4 days/yr
Risk factors via First Street. Map © Google.
Why this score? — see what drove the D grade
The composite is a weighted blend of 9 inputs, each scored 0–100. Each bar is that input's sub-score; the figure is the points it added to the 100-point composite (weight × sub-score).
- Cash flow +14.5/30.0
- ARV discount +7.8/15.0
- DSCR +4.4/10.0
- Schools +3.6/10.0
- 1% rule +2.7/10.0
- Rent growth +2.5/5.0
- Livability +2.5/5.0
- Condition / age +2.5/5.0
- Appreciation +0.0/10.0
$229,900
🖨 Deal sheet 📄 Offer letter ✓ Due diligence
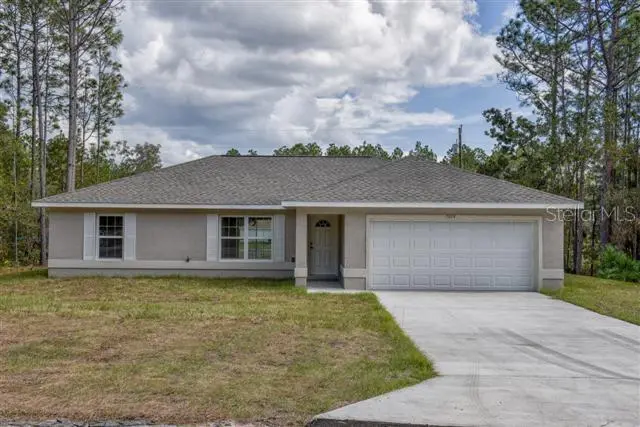
Listing remarks MLS
BEAUTIFUL BRAND-NEW Custom home. Pictures are of a Model Home and not the actual home. Block with stucco 3 bedroom, 2 bath with attached 2 car garage. Beautiful cabinets accent a gorgeous kitchen. Appliances include Refrigerator, Range with hood and Dishwasher. Walk-in closet in Master. High Efficiency windows.
Key facts
- 0.23 acre lot
- 2 garage spots
- Built 2026
Neighborhood map
What this means for you Summary
Snapshot
- This is a 3-bed/2.0-bath land listed at $230k.
Deal economics
- At list price, monthly cash flow is $50 ($598/yr) — positive.
- The deal already cash-flows at list — no discount required.
- To meet the 1% rule (rent ≥ 1% of price), the offer needs to be $176k (23.3% below list).
- Recommended offer: $176k (23.3% below list) — sets the bar for 1% rule.
- Cap rate 6.6% vs local median 5.2% in Silver Springs Shores East — meaningfully above typical; check what's discounted (condition, days-on-market, listing class) to confirm the premium yield is real.
Location & tenants
- Location reads: area grade D — affects rentability + tenant quality, not the cash-flow math above.
- Marion (rural): math 42% / reading 43% proficiency, ranked #61 of 73 in FL (top 84%) — families likely to look elsewhere, expect single-tenant / working-renter base with shorter leases; 61% free/reduced lunch — lower-income household profile, screen leases tightly.
- Market conditions: 426 active listings in the ZIP; 10 comparable units currently listed for rent nearby; rentals at typical pace (median 21d on market — plan ~3-4 weeks tenant-placement turnaround); 7,071 units permitted in Marion County in 2024 (534 in 5+ unit buildings).
- At $1,764/mo this rent would consume 46% of the median local household income ($47k/yr) (locally 303% of renters already pay >50% of income on rent) — very limited rent-growth headroom before tenants either downsize or default.
Forward outlook
- Local home prices are declining (-3.0%/yr); year-one equity from $2k of loan paydown is wiped out by about $7k of value loss. Plan a longer hold.
- Marion County population projected at +13% by 2050 — modest demand growth; plan on rents tracking national, not racing it.
Negotiation context
- It's been on market 163 days — a 12% lower offer ($202k) is reasonable based on typical stale-listing flexibility.
Risks & watch-outs
- Climate carrying-cost: severe wind risk, 99% chance of damaging wind over 30y; moderate wildfire risk; extreme-heat days projected 7→21/yr by 2055 (HVAC capex compounding) — expect insurance premiums to compound above CPI over the hold.
Questions for the listing agent
- It's been on market 163 days. Have you received any prior offers? Is the seller open to a 23% concession, seller financing, or rate buy-down credit?
- Why hasn't it sold? Are there any deal-killer items the seller is aware of (foundation, flood, title, zoning, code violations)?
- Is there a deadline driving the sale (1031 exchange, divorce, estate, relocation)? That informs how much negotiation room exists.
- The area grade is low — what's the realistic commute time and amenity access for the typical tenant pool here? Any planned neighborhood developments (good or bad) we should know about?
- What's the average days-on-market for RENTAL listings here right now (not sales)? A rising rental-DOM trend means longer vacancies and softer asking-rent achievability than the comps imply.
- What's the recent tenant-quality profile in this submarket — average credit score on applications, eviction rate, late-payment / NSF rate, and stable-employment percentage? A property-management company in the area should have these aggregated.
- How much new for-sale + rental construction is in the pipeline within 1–3 miles? Heavy new supply typically softens prices + rents 12–24 months out; constrained supply supports both.
Investment metrics
- 1% rule
- 0.77% ✗
- Cap rate
- 6.55%
- Cash-on-cash
- 0.93%
- DSCR
- 1.04
- GRM
- 10.9
CMA / ARV
- ARV (median comp)
- $231,325
- List price
- $229,900
- Delta
- -0.62%
- Verdict
- FAIR
- Comps
- 20 within 1.0 mi
Projected returns pro-forma
-3.0% appreciation · 3.0% rent growth · sell at horizon
- IRR
- -14.9%
- Equity multiple
- 0.47×
- Total profit
- $-34,204
- Equity at exit
- $34,279
- IRR
- -6.4%
- Equity multiple
- 0.59×
- Total profit
- $-26,201
- Equity at exit
- $19,878
Cash invested: $64,372 (down + closing). Projections, not guarantees.
Landlord ↔ Tenant lean methodology
- Overall (STATE)
- 87 Strongly Landlord-Friendly
- State Florida
- 87 Strongly Landlord-Friendly · R+3
- County
- — inherits STATE
- City
- — inherits STATE
ZIP-level market 32179
- Home prices YoY
- -18.3%
- Active inventory
- 426
- Price-to-rent
- 10.9×
Monthly cashflow live
- Estimated rent
- $1,764 high interval (Pro) →
- Mortgage (P&I)
- −$1,206
- Tax from tax record
- −$42 /mo · $506/yr
- Insurance
- −$96
- HOA
- −$0
- Vacancy / Maint / Mgmt
- −$370
- Net cashflow
- $50
Break-even live
UW: 25.0% down · 7.5% · 30yr · 1.5% tax · 5.0% vac · 8.0% maint · 8.0% mgmt
Financing live
Cash to close
- Down payment
- $57,475
- Closing costs
- $6,897
- Reserves months
- —
- Total cash needed
- —
Loan-product check · same deal, 3 products live
Conventional
25% down · 7.5% · 30yr
- Down + closing
- —
- Monthly P&I
- —
- Monthly cashflow
- —
- DSCR
- —
- Eligible?
- —
Personal DTI + credit; lowest rate.
DSCR
20% down · 8.5% · 30yr
- Down + closing
- —
- Monthly P&I
- —
- Monthly cashflow
- —
- DSCR
- —
- Eligible?
- —
No personal income docs; deal must DSCR.
Hard money
10% down · 12.0% · 12mo
- Down + closing
- —
- Monthly P&I
- —
- Monthly cashflow
- —
- DSCR
- —
- Eligible?
- —
Short-term bridge; refi at stabilization.
Rent comps 10 comps
| Address | Beds | Baths | Sqft | Rent | $/sqft | DOM | Units | Dist |
|---|---|---|---|---|---|---|---|---|
| 35 Malauka Cir Ocklawaha, FL | 3.0 | 2.0 | 1371 | $1,700 | $1.24 | 21d | 1 | 0.13mi |
| 24 Malauka Loop Pl Ocklawaha, FL | 3.0 | 2.0 | 1319 | $1,625 | $1.23 | 13d | 1 | 0.16mi |
| 17 Malauka Loop Pl Ocklawaha, FL | 3.0 | 2.0 | 1322 | $1,550 | $1.17 | 13d | 1 | 0.22mi |
| 205 Malauka Loop Ocklawaha, FL | 3.0 | 2.0 | 1311 | $1,695 | $1.29 | 13d | 1 | 0.26mi |
| 1 Malauka Radial Cir Ocklawaha, FL | 4.0 | 2.0 | 1747 | $1,995 | $1.14 | 13d | 1 | 0.36mi |
| 338 Malauka Loop Ocklawaha, FL | 3.0 | 2.0 | 1311 | $1,895 | $1.45 | 13d | 1 | 0.36mi |
| 122 Malauka Loop Ocklawaha, FL | 3.0 | 2.0 | 1323 | $1,675 | $1.27 | 21d | 1 | 0.38mi |
| 9 Malauka Loop Ocklawaha, FL | 3.0 | 2.0 | 1389 | $1,625 | $1.17 | 21d | 1 | 0.54mi |
| 9 Malauka Loop Ln Ocklawaha, FL | 3.0 | 2.0 | 1319 | $1,625 | $1.23 | 21d | 1 | 0.54mi |
| 3 Fisher Place Dr Ocklawaha, FL | 3.0 | 2.0 | 1350 | $1,640 | $1.21 | 21d | 1 | 0.97mi |
Listing history 16 events
-
2026-06-18days on market $229,900 Active 163 DOM
-
2026-06-17days on market $229,900 Active 162 DOM
-
2026-06-16days on market $229,900 Active 161 DOM
-
2026-06-15days on market $229,900 Active 160 DOM
-
2026-06-14days on market $229,900 Active 158 DOM
-
2026-06-13days on market $229,900 Active 157 DOM
-
2026-06-10days on market $229,900 Active 155 DOM
-
2026-06-09days on market $229,900 Active 154 DOM
-
2026-06-08days on market $229,900 Active 153 DOM
-
2026-06-07days on market $229,900 Active 152 DOM
-
2026-06-03days on market $229,900 Active 148 DOM
-
2026-06-02days on market $229,900 Active 147 DOM
-
2026-05-31days on market $229,900 Active 145 DOM
-
2026-05-30days on market $229,900 Active 144 DOM
-
2026-01-12price $229,900 312-char remark
Show marketing remark (312 chars)
BEAUTIFUL BRAND-NEW Custom home. Pictures are of a Model Home and not the actual home. Block with stucco 3 bedroom, 2 bath with attached 2 car garage. Beautiful cabinets accent a gorgeous kitchen. Appliances include Refrigerator, Range with hood and Dishwasher. Walk-in closet in Master. High Efficiency windows.
-
2026-01-06$239,900 Active 312-char remark
Show marketing remark (312 chars)
BEAUTIFUL BRAND-NEW Custom home. Pictures are of a Model Home and not the actual home. Block with stucco 3 bedroom, 2 bath with attached 2 car garage. Beautiful cabinets accent a gorgeous kitchen. Appliances include Refrigerator, Range with hood and Dishwasher. Walk-in closet in Master. High Efficiency windows.
ⓘ Source: listings_history table (triggers on properties + properties_extension) + one-shot
backfill from property_details.listing_events for pre-trigger history.
Tax reassessment forecast FL · Resets to sale price
- Current annual tax
- $506 · $42/mo
- Projected year-2 tax
- $1,908 · $159/mo
- Expected delta
- +$1,402/yr (+$117/mo · 277.0%)
ⓘ Screening estimate from a state-policy table — verify with the county assessor before closing.
Climate risk First Street
- Flood 1/10 Low FEMA zone X (unshaded) · 0% chance over 30 yrs
- Wildfire 5/10 Major
- Heat 8/10 Severe 7 d/yr ≥108°F today · 21 d/yr by 30 yrs out
- Wind 9/10 Extreme 99% chance of damaging wind over 30 yrs
- Air quality 3/10 Moderate 3 unhealthy d/yr today · 4 by 30 yrs out
Nearby sold comps map
Loading sold comps map…
Walkable amenities ~0.75 mi
Loading nearby amenities…
Taxation est. · year 1
- Rental income
- $21,166
- − Mortgage interest
- −$12,878
- − Property taxes
- −$506
- − Insurance
- −$1,150
- − Repairs & maintenance
- −$1,693
- − Management
- −$1,693
- − Depreciation
- −$6,688
- Taxable loss
- −$3,442
- Est. tax savings @ 24.0%
- +$826
- After-tax cash flow
- $1,424/yr
For passive investors: Depreciation is non-cash, so a rental often shows a tax loss while cash-flowing — sheltering income. Rental losses are passive: they offset passive income freely, and up to $25,000/yr can offset ordinary (W-2) income if you actively participate and your MAGI is under $100k (phasing out to $0 by $150k); unused losses carry forward. On sale, claimed depreciation is recaptured at up to 25%, and gains may owe capital-gains tax (a 1031 exchange can defer both). Figures are a year-1 estimate at your 24.0% rate — not tax advice; consult a CPA.
Schools (NCES district)
- District
- Marion
- NCES district ID
- 1201260
- Math proficiency
- 42% ▼ -7.00%
- Reading proficiency
- 43% ▼ -4.00%
- Median HH income
- $40,015
- Composite
- 35.61/100
- National rank
- #4890
- State rank
- #61 of 73 in FL
Livability — Silver Springs Shores East
No livability data for this city. (Only ~50 U.S. cities are tracked.)
Census & demographics
- Census place
- Silver Springs Shores East, FL
- County
- Marion County · 315,796 people
- Metro
- Ocala, FL
- Population (ZIP)
- 9,318
- Household income
- $46,512
- Rent vs Own
- Severe rent burden
- 303.0
Population outlook (Marion County) Hauer SSP2
- Today (2025)
- 365,905 people
- By 2030
- 376,768 · +3.0%
- By 2040
- 396,555 · +8.4%
- By 2050
- 412,723 · +12.8%
- By 2075
- 446,090 · +21.9%
- By 2100
- 436,193 · +19.2%
Race, ethnicity, and origin ACS 2023
- Neighborhood character
- Predominantly White (81%)
- Race & ethnicity
- White 81% Two or more races 12% Hispanic / Latino 11%
- Hispanic origin (detail)
- Mexican 5% Puerto Rican 3% Cuban 3%
- Common ancestry
- Slovak 4% Romanian 2% Lithuanian 2%
- Foreign-born
- 5% · Canada
- Languages at home
- 93% English-only · Spanish 7%
Political lean MEDSL · Marion
- 2024 margin
- Solid R (+31.6) · D 33.8% · R 65.5%
- 2008→2024 swing
- -20.0pp toward R · 2008: -11.6pp · 2024: -31.6pp
- All cycles
- 2024: R+31.6 2020: R+25.9 2016: R+26.2 2012: R+16.2 2008: R+11.6
Not yet ingested
- Civics
- —
Market trends
- HPI YoY
- ▼ -54.21%
- Current HPI
- 242.0408
- Rent YoY
- —
- Metro
- Ocala, FL
- State GDP YoY
- ▲ 3.28%
- F500 in state
- 36
Industry mix (Fortune 500 HQ in FL)
| Industry | F500 HQs | Revenue |
|---|---|---|
| Industrial Technology | 2 | $29B |
|
||
| Insurance | 2 | $17B |
|
||
| Retail | 1 | $60B |
|
||
| Technology Distribution | 1 | $58B |
|
||
| Homebuilding | 1 | $35B |
|
||
| Technology Manufacturing | 1 | $35B |
|
||
Price history
-4.2% since first listed2 events — show timeline
- 2026-01-12 Price Changed $229,900 Stellar MLS as Distributed by MLS Grid
- 2026-01-06 Listed $239,900 Stellar MLS as Distributed by MLS Grid
Property tax history
+20.7%/yrLatest (2025): $506 · +170.1% YoY. Source: county tax records.
Cash-flow waterfall
monthlySold comps — $/sqft
last 12 mo · ≤1 miLoading sold comps…