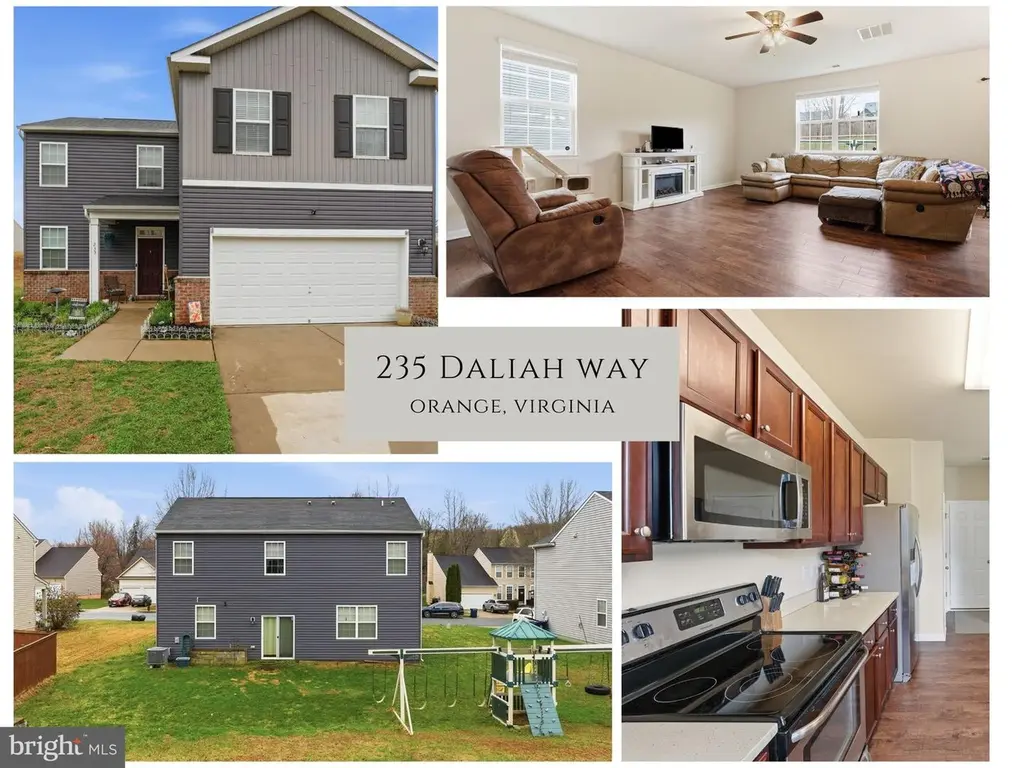
235 Daliah Way · Orange, VA
Flood risk 1/10 · Minimal
- FEMA flood zone
- X (unshaded)
- Chance of flooding over 30 yrs
- 0.0%
- Est. flood insurance / yr
- $507 – $1,088
Fire risk 3/10 · Minor
- Est. fire insurance / yr
- $666 – $1,236
Heat risk 7/10 · Major
- Hot days now (above 105°F)
- 7 days/yr
- Hot days in 30 yrs
- 18 days/yr
Wind risk 3/10 · Minor
- Chance of severe wind over 30 yrs
- 7.0%
Air-quality risk 2/10 · Minimal
- Unhealthy air days now
- 0 days/yr
- Unhealthy air days in 30 yrs
- 1 days/yr
Risk factors via First Street. Map © Google.
Why this score? — see what drove the D- grade
The composite is a weighted blend of 9 inputs, each scored 0–100. Each bar is that input's sub-score; the figure is the points it added to the 100-point composite (weight × sub-score).
- ARV discount +12.0/15.0
- Cash flow +8.2/30.0
- Schools +4.8/10.0
- Livability +3.7/5.0
- Rent growth +2.5/5.0
- Condition / age +2.5/5.0
- DSCR +2.2/10.0
- 1% rule +1.6/10.0
- Appreciation +0.7/10.0
$399,000
🖨 Deal sheet 📄 Offer letter ✓ Due diligence
Listing remarks
Back to active through no fault of the seller. The appraised value came in above current list price, and the seller is offering a seller subsidy towards cosmetic updates with an acceptable offer! Welcome to 235 Daliah Way in charming Orange, Virginia, where peaceful living and small-town character come together. Surrounded by the beauty and history of the area, enjoy scenic views of the Blue Ridge Mountains as you explore everything Orange has to offer. Conveniently located within an hour of Charlottesville and Fredericksburg, and less than two hours from Washington, DC and Richmond, this home offers the perfect balance of quiet living and accessibility, with local restaurants and attract
Key facts
- Spacious backyard
- Walk-in closets
- Scenic views
Tags
Property features AI
Finance
- Other: Property manager present; Pets allowed with no pet restrictions
- HOA & community: HOA fee $200 annually
Exterior
- Parking: Attached front-entry garage with 2 garage spaces
- Utilities: Public water; Public sewer; Municipal trash service; Cable TV available; Multiple phone lines; Underground utilities
- Home design: Detached single-family home; Built by D.R. Horton; Excellent condition; Fee simple ownership; In city limits
- Construction: Combination and brick exterior; Slab foundation; Double-pane insulated windows with screens; Building not winterized
- Exterior features: Play equipment in yard
Interior
- Kitchen: Dishwasher; Cooktop; Electric oven/range; Microwave; Refrigerator; Disposal
- Bedrooms: Four bedrooms on the upper level
- Bathrooms: Two full bathrooms; One half bathroom on the main level
- Heating & cooling: Heat pump(s) for heating and cooling; Programmable thermostat; Electric heating and cooling; Electric hot water
- Interior features: Open floor plan; Family room off kitchen; Kitchen island; Upgraded countertops; Attic access; 9'+ ceilings; Insulated and sliding glass doors; Not furnished
- Laundry & utility: Washer and dryer in unit; Has laundry
Neighborhood map
What this means for you Summary
Snapshot
- This is a 4-bed/2.5-bath single-family listed at $399k.
Deal economics
- At list price, monthly cash flow is $-372 ($-4k/yr) — negative.
- To cash-flow at today's rent, offer at most $333k (16.5% below list).
- To meet the 1% rule (rent ≥ 1% of price), the offer needs to be $263k (34.1% below list).
- Recommended offer: $263k (34.1% below list) — sets the bar for 1% rule.
- Cap rate 5.2% vs local median 3.7% in Orange — top-decile yield for the area; either an underpriced asset or a hidden risk that comps aren't pricing in. Stress-test before assuming the spread holds.
Location & tenants
- Location reads 74/100 on livability (#151 in VA, #4,842 nationally) — a middle-class / working-renter tenant base. Strengths: health & safety A+, housing A, cost of living A-; Watch: crime C-, employment D+, amenities D.
- Orange County Public School District (rural): math 47% / reading 64% proficiency, ranked #71 of 131 in VA (top 54%) — acceptable for families but not a draw, mixed tenant base, ~2y average lease.
- Zoned schools: Orange County High (math 61% / reading 72%, grade B, #195 of 319 statewide, top 62%, 1,476 students, 43% FRL).
- Market conditions: 127 active listings in the ZIP; 2 comparable units currently listed for rent nearby; 412 units permitted in Orange County in 2024 (0 in 5+ unit buildings).
Forward outlook
- Local home prices are declining (-3.0%/yr); year-one equity from $3k of loan paydown is wiped out by about $12k of value loss. Plan a longer hold.
- Orange County population projected at +18% by 2050 — long-run rental-demand tailwind backs the buy-and-hold thesis.
Negotiation context
- It's been on market 29 days — a 2% lower offer ($393k) is reasonable based on typical stale-listing flexibility.
- 5 sale attempts since 9y ago with the ask held roughly flat each time — persistent listings suggest the price (not the market) is what's stuck; bring a comps-based counter.
Risks & watch-outs
- Climate carrying-cost: extreme-heat days projected 7→18/yr by 2055 (HVAC capex compounding) — expect insurance premiums to compound above CPI over the hold.
Questions for the listing agent
- What do current leases actually rent for vs. the listed asking? Can we see a recent rent roll and the last 12 months of T-12 income?
- What does the HOA fee cover, when was the last increase, and are there any pending special assessments or reserve-fund shortfalls?
- Is there a deadline driving the sale (1031 exchange, divorce, estate, relocation)? That informs how much negotiation room exists.
- Schools are B-rated — typically a magnet for longer-tenancy family renters. What's the average tenant stay here, and is there a school-zone premium baked into asking?
- The area grade is low — what's the realistic commute time and amenity access for the typical tenant pool here? Any planned neighborhood developments (good or bad) we should know about?
- What's the average days-on-market for RENTAL listings here right now (not sales)? A rising rental-DOM trend means longer vacancies and softer asking-rent achievability than the comps imply.
- What's the recent tenant-quality profile in this submarket — average credit score on applications, eviction rate, late-payment / NSF rate, and stable-employment percentage? A property-management company in the area should have these aggregated.
- How much new for-sale + rental construction is in the pipeline within 1–3 miles? Heavy new supply typically softens prices + rents 12–24 months out; constrained supply supports both.
Investment metrics
- 1% rule
- 0.66% ✗
- Cap rate
- 5.17%
- Cash-on-cash
- -4.00%
- DSCR
- 0.82
- GRM
- 12.6
CMA / ARV
- ARV (median comp)
- $443,258
- List price
- $399,000
- Delta
- -9.98%
- Verdict
- FAIR
- Comps
- 20 within 1.0 mi
Show comp detail 12 sales within ~0.75 mi
| Address | Dist | Beds/Ba | Sqft | Sold | Price | $/sf | Match |
|---|---|---|---|---|---|---|---|
| 274 Parker Pl | 0.04mi | 4/2.5 | 2,265 (+2%) | 5mo | $411,000 | $181 | 91 |
| 608 Clover Ln | 0.27mi | 4/2.5 | 2,198 (-2%) | 5mo | $454,999 | $207 | 81 |
| 604 Clover Ln | 0.29mi | 4/2.5 | 2,198 (-2%) | 6mo | $425,000 | $193 | 79 |
| 269 Montevista Ave | 0.40mi | 4/2.5 | 2,238 (+0%) | 5mo | $425,000 | $190 | 77 |
| 628 Clover Ln | 0.28mi | 4/2.5 | 2,198 (-2%) | 10mo | $435,000 | $198 | 76 |
| 521 Aster Ln | 0.25mi | 3/2.5 (-1) | 2,198 (-2%) | 8mo | $454,999 | $207 | 74 |
| 516 Aster Ln | 0.20mi | 4/3.0 | 2,479 (+11%) | 3mo | $494,999 | $200 | 68 |
| 513 Aster Ln | 0.25mi | 4/3.0 | 1,986 (-11%) | 3mo | $399,999 | $201 | 66 |
| 601 Clover Ln | 0.29mi | 4/3.0 | 1,986 (-11%) | 2mo | $420,000 | $211 | 64 |
| 502 Aster Ln | 0.29mi | 4/3.0 | 1,986 (-11%) | 7mo | $429,999 | $217 | 60 |
| 627 Clover Ln | 0.29mi | 3/2.5 (-1) | 1,986 (-11%) | 9mo | $417,000 | $210 | 56 |
| 198 Peliso Ave | 0.58mi | 4/2.0 | 2,074 (-7%) | 10mo | $349,000 | $168 | 51 |
Match score weights: distance 35% · size 25% · config 20% · recency 20%. Top-matched comps best support the ARV.
Projected returns pro-forma
-3.0% appreciation · 3.0% rent growth · sell at horizon
- IRR
- -23.1%
- Equity multiple
- 0.21×
- Total profit
- $-88,519
- Equity at exit
- $59,492
- IRR
- -17.8%
- Equity multiple
- 0.03×
- Total profit
- $-108,222
- Equity at exit
- $34,498
Cash invested: $111,720 (down + closing). Projections, not guarantees.
Landlord ↔ Tenant lean methodology
- Overall (STATE)
- 55 Moderately Landlord-Leaning
- State Virginia
- 55 Moderately Landlord-Leaning · D+2
- County
- — inherits STATE
- City
- — inherits STATE
ZIP-level market 22960
- Home prices YoY
- -2.4%
- Active inventory
- 127
- Price-to-rent
- 12.6×
Monthly cashflow live
- Estimated rent
- $2,630 medium interval (Pro) →
- Mortgage (P&I)
- −$2,092
- Tax from tax record
- −$175 /mo · $2,097/yr
- Insurance
- −$166
- HOA
- −$17
- Vacancy / Maint / Mgmt
- −$552
- Net cashflow
- $-372
Break-even live
UW: 25.0% down · 7.5% · 30yr · 1.5% tax · 5.0% vac · 8.0% maint · 8.0% mgmt
Financing live
Cash to close
- Down payment
- $99,750
- Closing costs
- $11,970
- Reserves months
- —
- Total cash needed
- —
Loan-product check · same deal, 3 products live
Conventional
25% down · 7.5% · 30yr
- Down + closing
- —
- Monthly P&I
- —
- Monthly cashflow
- —
- DSCR
- —
- Eligible?
- —
Personal DTI + credit; lowest rate.
DSCR
20% down · 8.5% · 30yr
- Down + closing
- —
- Monthly P&I
- —
- Monthly cashflow
- —
- DSCR
- —
- Eligible?
- —
No personal income docs; deal must DSCR.
Hard money
10% down · 12.0% · 12mo
- Down + closing
- —
- Monthly P&I
- —
- Monthly cashflow
- —
- DSCR
- —
- Eligible?
- —
Short-term bridge; refi at stabilization.
Rent comps 2 comps
| Address | Beds | Baths | Sqft | Rent | $/sqft | DOM | Units | Dist |
|---|---|---|---|---|---|---|---|---|
| 615 Clover Ln Orange, VA | 4.0 | 2.0 | 1790 | $2,850 | $1.59 | 5d | 1 | 0.31mi |
| 191 Barbour St Orange, VA | 3.0 | 2.0 | 1722 | $2,000 | $1.16 | 1d | 1 | 0.86mi |
HOA detail
- Monthly dues
- $17 · $204/yr
Listing history 24 events
-
2026-06-18days on market $399,000 Active 29 DOM
-
2026-06-17days on market $399,000 Active 28 DOM
-
2026-06-16days on market $399,000 Active 27 DOM
-
2026-06-15days on market $399,000 Active 26 DOM
-
2026-06-13days on market $399,000 Active 24 DOM
-
2026-06-09days on market $399,000 Active 20 DOM
-
2026-06-08days on market $399,000 Active 19 DOM
-
2026-06-07days on market $399,000 Active 18 DOM
-
2026-06-04days on market $399,000 Active 15 DOM
-
2026-06-03days on market $399,000 Active 14 DOM
-
2026-06-02days on market $399,000 Active 13 DOM
-
2026-06-01days on market $399,000 Active 12 DOM
-
2026-05-31days on market $399,000 Active 11 DOM
-
2026-05-09historical Active Under Contract 1056-char remark
-
2026-05-07$399,000 Active 1056-char remark
-
2026-05-06historical
-
2026-03-19$410,000 Active
-
2026-03-12historical
-
2017-08-31historical
-
2017-07-04status Contract
-
2017-06-30historical Withdrawn
-
2017-05-26price
-
2017-05-03Active
-
2017-05-03$209,990
ⓘ Source: listings_history table (triggers on properties + properties_extension) + one-shot
backfill from property_details.listing_events for pre-trigger history.
Tax reassessment forecast VA · Resets to sale price
- Current annual tax
- $2,097 · $175/mo
- Projected year-2 tax
- $3,272 · $273/mo
- Expected delta
- +$1,175/yr (+$98/mo · 56.0%)
ⓘ Screening estimate from a state-policy table — verify with the county assessor before closing.
Climate risk First Street
- Flood 1/10 Low FEMA zone X (unshaded) · 0% chance over 30 yrs
- Wildfire 3/10 Moderate
- Heat 7/10 Severe 7 d/yr ≥105°F today · 18 d/yr by 30 yrs out
- Wind 3/10 Moderate 7% chance of damaging wind over 30 yrs
- Air quality 2/10 Low 0 unhealthy d/yr today · 1 by 30 yrs out
Nearby sold comps map
Loading sold comps map…
Walkable amenities ~0.75 mi
Loading nearby amenities…
Taxation est. · year 1
- Rental income
- $31,565
- − Mortgage interest
- −$22,350
- − Property taxes
- −$2,097
- − Insurance
- −$1,995
- − Repairs & maintenance
- −$2,525
- − Management
- −$2,525
- − HOA
- −$204
- − Depreciation
- −$11,607
- Taxable loss
- −$11,738
- Est. tax savings @ 24.0%
- +$2,817
- After-tax cash flow
- $-1,651/yr
For passive investors: Depreciation is non-cash, so a rental often shows a tax loss while cash-flowing — sheltering income. Rental losses are passive: they offset passive income freely, and up to $25,000/yr can offset ordinary (W-2) income if you actively participate and your MAGI is under $100k (phasing out to $0 by $150k); unused losses carry forward. On sale, claimed depreciation is recaptured at up to 25%, and gains may owe capital-gains tax (a 1031 exchange can defer both). Figures are a year-1 estimate at your 24.0% rate — not tax advice; consult a CPA.
Schools (NCES district)
- District
- Orange County Public School District
- NCES district ID
- 5102820
- Math proficiency
- 47% ▼ -35.00%
- Reading proficiency
- 64% ▼ -14.00%
- Median HH income
- $61,086
- Composite
- 48.34/100
- National rank
- #2147
- State rank
- #71 of 131 in VA
Livability — Orange
- Score
- 74/100
- State rank
- #151
- US rank
- #4842
Category grades
Schools grade is shown separately in the Schools card above.
Census & demographics
- Census place
- Orange, VA
- Population (ZIP)
- 10,877
Population outlook (Orange County) Hauer SSP2
- Today (2025)
- 38,758 people
- By 2030
- 40,411 · +4.3%
- By 2040
- 43,477 · +12.2%
- By 2050
- 45,856 · +18.3%
- By 2075
- 51,067 · +31.8%
- By 2100
- 51,387 · +32.6%
Race, ethnicity, and origin ACS 2023
- Neighborhood character
- Predominantly White (76%)
- Race & ethnicity
- White 76% Black 17% Two or more races 4% Hispanic / Latino 4%
- Common ancestry
- Portuguese 3% Lithuanian 1% Italian 1%
- Foreign-born
- 2% · Canada
- Languages at home
- 95% English-only · Spanish 3% German/W. Germanic 1% Other Indo-European 1%
Political lean MEDSL · Orange
- 2024 margin
- Strong R (+24.7) · D 37.2% · R 61.9%
- 2008→2024 swing
- -15.8pp toward R · 2008: -8.8pp · 2024: -24.7pp
- All cycles
- 2024: R+24.7 2020: R+21.4 2016: R+26.6 2012: R+14.5 2008: R+8.8
Not yet ingested
- Civics
- —
Market trends
- HPI YoY
- ▼ -8.60%
- Current HPI
- 350.4024
- Rent YoY
- —
- Metro
- —
- State GDP YoY
- ▲ 2.40%
- F500 in state
- 50
Industry mix (Fortune 500 HQ in VA)
| Industry | F500 HQs | Revenue |
|---|---|---|
| Aerospace / Defense | 4 | $236B |
|
||
| Technology / Defense | 3 | $32B |
|
||
| Financial Services | 2 | $176B |
|
||
| Utilities | 2 | $27B |
|
||
| Insurance | 2 | $25B |
|
||
| Technology | 2 | $15B |
|
||
Price history
+90.0% since first listed12 events — show timeline
- 2026-05-22 Relisted — BRIGHT MLS
- 2026-05-09 Contingent — BRIGHT MLS
- 2026-05-07 Listed $399,000 BRIGHT MLS
- 2026-05-06 Listing Removed — BRIGHT MLS
- 2026-03-19 Listed $410,000 BRIGHT MLS
- 2026-03-12 Coming Soon — BRIGHT MLS
- 2017-08-31 Listing Removed — BRIGHT MLS
- 2017-07-04 Pending — MRIS
- 2017-06-30 Delisted — MRIS
- 2017-05-26 Price Changed — MRIS
- 2017-05-03 Listed — MRIS
- 2017-05-03 Listed $209,990 BRIGHT MLS
Property tax history
+11.1%/yrLatest (2025): $2,097 · +12.9% YoY. Source: county tax records.
Cash-flow waterfall
monthlySold comps — $/sqft
last 12 mo · ≤1 miLoading sold comps…