 Duplex
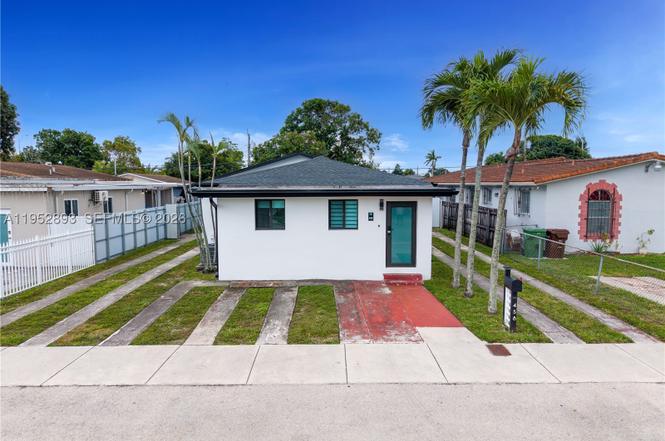
458 E 20th St · Hialeah, FL
Flood risk 1/10 · Minimal
- FEMA flood zone
- X (unshaded)
- Chance of flooding over 30 yrs
- 0.0%
- Est. flood insurance / yr
- $507 – $1,088
Fire risk 1/10 · Minimal
- Est. fire insurance / yr
- $947 – $1,759
Heat risk 10/10 · Severe
- Hot days now (above 105°F)
- 7 days/yr
- Hot days in 30 yrs
- 30 days/yr
Wind risk 10/10 · Severe
- Chance of severe wind over 30 yrs
- 99.0%
Air-quality risk 2/10 · Minimal
- Unhealthy air days now
- 1 days/yr
- Unhealthy air days in 30 yrs
- 1 days/yr
Risk factors via First Street. Map © Google.
Why this score? — see what drove the D- grade
The composite is a weighted blend of 9 inputs, each scored 0–100. Each bar is that input's sub-score; the figure is the points it added to the 100-point composite (weight × sub-score).
- Cash flow +11.7/30.0
- ARV discount +7.5/15.0
- Schools +4.2/10.0
- Livability +3.7/5.0
- DSCR +3.4/10.0
- 1% rule +3.0/10.0
- Rent growth +2.5/5.0
- Condition / age +2.5/5.0
- Appreciation +0.0/10.0
$849,999
🖨 Deal sheet 📄 Offer letter ✓ Due diligence
Multi-family units
County records classify this as Multi-Family (2-4 Unit). Listing-text estimate: 2 units. confirmed
Listing remarks MLS
Fully Remodeled Income-Producing Duplex – East Hialeah Discover this beautifully remodeled income-producing duplex located in the heart of East Hialeah. Situated in a safe and quiet neighborhood, this property combines modern comfort with unbeatable convenience. Enjoy walking-distance access to everyday essentials — supermarkets, Publix (approx. 12 blocks), and San Daniels (approx. 10 blocks). The Metrorail station is only about 4 blocks away, providing easy access to downtown and surrounding areas. Miami International Airport is conveniently located just 4.7 miles from the property. Both units have been fully renovated inside and out, featuring stylish finishes and thoughtful design throughout. Perfect for investors seeking reliable rental income or owner-occupants looking to live in one unit and rent out the other. Highlights: • Fully remodeled duplex — move-in ready • Excellent location in East Hialeah • Safe, quiet neighborhood • Walking distance to transit, shops, and dining • Just minutes from Miami International Airport • Ideal for investment or personal use Don’t miss this opportunity to own a beautifully updated property in one of Hialeah’s most convenient and desirable areas.
Key facts
- New gutters
- Updated bathrooms
- Updated kitchens
Tags
Property features AI
Finance
- Other: Rent includes trash collection
- Financial info: Some units are leased; Reported actual rent for unit types: $5,000
Exterior
- Parking: Total of 6 parking spaces; Some units list 'Parking: Space'
- Utilities: Cable available; Public sewer
- Home design: Single-story building; Block construction; Resale property
- Construction: Block construction
- Exterior features: Less than quarter acre lot
Interior
- Kitchen: Some units include refrigerator
- Bedrooms: Units include 2-bedroom and 3-bedroom configurations (multiple units)
- Flooring: Tile
- Bathrooms: Full bathrooms in units (each unit reports 2 full bathrooms)
- Heating & cooling: Central heating; Central air; Ceiling fans
- Interior features: Tile flooring
- Laundry & utility: Washer/dryer hookups in some units
Neighborhood map
What this means for you Summary
Snapshot
- This is a 2 × 2.5-bed/1.5-bath units multifamily listed at $850k.
Deal economics
- At list price, monthly cash flow is $-246 ($-3k/yr) — negative. Per door: $-123/mo.
- To cash-flow at today's rent, offer at most $807k (5.1% below list).
- To meet the 1% rule (rent ≥ 1% of price), the offer needs to be $677k (20.3% below list).
- Recommended offer: $677k (20.3% below list) — sets the bar for 1% rule.
- Cap rate 5.9% vs local median 3.5% in Hialeah — top-decile yield for the area; either an underpriced asset or a hidden risk that comps aren't pricing in. Stress-test before assuming the spread holds.
Location & tenants
- Location reads 74/100 on livability (#288 in FL, #4,774 nationally) — a middle-class / working-renter tenant base. Strengths: commute A+, health & safety A+; Watch: amenities F, employment D-.
- Miami-Dade (suburban): math 45% / reading 54% proficiency, ranked #40 of 73 in FL (top 55%) — families likely to look elsewhere, expect single-tenant / working-renter base with shorter leases; 64% free/reduced lunch — lower-income household profile, screen leases tightly.
- Market conditions: Rents soft (-0.1%/yr); 111 active listings in the ZIP; 10,051 units permitted in Miami-Dade County in 2024 (7,758 in 5+ unit buildings).
- At $6,772/mo this rent would consume 134% of the median local household income ($61k/yr) (locally 1352% of renters already pay >50% of income on rent) — very limited rent-growth headroom before tenants either downsize or default.
Forward outlook
- Local home prices are declining (-3.0%/yr); year-one equity from $6k of loan paydown is wiped out by about $26k of value loss. Plan a longer hold.
- Miami-Dade County population projected at +28% by 2050 — long-run rental-demand tailwind backs the buy-and-hold thesis.
Negotiation context
- It's been on market 143 days — a 12% lower offer ($748k) is reasonable based on typical stale-listing flexibility.
- 10 sale attempts since 13y ago; this cycle's ask has dropped $150k (15%) from the opening price — seller is motivated, your offer sets the floor, not the list.
- Current owner paid $97k; list at $850k implies a 776% gain — meaningful room to come down on a strong offer.
Risks & watch-outs
- Watch-outs: built in 1946 — expect roof / HVAC / electrical / plumbing capex.
- Climate carrying-cost: severe wind risk, 99% chance of damaging wind over 30y; extreme-heat days projected 7→30/yr by 2055 (HVAC capex compounding) — expect insurance premiums to compound above CPI over the hold.
Questions for the listing agent
- What do current leases actually rent for vs. the listed asking? Can we see a recent rent roll and the last 12 months of T-12 income?
- It's been on market 143 days. Have you received any prior offers? Is the seller open to a 20% concession, seller financing, or rate buy-down credit?
- Can we see the unit-by-unit rent roll, current vacancy, and any below-market leases? What's the average tenancy length?
- What capital expenditures (roof, boiler, parking lot, exteriors) have been made in the last 5 years, and what's planned in the next 2?
- Built in 1946 — when were the roof, HVAC, electrical panel, plumbing, and water heater last replaced?
- Why hasn't it sold? Are there any deal-killer items the seller is aware of (foundation, flood, title, zoning, code violations)?
- Is there a deadline driving the sale (1031 exchange, divorce, estate, relocation)? That informs how much negotiation room exists.
- The area grade is low — what's the realistic commute time and amenity access for the typical tenant pool here? Any planned neighborhood developments (good or bad) we should know about?
- What's the average days-on-market for RENTAL listings here right now (not sales)? A rising rental-DOM trend means longer vacancies and softer asking-rent achievability than the comps imply.
- What's the recent tenant-quality profile in this submarket — average credit score on applications, eviction rate, late-payment / NSF rate, and stable-employment percentage? A property-management company in the area should have these aggregated.
- How much new apartment / multifamily construction is in the pipeline within 1–3 miles? Heavy new supply (>2% of stock underway) typically softens rents 12–24 months out; light construction supports rent growth.
Investment metrics
- 1% rule
- 0.80% ✗
- Cap rate
- 5.95%
- Cash-on-cash
- -1.24%
- DSCR
- 0.94
- GRM
- 10.5
CMA / ARV
No comps found within radius.
Projected returns pro-forma
-3.0% appreciation · 0.0% rent growth · sell at horizon
- IRR
- -21.6%
- Equity multiple
- 0.27×
- Total profit
- $-173,308
- Equity at exit
- $126,738
- IRR
- -24.1%
- Equity multiple
- -0.04×
- Total profit
- $-248,051
- Equity at exit
- $73,492
Cash invested: $238,000 (down + closing). Projections, not guarantees.
Landlord ↔ Tenant lean methodology
- Overall (STATE)
- 87 Strongly Landlord-Friendly
- State Florida
- 87 Strongly Landlord-Friendly · R+3
- County
- — inherits STATE
- City
- — inherits STATE
ZIP-level market 33013
- Rents YoY
- -0.1%
- Active inventory
- 111
- Price-to-rent
- 20.9×
Monthly cashflow live
- Estimated rent
- $6,772 medium interval (Pro) →
- Mortgage (P&I)
- −$4,457
- Tax from tax record
- −$784 /mo · $9,409/yr
- Insurance
- −$354
- HOA
- −$0
- Vacancy / Maint / Mgmt
- −$1,422
- Net cashflow
- $-246
Break-even live
2-unit breakdown (identical units grouped — click to expand)
| Units | Beds | Baths | Est. rent |
|---|---|---|---|
| 2× units | 2.5 | 1.5 | $6,772 |
| #1 | 2.5 | 1.5 | $3,386 |
| #2 | 2.5 | 1.5 | $3,386 |
| Total (2 units) | $6,772 | ||
UW: 25.0% down · 7.5% · 30yr · 1.5% tax · 5.0% vac · 8.0% maint · 8.0% mgmt
Financing live
Cash to close
- Down payment
- $212,500
- Closing costs
- $25,500
- Reserves months
- —
- Total cash needed
- —
Loan-product check · same deal, 3 products live
Conventional
25% down · 7.5% · 30yr
- Down + closing
- —
- Monthly P&I
- —
- Monthly cashflow
- —
- DSCR
- —
- Eligible?
- —
Personal DTI + credit; lowest rate.
DSCR
20% down · 8.5% · 30yr
- Down + closing
- —
- Monthly P&I
- —
- Monthly cashflow
- —
- DSCR
- —
- Eligible?
- —
No personal income docs; deal must DSCR.
Hard money
10% down · 12.0% · 12mo
- Down + closing
- —
- Monthly P&I
- —
- Monthly cashflow
- —
- DSCR
- —
- Eligible?
- —
Short-term bridge; refi at stabilization.
Listing history 43 events
-
2026-06-18days on market $849,999 Active 143 DOM
-
2026-06-17days on market $849,999 Active 142 DOM
-
2026-06-16days on market $849,999 Active 141 DOM
-
2026-06-15days on market $849,999 Active 140 DOM
-
2026-06-13days on market $849,999 Active 138 DOM
-
2026-06-09days on market $849,999 Active 134 DOM
-
2026-06-08days on market $849,999 Active 133 DOM
-
2026-06-07days on market $849,999 Active 132 DOM
-
2026-06-04days on market $849,999 Active 129 DOM
-
2026-06-03days on market $849,999 Active 128 DOM
-
2026-06-02statusdays on market $849,999 Active 127 DOM
-
2026-06-01days on market $849,999 Active Under Contract 126 DOM
-
2026-05-31days on market $849,999 Active Under Contract 125 DOM
-
2026-03-27historical Active Under Contract
-
2026-03-02price $849,999
-
2026-01-26$999,999 Active
-
2025-11-12$1,200,000 Active 1272-char remark
Show marketing remark (1272 chars)
Fully Remodeled Income-Producing Duplex – East Hialeah Discover this beautifully remodeled income-producing duplex located in the heart of East Hialeah. Situated in a safe and quiet neighborhood, this property combines modern comfort with unbeatable convenience. Enjoy walking-distance access to everyday essentials — supermarkets, Publix (approx. 12 blocks), and San Daniels (approx. 10 blocks). The Metrorail station is only about 4 blocks away, providing easy access to downtown and surrounding areas. Miami International Airport is conveniently located just 4.7 miles from the property. Both units have been fully renovated inside and out, featuring stylish finishes and thoughtful design throughout. Perfect for investors seeking reliable rental income or owner-occupants looking to live in one unit and rent out the other. Highlights: • Fully remodeled duplex — move-in ready • Excellent location in East Hialeah • Safe, quiet neighborhood • Walking distance to transit, shops, and dining • Just minutes from Miami International Airport • Ideal for investment or personal use Don’t miss this opportunity to own a beautifully updated property in one of Hialeah’s most convenient and desirable areas.
-
2017-08-09status Pending
-
2017-04-24status Active
-
2017-04-14historical
-
2017-04-14historical
-
2017-04-14price $444,500
-
2017-02-14price $385,000
-
2017-02-14status Active
-
2017-02-06historical
-
2016-10-19price $295,000
-
2016-08-01$450,000 Active
-
2016-07-17historical
-
2016-01-15$350,000 Active
-
2014-12-13historical
-
2014-08-22price $267,000
-
2014-06-08$275,000 Active
-
2013-09-18historical
-
2013-08-27price $225,000
-
2013-06-19status Active
-
2013-05-15historical
-
2013-04-30status Active
-
2013-04-30historical
-
2013-04-05$205,000 Active
-
2012-03-13soldstatus $97,000
-
1995-01-13soldstatus $83,900
-
1993-11-15soldstatus $70,500
-
1993-01-20soldstatus $57,000
ⓘ Source: listings_history table (triggers on properties + properties_extension) + one-shot
backfill from property_details.listing_events for pre-trigger history.
Tax reassessment forecast FL · Resets to sale price
- Current annual tax
- $9,409 · $784/mo
- Projected year-2 tax
- $9,409 · $784/mo
- Expected delta
- $0/yr ($0/mo · 0.0%)
ⓘ Screening estimate from a state-policy table — verify with the county assessor before closing.
Climate risk First Street
- Flood 1/10 Low FEMA zone X (unshaded) · 0% chance over 30 yrs
- Wildfire 1/10 Low
- Heat 10/10 Extreme 7 d/yr ≥105°F today · 30 d/yr by 30 yrs out
- Wind 10/10 Extreme 99% chance of damaging wind over 30 yrs
- Air quality 2/10 Low 1 unhealthy d/yr today · 1 by 30 yrs out
Nearby sold comps map
Loading sold comps map…
Walkable amenities ~0.75 mi
Loading nearby amenities…
Taxation est. · year 1
- Rental income
- $81,264
- − Mortgage interest
- −$47,613
- − Property taxes
- −$9,409
- − Insurance
- −$4,250
- − Repairs & maintenance
- −$6,501
- − Management
- −$6,501
- − Depreciation
- −$24,727
- Taxable loss
- −$17,737
- Est. tax savings @ 24.0%
- +$4,257
- After-tax cash flow
- $1,307/yr
For passive investors: Depreciation is non-cash, so a rental often shows a tax loss while cash-flowing — sheltering income. Rental losses are passive: they offset passive income freely, and up to $25,000/yr can offset ordinary (W-2) income if you actively participate and your MAGI is under $100k (phasing out to $0 by $150k); unused losses carry forward. On sale, claimed depreciation is recaptured at up to 25%, and gains may owe capital-gains tax (a 1031 exchange can defer both). Figures are a year-1 estimate at your 24.0% rate — not tax advice; consult a CPA.
Schools (NCES district)
- District
- Miami-Dade
- NCES district ID
- 1200390
- Math proficiency
- 45% ▼ -16.00%
- Reading proficiency
- 54% ▼ -5.00%
- Median HH income
- $43,928
- Composite
- 41.76/100
- National rank
- #3397
- State rank
- #40 of 73 in FL
Livability — Hialeah
- Score
- 74/100
- State rank
- #288
- US rank
- #4774
Category grades
Schools grade is shown separately in the Schools card above.
Census & demographics
- Census place
- Hialeah, FL
- County
- Miami-Dade County · 2,697,751 people
- City population
- 315,776
- Metro
- Miami-Fort Lauderdale-Pompano Beach, FL
- Population (ZIP)
- 30,695
- Household income
- $60,658
- Rent vs Own
- Severe rent burden
- 1352.0
Population outlook (Miami-Dade County) Hauer SSP2
- Today (2025)
- 3,126,439 people
- By 2030
- 3,325,765 · +6.4%
- By 2040
- 3,697,561 · +18.3%
- By 2050
- 4,012,134 · +28.3%
- By 2075
- 4,605,612 · +47.3%
- By 2100
- 4,866,598 · +55.7%
Race, ethnicity, and origin ACS 2023
- Neighborhood character
- Predominantly Hispanic (94%)
- Race & ethnicity
- Hispanic / Latino 94% Two or more races 56% White 5%
- Hispanic origin (detail)
- Puerto Rican 1% Cuban 82%
- Foreign-born
- 74% · Canada, Jamaica
- Languages at home
- 9% English-only · Spanish 90%
Political lean MEDSL · Miami-Dade
- 2024 margin
- R (+11.4) · D 43.9% · R 55.4%
- 2008→2024 swing
- -27.6pp toward R · 2008: 16.1pp · 2024: -11.4pp
- All cycles
- 2024: R+11.4 2020: D+7.3 2016: D+29.6 2012: D+23.7 2008: D+16.1
Not yet ingested
- Civics
- —
Market trends
- HPI YoY
- ▼ -664.57%
- Current HPI
- 429.3973
- Rent YoY
- ▼ -0.13%
- Metro
- Miami-Fort Lauderdale-Pompano Beach, FL
- State GDP YoY
- ▲ 3.28%
- F500 in state
- 36
Industry mix (Fortune 500 HQ in FL)
| Industry | F500 HQs | Revenue |
|---|---|---|
| Industrial Technology | 2 | $29B |
|
||
| Insurance | 2 | $17B |
|
||
| Retail | 1 | $60B |
|
||
| Technology Distribution | 1 | $58B |
|
||
| Homebuilding | 1 | $35B |
|
||
| Technology Manufacturing | 1 | $35B |
|
||
Price history
+1391.2% since first listed30 events — show timeline
- 2026-03-27 Contingent — MARMLS
- 2026-03-02 Price Changed $849,999 MARMLS
- 2026-01-26 Listed $999,999 MARMLS
- 2025-11-12 Listed $1,200,000 Fizber.com
- 2017-08-09 Pending — MARMLS
- 2017-04-24 Relisted — MARMLS
- 2017-04-14 Listing Removed — MARMLS
- 2017-04-14 Listing Removed — MARMLS
- 2017-04-14 Price Changed $444,500 MARMLS
- 2017-02-14 Price Changed $385,000 MARMLS
- 2017-02-14 Relisted — MARMLS
- 2017-02-06 Listing Removed — MARMLS
- 2016-10-19 Price Changed $295,000 MARMLS
- 2016-08-01 Listed $450,000 MARMLS
- 2016-07-17 Listing Removed — MARMLS
- 2016-01-15 Listed $350,000 MARMLS
- 2014-12-13 Listing Removed — MARMLS
- 2014-08-22 Price Changed $267,000 MARMLS
- 2014-06-08 Listed $275,000 MARMLS
- 2013-09-18 Listing Removed — MARMLS
- 2013-08-27 Price Changed $225,000 MARMLS
- 2013-06-19 Relisted — MARMLS
- 2013-05-15 Listing Removed — MARMLS
- 2013-04-30 Relisted — MARMLS
- 2013-04-30 Listing Removed — MARMLS
- 2013-04-05 Listed $205,000 MARMLS
- 2012-03-13 Sold (MLS) $97,000 MARMLS
- 1995-01-13 Sold (Public Records) $83,900 Public Records
- 1993-11-15 Sold (Public Records) $70,500 Public Records
- 1993-01-20 Sold (Public Records) $57,000 Public Records
Property tax history
+9.6%/yrLatest (2025): $9,409 · +8.0% YoY. Source: county tax records.
Cash-flow waterfall
monthlySold comps — $/sqft
last 12 mo · ≤1 miLoading sold comps…