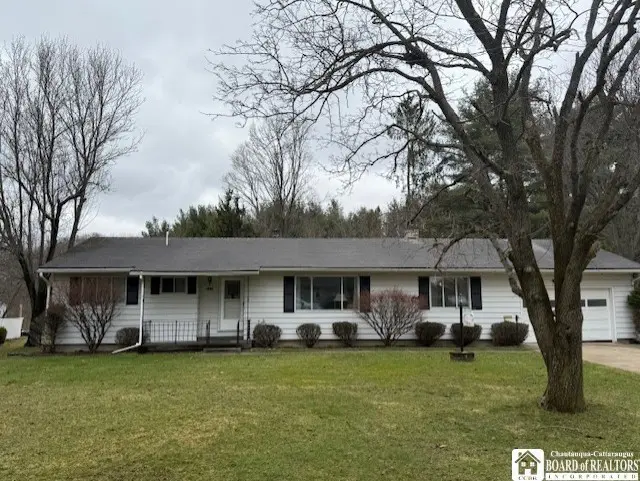
3428 Fortune Dr · Allegany, NY
Flood risk 1/10 · Minimal
- FEMA flood zone
- X
- Chance of flooding over 30 yrs
- 0.0%
- Est. flood insurance / yr
- $473 – $860
Fire risk 2/10 · Minimal
- Est. fire insurance / yr
- $691 – $1,283
Heat risk 2/10 · Minimal
- Hot days now (above 90°F)
- 7 days/yr
- Hot days in 30 yrs
- 18 days/yr
Wind risk 1/10 · Minimal
- Chance of severe wind over 30 yrs
- —
Air-quality risk 1/10 · Minimal
- Unhealthy air days now
- 0 days/yr
- Unhealthy air days in 30 yrs
- 0 days/yr
Risk factors via First Street. Map © Google.
Why this score? — see what drove the D grade
The composite is a weighted blend of 9 inputs, each scored 0–100. Each bar is that input's sub-score; the figure is the points it added to the 100-point composite (weight × sub-score).
- ARV discount +12.8/15.0
- Appreciation +10.0/10.0
- Schools +5.2/10.0
- Cash flow +3.7/30.0
- Livability +3.6/5.0
- Rent growth +2.5/5.0
- Condition / age +2.5/5.0
- 1% rule +0.7/10.0
- DSCR +0.0/10.0
$209,000
🖨 Deal sheet (PDF) 📄 Offer letter ✓ Due diligence
Listing remarks MLS
Charming three-bedroom ranch offering comfort, space, and a peaceful setting. The spacious eat-in kitchen flows seamlessly into a cozy sitting area with gas fireplace—perfect for relaxing or entertaining. Both the living and dining rooms feature beautiful hardwood flooring, adding warmth and character throughout. Enjoy the convenience of first-floor laundry and a bright sunroom that overlooks the private, tree-lined backyard. The outdoor space provides a true country feel, where deer can often be seen roaming year-round. Additional highlights include a one-car attached garage, plus a second detached garage with electric—ideal for a workshop, hobby space, or extra storage—along with a separate shed for all your gardening needs.
Key facts
- Tree lined property
- Private backyard
- Eat in kitchen
Tags
Neighborhood map
What this means for you Summary
Snapshot
- This is a 3-bed/1.5-bath single-family listed at $209k.
Deal economics
- At list price, monthly cash flow is $-612 ($-7k/yr) — negative.
- To cash-flow at today's rent, offer at most $101k (51.7% below list).
- To meet the 1% rule (rent ≥ 1% of price), the offer needs to be $120k (42.7% below list).
- Recommended offer: $101k (51.7% below list) — sets the bar for cash-flow.
Location & tenants
- Location reads 71/100 on livability (#395 in NY) — a middle-class / working-renter tenant base. Strengths: cost of living A+, housing A+, crime A; Watch: health & safety C-, amenities F, commute F.
- Allegany-Limestone Central School District (rural): math 55% / reading 67% proficiency, ranked #233 of 590 in NY (top 40%) — acceptable for families but not a draw, mixed tenant base, ~2y average lease.
- Market conditions: 47 active listings in the ZIP; 128 units permitted in Cattaraugus County in 2024 (21 in 5+ unit buildings).
Forward outlook
- In year one you build about $22k of equity ($1k loan paydown + $21k appreciation (10.0% local appreciation)).
- Cattaraugus County population projected at -28% by 2050 — secular population decline; favor cash flow + early exit over multi-decade hold.
- By year 2, paydown + projected appreciation supports a ~$36k cash-out refi (75% LTV) — recoverable capital for the next deal without selling this one.
Negotiation context
- It's been on market 86 days — a 6% lower offer ($196k) is reasonable based on typical stale-listing flexibility.
- Current owner paid $131k; list at $209k implies a 59% gain — meaningful room to come down on a strong offer.
Risks & watch-outs
- Watch-outs: built in 1959 — expect roof / HVAC / electrical / plumbing capex.
Questions for the listing agent
- What do current leases actually rent for vs. the listed asking? Can we see a recent rent roll and the last 12 months of T-12 income?
- It's been on market 86 days. Have you received any prior offers? Is the seller open to a 52% concession, seller financing, or rate buy-down credit?
- Built in 1959 — when were the roof, HVAC, electrical panel, plumbing, and water heater last replaced?
- Why hasn't it sold? Are there any deal-killer items the seller is aware of (foundation, flood, title, zoning, code violations)?
- Is there a deadline driving the sale (1031 exchange, divorce, estate, relocation)? That informs how much negotiation room exists.
- Schools are B-rated — typically a magnet for longer-tenancy family renters. What's the average tenant stay here, and is there a school-zone premium baked into asking?
- The area grade is low — what's the realistic commute time and amenity access for the typical tenant pool here? Any planned neighborhood developments (good or bad) we should know about?
- What's the average days-on-market for RENTAL listings here right now (not sales)? A rising rental-DOM trend means longer vacancies and softer asking-rent achievability than the comps imply.
- What's the recent tenant-quality profile in this submarket — average credit score on applications, eviction rate, late-payment / NSF rate, and stable-employment percentage? A property-management company in the area should have these aggregated.
- How much new for-sale + rental construction is in the pipeline within 1–3 miles? Heavy new supply typically softens prices + rents 12–24 months out; constrained supply supports both.
Investment metrics
- 1% rule
- 0.57% ✗
- Cap rate
- 2.78%
- Cash-on-cash
- -12.55%
- DSCR
- 0.44
- GRM
- 14.5
CMA / ARV
- ARV (median comp)
- $236,751
- List price
- $209,000
- Delta
- -11.72%
- Verdict
- UNDERPRICED
- Comps
- 20 within 1.0 mi
Show comp detail 10 sales within ~0.75 mi
| Address | Dist | Beds/Ba | Sqft | Sold | Price | $/sf | Match |
|---|---|---|---|---|---|---|---|
| 118 N 3rd St | 0.46mi | 3/1.5 | 1,540 (-1%) | 8mo | $190,000 | $123 | 70 |
| 157 N 2nd St | 0.57mi | 3/1.5 | 1,618 (+4%) | 2mo | $175,000 | $108 | 66 |
| 108 Jefferson Ave | 0.41mi | 4/1.5 (+1) | 1,566 (+1%) | 15mo | $212,000 | $135 | 62 |
| 80 Sherwood Dr | 0.42mi | 3/2.5 | 1,512 (-3%) | 14mo | $220,500 | $146 | 60 |
| 17 Oak St | 0.58mi | 3/2.0 | 1,650 (+6%) | 7mo | $290,000 | $176 | 55 |
| 129 N 5th St | 0.33mi | 4/2.0 (+1) | 1,458 (-6%) | 16mo | $174,000 | $119 | 54 |
| 89 N 1st St | 0.66mi | 3/1.5 | 1,500 (-4%) | 21mo | $120,000 | $80 | 46 |
| 17 N 6th St | 0.60mi | 3/2.0 | 1,377 (-12%) | 7mo | $95,000 | $69 | 45 |
| 68 N 4th St | 0.49mi | 3/1.5 | 1,404 (-10%) | 23mo | $255,000 | $182 | 42 |
| 47 N 3rd St | 0.55mi | 3/2.0 | 1,384 (-11%) | 22mo | $170,000 | $123 | 36 |
Match score weights: distance 35% · size 25% · config 20% · recency 20%. Top-matched comps best support the ARV.
Projected returns pro-forma
10.0% appreciation · 3.0% rent growth · sell at horizon
- IRR
- 15.5%
- Equity multiple
- 2.28×
- Total profit
- $74,924
- Equity at exit
- $188,284
- IRR
- 15.1%
- Equity multiple
- 5.30×
- Total profit
- $251,476
- Equity at exit
- $406,041
Cash invested: $58,520 (down + closing). Projections, not guarantees.
Landlord ↔ Tenant lean methodology
- Overall (STATE)
- 15 Strongly Tenant-Friendly
- State New York
- 15 Strongly Tenant-Friendly · D+10
- County
- — inherits STATE
- City
- — inherits STATE
ZIP-level market 14706
- Home prices YoY
- 10.5%
- Active inventory
- 47
- Price-to-rent
- 14.5×
Monthly cashflow live
- Estimated rent
- $1,197 medium interval (Pro) →
- Mortgage (P&I)
- −$1,096
- Tax from tax record
- −$375 /mo · $4,498/yr
- Insurance
- −$87
- HOA
- −$0
- Vacancy / Maint / Mgmt
- −$251
- Net cashflow
- $-612
Break-even live
Sensitivity live
| Price | -10% $-494 | -5% $-553 | +0% $-612 | +5% $-671 | +10% $-730 |
|---|---|---|---|---|---|
| Rent | -10% $-707 | -5% $-659 | +0% $-612 | +5% $-565 | +10% $-518 |
| Rate | -1.0pp $-507 | -0.5pp $-559 | base $-612 | +0.5pp $-666 | +1.0pp $-721 |
UW: 25.0% down · 7.5% · 30yr · 1.5% tax · 5.0% vac · 8.0% maint · 8.0% mgmt
Financing live
Cash to close
- Down payment
- $52,250
- Closing costs
- $6,270
- Reserves months
- —
- Total cash needed
- —
Loan-product check · same deal, 3 products live
Conventional
25% down · 7.5% · 30yr
- Down + closing
- —
- Monthly P&I
- —
- Monthly cashflow
- —
- DSCR
- —
- Eligible?
- —
Personal DTI + credit; lowest rate.
DSCR
20% down · 8.5% · 30yr
- Down + closing
- —
- Monthly P&I
- —
- Monthly cashflow
- —
- DSCR
- —
- Eligible?
- —
No personal income docs; deal must DSCR.
Hard money
10% down · 12.0% · 12mo
- Down + closing
- —
- Monthly P&I
- —
- Monthly cashflow
- —
- DSCR
- —
- Eligible?
- —
Short-term bridge; refi at stabilization.
Listing history 19 events
-
2026-06-21days on market $209,000 Active 86 DOM
-
2026-06-21days on market $209,000 Active 85 DOM
-
2026-06-18days on market $209,000 Active 83 DOM
-
2026-06-17days on market $209,000 Active 82 DOM
-
2026-06-16days on market $209,000 Active 81 DOM
-
2026-06-15days on market $209,000 Active 80 DOM
-
2026-06-13days on market $209,000 Active 78 DOM
-
2026-06-12pricedays on market $209,000 Active 77 DOM
-
2026-06-09days on market $229,900 Active 74 DOM
-
2026-06-08days on market $229,900 Active 73 DOM
-
2026-06-07days on market $229,900 Active 72 DOM
-
2026-06-07days on market $229,900 Active 71 DOM
-
2026-06-04days on market $229,900 Active 68 DOM
-
2026-06-02days on market $229,900 Active 67 DOM
-
2026-06-01days on market $229,900 Active 66 DOM
-
2026-05-31days on market $229,900 Active 65 DOM
-
2026-04-09price $229,900 754-char remark
Show marketing remark (754 chars)
Charming three-bedroom ranch offering comfort, space, and a peaceful setting. The spacious eat-in kitchen flows seamlessly into a cozy sitting area with gas fireplace—perfect for relaxing or entertaining. Both the living and dining rooms feature beautiful hardwood flooring, adding warmth and character throughout. Enjoy the convenience of first-floor laundry and a bright sunroom that overlooks the private, tree-lined backyard. The outdoor space provides a true country feel, where deer can often be seen roaming year-round. Additional highlights include a one-car attached garage, plus a second detached garage with electric—ideal for a workshop, hobby space, or extra storage—along with a separate shed for all your gardening needs.
-
2026-03-27$249,000 Active 754-char remark
Show marketing remark (754 chars)
Charming three-bedroom ranch offering comfort, space, and a peaceful setting. The spacious eat-in kitchen flows seamlessly into a cozy sitting area with gas fireplace—perfect for relaxing or entertaining. Both the living and dining rooms feature beautiful hardwood flooring, adding warmth and character throughout. Enjoy the convenience of first-floor laundry and a bright sunroom that overlooks the private, tree-lined backyard. The outdoor space provides a true country feel, where deer can often be seen roaming year-round. Additional highlights include a one-car attached garage, plus a second detached garage with electric—ideal for a workshop, hobby space, or extra storage—along with a separate shed for all your gardening needs.
-
2003-05-02soldstatus $131,100
ⓘ Source: listings_history table (triggers on properties + properties_extension) + one-shot
backfill from property_details.listing_events for pre-trigger history.
Tax reassessment forecast NY · Partial reset (capped growth)
- Current annual tax
- $4,498 · $375/mo
- Projected year-2 tax
- $4,498 · $375/mo
- Expected delta
- $0/yr ($0/mo · 0.0%)
ⓘ Screening estimate from a state-policy table — verify with the county assessor before closing.
Climate risk First Street
- Flood 1/10 Low FEMA zone X · 0% chance over 30 yrs
- Wildfire 2/10 Low
- Heat 2/10 Low 7 d/yr ≥90°F today · 18 d/yr by 30 yrs out
- Wind 1/10 Low
- Air quality 1/10 Low 0 unhealthy d/yr today · 0 by 30 yrs out
Nearby sold comps map
Loading sold comps map…
Walkable amenities ~0.75 mi
Loading nearby amenities…
Taxation est. · year 1
- Rental income
- $14,365
- − Mortgage interest
- −$11,707
- − Property taxes
- −$4,498
- − Insurance
- −$1,045
- − Repairs & maintenance
- −$1,149
- − Management
- −$1,149
- − Depreciation
- −$6,080
- Taxable loss
- −$11,263
- Est. tax savings @ 24.0%
- +$2,703
- After-tax cash flow
- $-4,643/yr
For passive investors: Depreciation is non-cash, so a rental often shows a tax loss while cash-flowing — sheltering income. Rental losses are passive: they offset passive income freely, and up to $25,000/yr can offset ordinary (W-2) income if you actively participate and your MAGI is under $100k (phasing out to $0 by $150k); unused losses carry forward. On sale, claimed depreciation is recaptured at up to 25%, and gains may owe capital-gains tax (a 1031 exchange can defer both). Figures are a year-1 estimate at your 24.0% rate — not tax advice; consult a CPA.
Schools (NCES district)
- District
- Allegany-Limestone Central School District
- NCES district ID
- 3600015
- Math proficiency
- 55% ▼ -5.00%
- Reading proficiency
- 67% ▲ 17.00%
- Median HH income
- $47,850
- Composite
- 51.66/100
- National rank
- #1696
- State rank
- #233 of 590 in NY
Livability — Allegany
- Score
- 71/100
- State rank
- #395
- US rank
- #6843
Category grades
Schools grade is shown separately in the Schools card above.
Census & demographics
- Population (ZIP)
- 6,118
Population outlook (Cattaraugus County) Hauer SSP2
- Today (2025)
- 71,623 people
- By 2030
- 67,751 · -5.4%
- By 2040
- 59,488 · -16.9%
- By 2050
- 51,601 · -28.0%
- By 2075
- 35,025 · -51.1%
- By 2100
- 21,243 · -70.3%
Race, ethnicity, and origin ACS 2023
- Neighborhood character
- Predominantly White (88%)
- Race & ethnicity
- White 88% Two or more races 5% Black 3% Native American 2% Asian 2%
- Common ancestry
- Romanian 7% Slovak 3% Lithuanian 2%
- Foreign-born
- 2% · Canada
- Languages at home
- 98% English-only · Other Indo-European 1%
Political lean MEDSL · Cattaraugus
- 2024 margin
- Solid R (+32.8) · D 33.6% · R 66.4%
- 2008→2024 swing
- -22.2pp toward R · 2008: -10.6pp · 2024: -32.8pp
- All cycles
- 2024: R+32.8 2020: R+29.5 2016: R+34.4 2012: R+13.4 2008: R+10.6
Not yet ingested
- Civics
- —
Market trends
- HPI YoY
- ▲ 24.72%
- Current HPI
- 259.9141
- Rent YoY
- —
- Metro
- —
- State GDP YoY
- ▲ 2.60%
- F500 in state
- 92
Industry mix (Fortune 500 HQ in NY)
| Industry | F500 HQs | Revenue |
|---|---|---|
| Financial Services | 10 | $950B |
|
||
| Consumer Goods | 9 | $162B |
|
||
| Insurance | 4 | $225B |
|
||
| Telecommunications | 2 | $144B |
|
||
| Pharmaceuticals | 2 | $112B |
|
||
| Media / Entertainment | 2 | $69B |
|
||
Price history
+75.4% since first listed3 events — show timeline
- 2026-04-09 Price Changed $229,900 UNYREIS
- 2026-03-27 Listed $249,000 UNYREIS
- 2003-05-02 Sold (Public Records) $131,100 Public Records
Property tax history
+1.1%/yrLatest (2025): $4,498 · +0.9% YoY. Source: county tax records.
Cash-flow waterfall
monthlySold comps — $/sqft
last 12 mo · ≤1 miLoading sold comps…