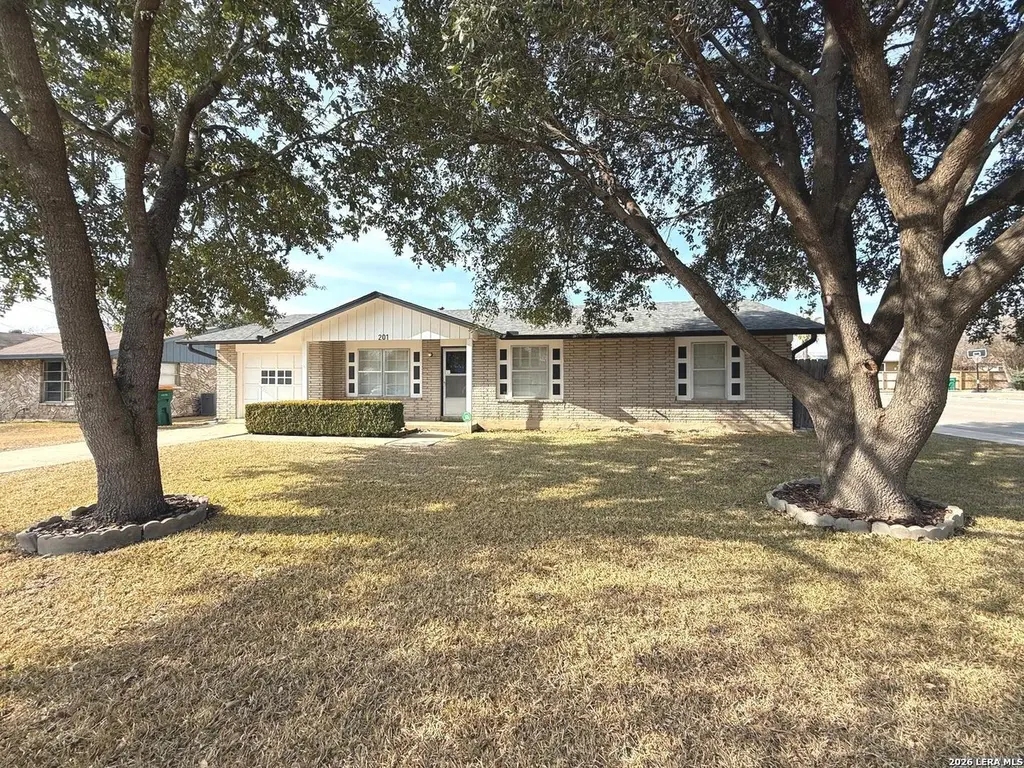
201 Avenue D · Converse, TX
Flood risk 1/10 · Minimal
- FEMA flood zone
- X (unshaded)
- Chance of flooding over 30 yrs
- 0.0%
- Est. flood insurance / yr
- $507 – $1,088
Fire risk 4/10 · Minor
- Est. fire insurance / yr
- $1,222 – $2,270
Heat risk 8/10 · Major
- Hot days now (above 108°F)
- 7 days/yr
- Hot days in 30 yrs
- 20 days/yr
Wind risk 8/10 · Major
- Chance of severe wind over 30 yrs
- 80.0%
Air-quality risk 1/10 · Minimal
- Unhealthy air days now
- 0 days/yr
- Unhealthy air days in 30 yrs
- 0 days/yr
Risk factors via First Street. Map © Google.
Why this score? — see what drove the D grade
The composite is a weighted blend of 9 inputs, each scored 0–100. Each bar is that input's sub-score; the figure is the points it added to the 100-point composite (weight × sub-score).
- ARV discount +14.4/15.0
- Cash flow +9.2/30.0
- 1% rule +4.0/10.0
- Livability +3.3/5.0
- DSCR +2.6/10.0
- Condition / age +2.5/5.0
- Schools +2.4/10.0
- Rent growth +2.2/5.0
- Appreciation +0.0/10.0
$165,000
🖨 Deal sheet (PDF) 📄 Offer letter ✓ Due diligence
Listing remarks MLS
This is a great opportunity to own a midcentury home of your own! You will love the layout of this property! Spacious backyard on a corner lot. Enjoy the backyard while sitting on the oversized covered patio. * Verify all house & room measurements. Verify Schools with Judson ISD.
Key facts
- Midcentury home
- Spacious backyard
- Corner lot
Tags
Neighborhood map
What this means for you Summary
Snapshot
- This is a 3-bed/2.0-bath single-family listed at $165k.
Deal economics
- At list price, monthly cash flow is $-124 ($-1k/yr) — negative.
- To cash-flow at today's rent, offer at most $143k (13.3% below list).
- To meet the 1% rule (rent ≥ 1% of price), the offer needs to be $148k (10.3% below list).
- Recommended offer: $143k (13.3% below list) — sets the bar for cash-flow.
- Cap rate 5.4% vs local median 4.4% in Converse — meaningfully above typical; check what's discounted (condition, days-on-market, listing class) to confirm the premium yield is real.
Location & tenants
- Location reads 66/100 on livability (#649 in TX) — a middle-class / working-renter tenant base. Strengths: cost of living A+, housing A+, employment B; Watch: crime C-, amenities F, commute F.
- Judson ISD (suburban): math 21% / reading 33% proficiency, ranked #660 of 826 in TX (top 80%) — low school quality limits family demand, transient renter base, plan for 1-2y turnover.
- Zoned schools: Converse El (math 21% / reading 30%, grade F, #2,982 of 4,322 statewide, top 70%, 604 students, 63% FRL); Judson Middle (math 21% / reading 34%, grade F, #1,156 of 1,662 statewide, top 71%, 1,259 students, 70% FRL); Judson H S (math 19% / reading 38%, grade F, #1,157 of 1,632 statewide, top 72%, 2,666 students, 62% FRL).
- Market conditions: Rents soft (-1.1%/yr); 1219 active listings in the ZIP; 40 comparable units currently listed for rent nearby; rentals at typical pace (median 26d on market — plan ~3-4 weeks tenant-placement turnaround); solid renter incomes; 8,308 units permitted in Bexar County in 2024 (2,506 in 5+ unit buildings).
Forward outlook
- Local home prices are declining (-3.0%/yr); year-one equity from $1k of loan paydown is wiped out by about $5k of value loss. Plan a longer hold.
- Bexar County population projected at +50% by 2050 — long-run rental-demand tailwind backs the buy-and-hold thesis.
Negotiation context
- It's been on market 139 days — a 12% lower offer ($145k) is reasonable based on typical stale-listing flexibility.
- 2 sale attempts; this cycle's ask has dropped $20k (11%) from the opening price — seller is motivated, your offer sets the floor, not the list.
Risks & watch-outs
- Watch-outs: property tax is 2.6% of price.
- Climate carrying-cost: severe wind risk, 80% chance of damaging wind over 30y; extreme-heat days projected 7→20/yr by 2055 (HVAC capex compounding) — expect insurance premiums to compound above CPI over the hold.
Questions for the listing agent
- What do current leases actually rent for vs. the listed asking? Can we see a recent rent roll and the last 12 months of T-12 income?
- It's been on market 139 days. Have you received any prior offers? Is the seller open to a 13% concession, seller financing, or rate buy-down credit?
- Built in 1966 — when were the roof, HVAC, electrical panel, plumbing, and water heater last replaced?
- Property tax is high relative to price — has the assessment been appealed recently, and will the sale trigger a re-assessment?
- Why hasn't it sold? Are there any deal-killer items the seller is aware of (foundation, flood, title, zoning, code violations)?
- Is there a deadline driving the sale (1031 exchange, divorce, estate, relocation)? That informs how much negotiation room exists.
- The area grade is low — what's the realistic commute time and amenity access for the typical tenant pool here? Any planned neighborhood developments (good or bad) we should know about?
- What's the average days-on-market for RENTAL listings here right now (not sales)? A rising rental-DOM trend means longer vacancies and softer asking-rent achievability than the comps imply.
- What's the recent tenant-quality profile in this submarket — average credit score on applications, eviction rate, late-payment / NSF rate, and stable-employment percentage? A property-management company in the area should have these aggregated.
- How much new for-sale + rental construction is in the pipeline within 1–3 miles? Heavy new supply typically softens prices + rents 12–24 months out; constrained supply supports both.
Investment metrics
- 1% rule
- 0.90% ✗
- Cap rate
- 5.39%
- Cash-on-cash
- -3.23%
- DSCR
- 0.86
- GRM
- 9.3
CMA / ARV
- ARV (median comp)
- $195,002
- List price
- $165,000
- Delta
- -15.39%
- Verdict
- UNDERPRICED
- Comps
- 20 within 1.0 mi
Show comp detail 12 sales within ~0.75 mi
| Address | Dist | Beds/Ba | Sqft | Sold | Price | $/sf | Match |
|---|---|---|---|---|---|---|---|
| 208 Legion | 0.05mi | 3/2.0 | 1,358 (-2%) | 9mo | $160,000 | $118 | 87 |
| 519 Willow Dr | 0.31mi | 3/2.0 | 1,401 (+1%) | 3mo | $230,000 | $164 | 81 |
| 614 Oak | 0.20mi | 3/2.0 | 1,452 (+5%) | 5mo | $119,600 | $82 | 79 |
| 107 Avenue B | 0.13mi | 2/1.0 (-1) | 1,300 (-6%) | 9mo | $173,000 | $133 | 67 |
| 60 3rd | 0.47mi | 4/2.0 (+1) | 1,364 (-2%) | 4mo | $200,000 | $147 | 67 |
| 422 Bridgit | 0.55mi | 4/2.0 (+1) | 1,360 (-2%) | 3mo | $180,000 | $132 | 63 |
| 1920 Chicksaw Rose | 0.73mi | 3/2.0 | 1,411 (+2%) | 2mo | $203,999 | $145 | 61 |
| 609 Jamie Sue Dr | 0.65mi | 3/2.0 | 1,412 (+2%) | 7mo | $199,900 | $142 | 61 |
| 735 Dana Dr | 0.74mi | 3/2.0 | 1,363 (-2%) | 2mo | $225,900 | $166 | 61 |
| 517 5th | 0.63mi | 3/2.0 | 1,299 (-6%) | 1mo | $200,000 | $154 | 60 |
| 440 Bridgit | 0.60mi | 4/2.0 (+1) | 1,534 (+10%) | 5mo | $149,000 | $97 | 46 |
| 611 Janice | 0.72mi | 3/2.0 | 1,256 (-10%) | 6mo | $229,700 | $183 | 45 |
Match score weights: distance 35% · size 25% · config 20% · recency 20%. Top-matched comps best support the ARV.
Projected returns pro-forma
-3.0% appreciation · 0.0% rent growth · sell at horizon
- IRR
- -25.5%
- Equity multiple
- 0.16×
- Total profit
- $-38,869
- Equity at exit
- $24,602
- IRR
- -38.2%
- Equity multiple
- -0.31×
- Total profit
- $-60,328
- Equity at exit
- $14,266
Cash invested: $46,200 (down + closing). Projections, not guarantees.
Landlord ↔ Tenant lean methodology
- Overall (STATE)
- 87 Strongly Landlord-Friendly
- State Texas
- 87 Strongly Landlord-Friendly · R+5
- County
- — inherits STATE
- City
- — inherits STATE
ZIP-level market 78109
- Home prices YoY
- -17.8%
- Rents YoY
- -1.1%
- Active inventory
- 1219
- Price-to-rent
- 9.3×
Monthly cashflow live
- Estimated rent
- $1,481 high interval (Pro) →
- Mortgage (P&I)
- −$865
- Tax from tax record
- −$360 /mo · $4,320/yr
- Insurance
- −$69
- HOA
- −$0
- Lot rent
- −$0
- Vacancy / Maint / Mgmt
- −$311
- Net cashflow
- $-124
Break-even live
Sensitivity live
| Price | -10% $-31 | -5% $-77 | +0% $-124 | +5% $-171 | +10% $-218 |
|---|---|---|---|---|---|
| Rent | -10% $-241 | -5% $-183 | +0% $-124 | +5% $-66 | +10% $-7 |
| Rate | -1.0pp $-41 | -0.5pp $-82 | base $-124 | +0.5pp $-167 | +1.0pp $-210 |
UW: 25.0% down · 7.5% · 30yr · 1.5% tax · 5.0% vac · 8.0% maint · 8.0% mgmt
Financing live
Cash to close
- Down payment
- $41,250
- Closing costs
- $4,950
- Reserves months
- —
- Total cash needed
- —
Loan-product check · same deal, 3 products live
Conventional
25% down · 7.5% · 30yr
- Down + closing
- —
- Monthly P&I
- —
- Monthly cashflow
- —
- DSCR
- —
- Eligible?
- —
Personal DTI + credit; lowest rate.
DSCR
20% down · 8.5% · 30yr
- Down + closing
- —
- Monthly P&I
- —
- Monthly cashflow
- —
- DSCR
- —
- Eligible?
- —
No personal income docs; deal must DSCR.
Hard money
10% down · 12.0% · 12mo
- Down + closing
- —
- Monthly P&I
- —
- Monthly cashflow
- —
- DSCR
- —
- Eligible?
- —
Short-term bridge; refi at stabilization.
Rent comps 40 comps
| Address | Beds | Baths | Sqft | Rent | $/sqft | DOM | Units | Dist |
|---|---|---|---|---|---|---|---|---|
| 320 Station St Unit 101 Converse, TX | 2.0 | 2.0 | 877 | $825 | $0.94 | 15d | 1 | 0.03mi |
| 103 Avenue F Unit A Converse, TX | 2.0 | 1.0 | 1372 | $1,175 | $0.86 | 46d | 1 | 0.15mi |
| 301 Converse Center St Converse, TX | 1.0–3.0 | 1.0–2.0 | 975 | $1,417 | $1.45 | 46d | 1 | 0.23mi |
| 517 Oak Dr Converse, TX | 3.0 | 1.5 | 894 | $1,500 | $1.68 | 26d | 1 | 0.25mi |
| 202 Ash Dr Unit 103 Converse, TX | 2.0 | 2.0 | 900 | $995 | $1.11 | 26d | 1 | 0.31mi |
| 810 Station St Unit 1 Converse, TX | 2.0 | 2.0 | 1088 | $899 | $0.83 | 26d | 1 | 0.35mi |
| 810 Station St Apt 3 Converse, TX | 2.0 | 2.0 | 1088 | $825 | $0.76 | 6d | 1 | 0.35mi |
| 812 Station St Converse, TX | 2.0 | 1.0 | 1100 | $975 | $0.89 | 26d | 1 | 0.37mi |
| 208 Michelle Dr Converse, TX | 3.0 | 2.0 | 1156 | $1,400 | $1.21 | 26d | 1 | 0.38mi |
| 9205 Farm to Market Road 78 Unit 710 Converse, TX | 2.0 | 2.0 | 896 | $1,043 | $1.16 | 1d | 1 | 0.42mi |
| 10 4th St W Converse, TX | 4.0 | 2.0 | 1429 | $1,595 | $1.12 | 1d | 1 | 0.52mi |
| 601 Jamie Sue Dr Converse, TX | 3.0 | 2.0 | 1225 | $1,600 | $1.31 | 26d | 1 | 0.63mi |
| 531 Erna Dr Converse, TX | 3.0 | 2.0 | 1002 | $1,350 | $1.35 | 13d | 1 | 0.64mi |
| 8422 Parry Path Converse, TX | 3.0 | 2.0 | 1641 | $1,550 | $0.94 | 46d | 1 | 0.65mi |
| 115 N Meadow St Converse, TX | 3.0 | 2.0 | 1048 | $1,650 | $1.57 | 46d | 1 | 0.65mi |
| 714 Dana Dr Converse, TX | 3.0 | 2.0 | 1194 | $1,465 | $1.23 | 6d | 1 | 0.66mi |
| 9060 FM 78 Converse, TX | 1.0–2.0 | 1.0 | 769 | $1,150 | $1.50 | 1d | 10 | 0.73mi |
| 116 Meadow Lark Converse, TX | 3.0 | 2.0 | 1527 | $1,650 | $1.08 | 46d | 1 | 0.74mi |
| 116 Meadow Lark Converse, TX | 3.0 | 2.0 | 1527 | $1,650 | $1.08 | 26d | 1 | 0.74mi |
| 9515 Boatman Pier Converse, TX | 3.0 | 2.0 | 1672 | $1,750 | $1.05 | 26d | 1 | 0.75mi |
| 9523 Bent Tree Holw Converse, TX | 3.0 | 2.0 | 1661 | $1,650 | $0.99 | 1d | 1 | 0.81mi |
| 823 Meadow Stone Converse, TX | 3.0 | 2.0 | 1286 | $1,465 | $1.14 | 6d | 1 | 0.87mi |
| 8307 Forest Ridge Dr San Antonio, TX | 4.0 | 2.0 | 1860 | $1,199 | $0.64 | 4d | 1 | 0.89mi |
| 9310 Hanover Sky Converse, TX | 3.0 | 2.0 | 1672 | $1,595 | $0.95 | 26d | 1 | 0.89mi |
| 509 Meadow Frg Unit B Converse, TX | 3.0 | 1.0 | 950 | $925 | $0.97 | 17d | 1 | 0.89mi |
| 509 Meadow Frg Unit A Converse, TX | 3.0 | 1.5 | 950 | $925 | $0.97 | 17d | 1 | 0.89mi |
| 209 Royal Dr Converse, TX | 3.0 | 2.0 | 952 | $1,500 | $1.58 | 17d | 1 | 0.90mi |
| 8810 Appaloosa Pass Converse, TX | 3.0 | 2.5 | 1790 | $1,795 | $1.00 | 46d | 1 | 0.93mi |
| 8715 8th St Unit 1 Converse, TX | 3.0 | 2.5 | 1502 | $1,555 | $1.04 | 46d | 1 | 0.94mi |
| 8711 8th St Unit 1 Converse, TX | 3.0 | 2.5 | 1502 | $1,525 | $1.02 | 46d | 1 | 0.94mi |
| 8416 Dixon Ridge Dr San Antonio, TX | 3.0 | 2.0 | 1104 | $1,225 | $1.11 | 5d | 1 | 0.95mi |
| 8206 Talkenhorn Converse, TX | 3.0 | 2.0 | 1584 | $1,895 | $1.20 | 26d | 1 | 0.95mi |
| 8206 Talkenhorn Converse, TX | 3.0 | 2.0 | 1584 | $1,595 | $1.01 | 46d | 1 | 0.95mi |
| 8404 Forest Ridge Dr San Antonio, TX | 2.0 | 2.5 | 1860 | $1,500 | $0.81 | 26d | 1 | 0.97mi |
| 8406 Forest Ridge Dr San Antonio, TX | 3.0 | 2.0 | 1121 | $1,500 | $1.34 | 46d | 1 | 0.97mi |
| 317 Vivian Dr Converse, TX | 3.0 | 2.0 | 1454 | $1,650 | $1.13 | 5d | 1 | 1.00mi |
| 8003 Chestnut Manor Dr Converse, TX | 3.0 | 2.0 | 1641 | $1,795 | $1.09 | 18d | 1 | 1.00mi |
| 8607 Cheyenne Blf Converse, TX | 4.0 | 2.0 | 1697 | $1,800 | $1.06 | 46d | 1 | 1.01mi |
| 305 Jeanette Dr Converse, TX | 3.0 | 2.0 | 1084 | $1,600 | $1.48 | 26d | 1 | 1.01mi |
| 309 Jeanette Dr Converse, TX | 4.0 | 2.0 | 1105 | $1,595 | $1.44 | 26d | 1 | 1.02mi |
Listing history 19 events
-
2026-06-22days on market $165,000 Active 139 DOM
-
2026-06-21days on market $165,000 Active 138 DOM
-
2026-06-18days on market $165,000 Active 135 DOM
-
2026-06-17days on market $165,000 Active 134 DOM
-
2026-06-16days on market $165,000 Active 133 DOM
-
2026-06-15days on market $165,000 Active 132 DOM
-
2026-06-13days on market $165,000 Active 130 DOM
-
2026-06-09days on market $165,000 Active 126 DOM
-
2026-06-08days on market $165,000 Active 125 DOM
-
2026-06-07days on market $165,000 Active 124 DOM
-
2026-06-04days on market $165,000 Active 121 DOM
-
2026-06-03days on market $165,000 Active 120 DOM
-
2026-06-02days on market $165,000 Active 119 DOM
-
2026-06-01days on market $165,000 Active 118 DOM
-
2026-05-31days on market $165,000 Active 117 DOM
-
2026-05-11status Back on Market 291-char remark
Show marketing remark (291 chars)
This is a great opportunity to own a midcentury home of your own! You will love the layout of this property! Spacious backyard on a corner lot. Enjoy the backyard while sitting on the oversized covered patio. * Verify all house & room measurements. Verify Schools with Judson ISD.
-
2026-05-09historical Active Option 291-char remark
Show marketing remark (291 chars)
This is a great opportunity to own a midcentury home of your own! You will love the layout of this property! Spacious backyard on a corner lot. Enjoy the backyard while sitting on the oversized covered patio. * Verify all house & room measurements. Verify Schools with Judson ISD.
-
2026-03-20price $165,000 291-char remark
Show marketing remark (291 chars)
This is a great opportunity to own a midcentury home of your own! You will love the layout of this property! Spacious backyard on a corner lot. Enjoy the backyard while sitting on the oversized covered patio. * Verify all house & room measurements. Verify Schools with Judson ISD.
-
2026-02-03$185,000 New 291-char remark
Show marketing remark (291 chars)
This is a great opportunity to own a midcentury home of your own! You will love the layout of this property! Spacious backyard on a corner lot. Enjoy the backyard while sitting on the oversized covered patio. * Verify all house & room measurements. Verify Schools with Judson ISD.
ⓘ Source: listings_history table (triggers on properties + properties_extension) + one-shot
backfill from property_details.listing_events for pre-trigger history.
Tax reassessment forecast TX · Resets to sale price
- Current annual tax
- $4,320 · $360/mo
- Projected year-2 tax
- $4,320 · $360/mo
- Expected delta
- $0/yr ($0/mo · 0.0%)
ⓘ Screening estimate from a state-policy table — verify with the county assessor before closing.
Climate risk First Street
- Flood 1/10 Low FEMA zone X (unshaded) · 0% chance over 30 yrs
- Wildfire 4/10 Moderate
- Heat 8/10 Severe 7 d/yr ≥108°F today · 20 d/yr by 30 yrs out
- Wind 8/10 Severe 80% chance of damaging wind over 30 yrs
- Air quality 1/10 Low 0 unhealthy d/yr today · 0 by 30 yrs out
Nearby sold comps map
Loading sold comps map…
Walkable amenities ~0.75 mi
Loading nearby amenities…
Taxation est. · year 1
- Rental income
- $17,770
- − Mortgage interest
- −$9,243
- − Property taxes
- −$4,320
- − Insurance
- −$825
- − Repairs & maintenance
- −$1,422
- − Management
- −$1,422
- − Depreciation
- −$4,800
- Taxable loss
- −$4,261
- Est. tax savings @ 24.0%
- +$1,023
- After-tax cash flow
- $-468/yr
For passive investors: Depreciation is non-cash, so a rental often shows a tax loss while cash-flowing — sheltering income. Rental losses are passive: they offset passive income freely, and up to $25,000/yr can offset ordinary (W-2) income if you actively participate and your MAGI is under $100k (phasing out to $0 by $150k); unused losses carry forward. On sale, claimed depreciation is recaptured at up to 25%, and gains may owe capital-gains tax (a 1031 exchange can defer both). Figures are a year-1 estimate at your 24.0% rate — not tax advice; consult a CPA.
Schools (NCES district)
- District
- Judson ISD
- NCES district ID
- 4824990
- Math proficiency
- 21% ▼ -21.00%
- Reading proficiency
- 33% ▼ -7.00%
- Median HH income
- $57,542
- Composite
- 24.39/100
- National rank
- #7689
- State rank
- #660 of 826 in TX
Livability — Converse
- Score
- 66/100
- State rank
- #649
- US rank
- #12250
Category grades
Schools grade is shown separately in the Schools card above.
Census & demographics
- Census place
- Converse, TX
- County
- Bexar County · 1,990,555 people
- City population
- 1,806,925
- Metro
- San Antonio-New Braunfels, TX
- Population (ZIP)
- 63,067
- Household income
- $91,320
- Rent vs Own
- Severe rent burden
- 1732.0
Population outlook (Bexar County) Hauer SSP2
- Today (2025)
- 2,336,851 people
- By 2030
- 2,560,728 · +9.6%
- By 2040
- 3,020,569 · +29.3%
- By 2050
- 3,493,522 · +49.5%
- By 2075
- 4,668,459 · +99.8%
- By 2100
- 5,533,242 · +136.8%
Race, ethnicity, and origin ACS 2023
- Neighborhood character
- Diverse neighborhood (Simpson 0.69)
- Race & ethnicity
- Hispanic / Latino 44% White 27% Two or more races 21% Black 21% Asian 3%
- Hispanic origin (detail)
- Mexican 29% Puerto Rican 4%
- Common ancestry
- Lithuanian 1% Romanian 1% Italian 1%
- Foreign-born
- 11% · Canada, Vietnam, South Korea
- Languages at home
- 71% English-only · Spanish 23% Tagalog/Filipino 1% Other Asian/Pacific 1%
Political lean MEDSL · Bexar
- 2024 margin
- Lean D (+9.8) · D 54.3% · R 44.6% · Other 1.1%
- 2008→2024 swing
- +4.2pp toward D · 2008: 5.6pp · 2024: 9.8pp
- All cycles
- 2024: D+9.8 2020: D+18.2 2016: D+13.5 2012: D+4.6 2008: D+5.6
Not yet ingested
- Civics
- —
Market trends
- HPI YoY
- ▼ -51.02%
- Current HPI
- 236.4923
- Rent YoY
- ▼ -1.08%
- Metro
- San Antonio-New Braunfels, TX
- State GDP YoY
- ▲ 3.95%
- F500 in state
- 110
Industry mix (Fortune 500 HQ in TX)
| Industry | F500 HQs | Revenue |
|---|---|---|
| Energy | 16 | $1,198B |
|
||
| Technology | 5 | $198B |
|
||
| Engineering / Construction | 4 | $72B |
|
||
| Energy Services | 3 | $60B |
|
||
| Utilities | 3 | $41B |
|
||
| Healthcare | 2 | $330B |
|
||
Price history
-10.8% since first listed4 events — show timeline
- 2026-05-11 Relisted — LERA
- 2026-05-09 Contingent — LERA
- 2026-03-20 Price Changed $165,000 LERA
- 2026-02-03 Listed $185,000 LERA
Property tax history
+10.8%/yrLatest (2025): $4,320 · +3.6% YoY. Source: county tax records.
Cash-flow waterfall
monthlySold comps — $/sqft
last 12 mo · ≤1 miLoading sold comps…