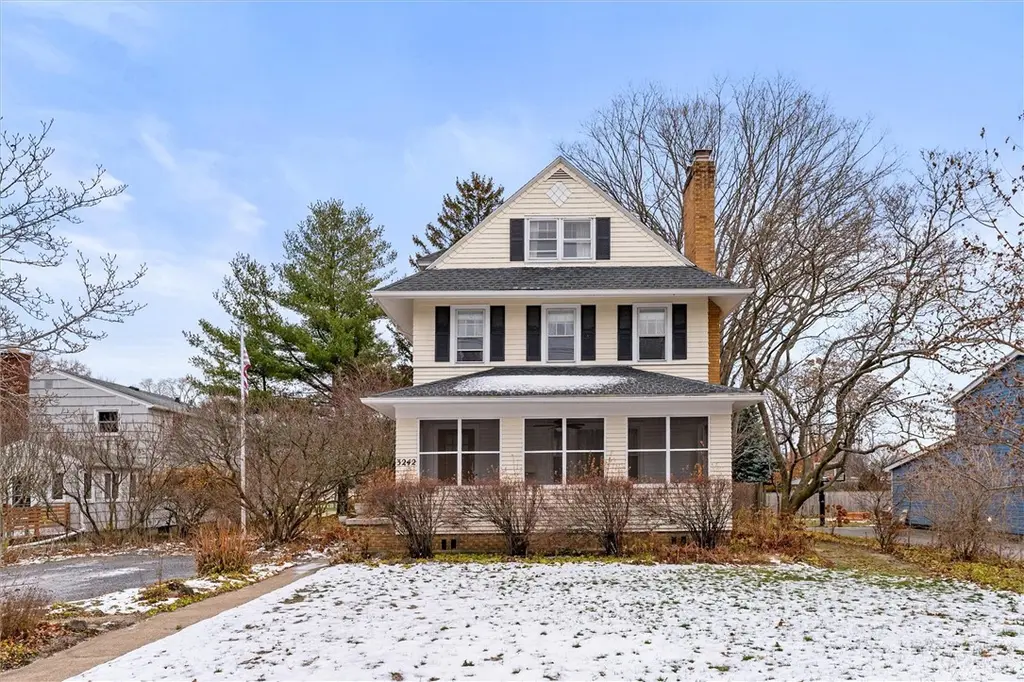
3242 Saint Paul Blvd · Irondequoit, NY
Flood risk 1/10 · Minimal
- FEMA flood zone
- X (unshaded)
- Chance of flooding over 30 yrs
- 0.0%
- Est. flood insurance / yr
- $473 – $860
Fire risk 3/10 · Minor
- Est. fire insurance / yr
- $691 – $1,283
Heat risk 2/10 · Minimal
- Hot days now (above 96°F)
- 7 days/yr
- Hot days in 30 yrs
- 16 days/yr
Wind risk 1/10 · Minimal
- Chance of severe wind over 30 yrs
- —
Air-quality risk 2/10 · Minimal
- Unhealthy air days now
- 1 days/yr
- Unhealthy air days in 30 yrs
- 2 days/yr
Risk factors via First Street. Map © Google.
Why this score? — see what drove the D grade
The composite is a weighted blend of 9 inputs, each scored 0–100. Each bar is that input's sub-score; the figure is the points it added to the 100-point composite (weight × sub-score).
- Cash flow +12.3/30.0
- ARV discount +9.5/15.0
- Schools +6.2/10.0
- 1% rule +4.2/10.0
- Livability +4.0/5.0
- DSCR +3.6/10.0
- Rent growth +2.5/5.0
- Condition / age +2.5/5.0
- Appreciation +0.0/10.0
$270,000
🖨 Deal sheet (PDF) 📄 Offer letter ✓ Due diligence
Listing remarks
Welcome to this classic 1920's home full of character and charm. The enclosed front porch offers views of the Blvd. 1st floor has hardwood floors throughout, fireplace in the living room with wood storage and a warming chamber. Wood beams accent the ceiling. Pocket doors lead to the formal dining room that includes a mahogany corner shelf. The eat in country kitchen includes custom cabinetry, beamed ceiling and plenty of storage. There is also a half bath on the main level. The 2nd level has 3 bedrooms with large closets, one with a sleeping porch, one with a beamed ceiling and a fireplace with an arched shelved alcove, and 1 full bath. The 3rd level has 2 more bedrooms and a half bath. You
Key facts
- Warming chamber
- Wood beams
- Wood storage
Tags
Property features AI
Finance
- Other: Irregular lot with approximately 90 x 165 dimensions; Near public transit; City street frontage; Residential lot
Exterior
- Parking: No garage
- Utilities: Electricity connected (circuit breakers); Public water connected; Sewer connected; High-speed internet available; Cable available
- Home design: 3 stories; Existing construction
- Construction: Wood siding; Architectural shingle roof; Block foundation; PEX plumbing
- Exterior features: Enclosed porch; Porch; Gravel driveway; Shed(s) / additional storage
Interior
- Kitchen: Electric cooktop; Electric range; Electric oven; Double oven; Range hood; Exhaust fan; Refrigerator; Freezer; Dishwasher; Country / eat-in kitchen layout; Solid surface counters
- Bedrooms: Bedroom 1 (Second level); Bedroom 2 (Second level); Bedroom 3 (Second level); Bedroom 4 (Third level); Bedroom 5 (Third level)
- Flooring: Hardwood; Tile; Varies
- Bathrooms: 1 full bathroom; 2 half bathrooms; 1 main-level bathroom
- Heating & cooling: Gas forced-air heating; Central air conditioning; Gas water heater
- Interior features: Leaded glass windows; Attic; Bathroom rough-in; Separate/formal dining room; Entrance foyer; Eat-in kitchen; Separate/formal living room; Country kitchen; Solid surface countertops; Natural woodwork
- Laundry & utility: Washer; Dryer; Laundry located in basement
Neighborhood map
What this means for you Summary
Snapshot
- This is a 4-bed/1.5-bath single-family listed at $270k.
Deal economics
- At list price, monthly cash flow is $-50 ($-604/yr) — negative.
- To cash-flow at today's rent, offer at most $261k (3.3% below list).
- To meet the 1% rule (rent ≥ 1% of price), the offer needs to be $249k (7.8% below list).
- Recommended offer: $249k (7.8% below list) — sets the bar for 1% rule.
- Cap rate 6.1% vs local median 4.5% in Irondequoit — top-decile yield for the area; either an underpriced asset or a hidden risk that comps aren't pricing in. Stress-test before assuming the spread holds.
Location & tenants
- Location reads 81/100 on livability (#92 in NY, #1,414 nationally) — a professional / high-income tenant draw. Strengths: housing A+, health & safety A+, crime B+; Watch: amenities F.
- West Irondequoit Central School District (suburban): math 73% / reading 70% proficiency, ranked #126 of 590 in NY (top 21%) — strong family-tenant draw, lease renewals of 3-5y typical; only 18% free/reduced lunch — higher-income household profile.
- Zoned schools: Irondequoit High School (math 96% / reading 64%, grade A, #509 of 1,100 statewide, top 46%, 1,163 students, 33% FRL).
- Market conditions: 104 active listings in the ZIP; 5 comparable units currently listed for rent nearby; rentals leasing fast (median 4d on market — plan ~1-2 weeks tenant-placement turnaround); solid renter incomes; 1,169 units permitted in Monroe County in 2024 (591 in 5+ unit buildings).
- This rent runs 33% of the median local income ($90k/yr) — at the standard rent-burdened threshold; future hikes will face affordability resistance.
Forward outlook
- Local home prices are declining (-3.0%/yr); year-one equity from $2k of loan paydown is wiped out by about $8k of value loss. Plan a longer hold.
- Monroe County population projected to shrink 6% by 2050 — rents likely to lag national; underwrite the cash flow, not the appreciation.
Negotiation context
- It's been on market 30 days — a 2% lower offer ($266k) is reasonable based on typical stale-listing flexibility.
- 4 sale attempts; this cycle's ask has dropped $15k (5%) from the opening price — seller is motivated, your offer sets the floor, not the list.
Risks & watch-outs
- Watch-outs: built in 1922 — expect roof / HVAC / electrical / plumbing capex.
Questions for the listing agent
- What do current leases actually rent for vs. the listed asking? Can we see a recent rent roll and the last 12 months of T-12 income?
- Built in 1922 — when were the roof, HVAC, electrical panel, plumbing, and water heater last replaced?
- Is there a deadline driving the sale (1031 exchange, divorce, estate, relocation)? That informs how much negotiation room exists.
- Schools are B-rated — typically a magnet for longer-tenancy family renters. What's the average tenant stay here, and is there a school-zone premium baked into asking?
- The area grade is low — what's the realistic commute time and amenity access for the typical tenant pool here? Any planned neighborhood developments (good or bad) we should know about?
- What's the average days-on-market for RENTAL listings here right now (not sales)? A rising rental-DOM trend means longer vacancies and softer asking-rent achievability than the comps imply.
- What's the recent tenant-quality profile in this submarket — average credit score on applications, eviction rate, late-payment / NSF rate, and stable-employment percentage? A property-management company in the area should have these aggregated.
- How much new for-sale + rental construction is in the pipeline within 1–3 miles? Heavy new supply typically softens prices + rents 12–24 months out; constrained supply supports both.
Investment metrics
- 1% rule
- 0.92% ✗
- Cap rate
- 6.07%
- Cash-on-cash
- -0.80%
- DSCR
- 0.96
- GRM
- 9.0
CMA / ARV
- ARV (on-the-fly)
- $282,720
- Comps found
- 12
Show comp detail 12 sales within ~0.75 mi
| Address | Dist | Beds/Ba | Sqft | Sold | Price | $/sf | Match |
|---|---|---|---|---|---|---|---|
| 3242 Saint Paul Blvd | 0.00mi | 5/2.0 (+1) | 1,860 (0%) | 1mo | $270,000 | $145 | 92 |
| 248 Chestnut Hill Dr | 0.16mi | 4/1.5 | 1,784 (-4%) | 6mo | $315,000 | $177 | 80 |
| 650 Winona Blvd | 0.28mi | 4/2.0 | 1,692 (-9%) | 2mo | $275,000 | $163 | 69 |
| 71 Curtice Rd | 0.33mi | 3/1.0 (-1) | 1,975 (+6%) | 1mo | $280,000 | $142 | 66 |
| 187 Chestnut Hill Dr | 0.16mi | 4/2.0 | 2,111 (+14%) | 3mo | $320,000 | $152 | 66 |
| 56 Northwick Dr | 0.09mi | 3/2.5 (-1) | 1,613 (-13%) | 2mo | $360,000 | $223 | 63 |
| 2866 Saint Paul Blvd | 0.54mi | 3/1.5 (-1) | 1,785 (-4%) | 3mo | $230,000 | $129 | 61 |
| 205 Daley Blvd | 0.59mi | 4/1.5 | 1,772 (-5%) | 6mo | $250,000 | $141 | 60 |
| 50 Rogers Pkwy | 0.72mi | 3/2.0 (-1) | 1,910 (+3%) | 5mo | $321,000 | $168 | 51 |
| 22 Biltmore Dr | 0.54mi | 4/2.0 | 1,600 (-14%) | 1mo | $365,000 | $228 | 49 |
| 170 East Pkwy | 0.66mi | 4/2.5 | 1,700 (-9%) | 5mo | $250,000 | $147 | 46 |
| 37 Montclair Dr | 0.58mi | 3/1.5 (-1) | 1,634 (-12%) | 7mo | $231,000 | $141 | 42 |
Match score weights: distance 35% · size 25% · config 20% · recency 20%. Top-matched comps best support the ARV.
Projected returns pro-forma
-3.0% appreciation · 3.0% rent growth · sell at horizon
- IRR
- -17.6%
- Equity multiple
- 0.38×
- Total profit
- $-46,826
- Equity at exit
- $40,258
- IRR
- -9.5%
- Equity multiple
- 0.41×
- Total profit
- $-44,371
- Equity at exit
- $23,345
Cash invested: $75,600 (down + closing). Projections, not guarantees.
Landlord ↔ Tenant lean methodology
- Overall (STATE)
- 15 Strongly Tenant-Friendly
- State New York
- 15 Strongly Tenant-Friendly · D+10
- County
- — inherits STATE
- City
- — inherits STATE
ZIP-level market 14617
- Active inventory
- 104
- Price-to-rent
- 9.0×
Monthly cashflow live
- Estimated rent
- $2,491 high interval (Pro) →
- Mortgage (P&I)
- −$1,416
- Tax from tax record
- −$490 /mo · $5,875/yr
- Insurance
- −$112
- HOA
- −$0
- Vacancy / Maint / Mgmt
- −$523
- Net cashflow
- $-50
Break-even live
Sensitivity live
| Price | -10% $103 | -5% $26 | +0% $-50 | +5% $-127 | +10% $-203 |
|---|---|---|---|---|---|
| Rent | -10% $-247 | -5% $-149 | +0% $-50 | +5% $48 | +10% $146 |
| Rate | -1.0pp $86 | -0.5pp $18 | base $-50 | +0.5pp $-120 | +1.0pp $-191 |
UW: 25.0% down · 7.5% · 30yr · 1.5% tax · 5.0% vac · 8.0% maint · 8.0% mgmt
Financing live
Cash to close
- Down payment
- $67,500
- Closing costs
- $8,100
- Reserves months
- —
- Total cash needed
- —
Loan-product check · same deal, 3 products live
Conventional
25% down · 7.5% · 30yr
- Down + closing
- —
- Monthly P&I
- —
- Monthly cashflow
- —
- DSCR
- —
- Eligible?
- —
Personal DTI + credit; lowest rate.
DSCR
20% down · 8.5% · 30yr
- Down + closing
- —
- Monthly P&I
- —
- Monthly cashflow
- —
- DSCR
- —
- Eligible?
- —
No personal income docs; deal must DSCR.
Hard money
10% down · 12.0% · 12mo
- Down + closing
- —
- Monthly P&I
- —
- Monthly cashflow
- —
- DSCR
- —
- Eligible?
- —
Short-term bridge; refi at stabilization.
Rent comps 5 comps
| Address | Beds | Baths | Sqft | Rent | $/sqft | DOM | Units | Dist |
|---|---|---|---|---|---|---|---|---|
| 148 Chestnut Hill Dr Rochester, NY | 3.0 | 2.0 | 1659 | $2,250 | $1.36 | 4d | 1 | 0.22mi |
| 38 Elgrove Rd Rochester, NY | 4.0 | 1.5 | 1600 | $2,295 | $1.43 | 22d | 1 | 0.23mi |
| 58 Fairview Cres Rochester, NY | 4.0 | 1.5 | 2194 | $3,600 | $1.64 | 4d | 1 | 0.60mi |
| 83 Navarre Rd Rochester, NY | 3.0 | 2.0 | 1322 | $2,250 | $1.70 | 4d | 1 | 1.33mi |
| 64 Chippendale Rd Rochester, NY | 5.0 | 2.5 | 1620 | $2,400 | $1.48 | 4d | 1 | 1.46mi |
Listing history 12 events
-
2026-05-08status Pending
-
2026-04-27price $270,000
-
2026-04-23price $280,000
-
2026-04-08$285,000 Active
-
2026-03-15historical
-
2026-03-13status Active
-
2026-02-27historical Active Under Contract
-
2026-02-27status Pending
-
2026-02-13historical Active Under Contract
-
2026-02-04$285,000 Active
-
2025-12-24historical
-
2025-12-04$285,000 Active
ⓘ Source: listings_history table (triggers on properties + properties_extension) + one-shot
backfill from property_details.listing_events for pre-trigger history.
Tax reassessment forecast NY · Partial reset (capped growth)
- Current annual tax
- $5,875 · $490/mo
- Projected year-2 tax
- $5,875 · $490/mo
- Expected delta
- $0/yr ($0/mo · 0.0%)
ⓘ Screening estimate from a state-policy table — verify with the county assessor before closing.
Climate risk First Street
- Flood 1/10 Low FEMA zone X (unshaded) · 0% chance over 30 yrs
- Wildfire 3/10 Moderate
- Heat 2/10 Low 7 d/yr ≥96°F today · 16 d/yr by 30 yrs out
- Wind 1/10 Low
- Air quality 2/10 Low 1 unhealthy d/yr today · 2 by 30 yrs out
Nearby sold comps map
Loading sold comps map…
Walkable amenities ~0.75 mi
Loading nearby amenities…
Taxation est. · year 1
- Rental income
- $29,889
- − Mortgage interest
- −$15,124
- − Property taxes
- −$5,875
- − Insurance
- −$1,350
- − Repairs & maintenance
- −$2,391
- − Management
- −$2,391
- − Depreciation
- −$7,855
- Taxable loss
- −$5,097
- Est. tax savings @ 24.0%
- +$1,223
- After-tax cash flow
- $619/yr
For passive investors: Depreciation is non-cash, so a rental often shows a tax loss while cash-flowing — sheltering income. Rental losses are passive: they offset passive income freely, and up to $25,000/yr can offset ordinary (W-2) income if you actively participate and your MAGI is under $100k (phasing out to $0 by $150k); unused losses carry forward. On sale, claimed depreciation is recaptured at up to 25%, and gains may owe capital-gains tax (a 1031 exchange can defer both). Figures are a year-1 estimate at your 24.0% rate — not tax advice; consult a CPA.
Schools (NCES district)
- District
- West Irondequoit Central School District
- NCES district ID
- 3615390
- Math proficiency
- 73% ▲ 3.00%
- Reading proficiency
- 70% ▲ 5.00%
- Median HH income
- $60,218
- Composite
- 61.61/100
- National rank
- #748
- State rank
- #126 of 590 in NY
Livability — Irondequoit
- Score
- 81/100
- State rank
- #92
- US rank
- #1414
Category grades
Schools grade is shown separately in the Schools card above.
Census & demographics
- Census place
- Irondequoit, NY
- County
- Monroe County · 674,131 people
- City population
- 74,252
- Metro
- Rochester, NY
- Population (ZIP)
- 21,788
- Household income
- $90,192
- Rent vs Own
- Severe rent burden
- 426.0
Population outlook (Monroe County) Hauer SSP2
- Today (2025)
- 759,460 people
- By 2030
- 757,154 · -0.3%
- By 2040
- 740,644 · -2.5%
- By 2050
- 714,443 · -5.9%
- By 2075
- 645,883 · -15.0%
- By 2100
- 547,084 · -28.0%
Race, ethnicity, and origin ACS 2023
- Neighborhood character
- Predominantly White (85%)
- Race & ethnicity
- White 85% Hispanic / Latino 8% Two or more races 6% Black 4%
- Hispanic origin (detail)
- Puerto Rican 4%
- Common ancestry
- Romanian 6% Iranian 3% Lithuanian 3%
- Foreign-born
- 4% · Canada
- Languages at home
- 93% English-only · Spanish 4% Other Indo-European 1% Russian/Polish/Slavic 1%
Political lean MEDSL · Monroe
- 2024 margin
- D (+19.1) · D 59.5% · R 40.5%
- 2008→2024 swing
- +1.4pp toward D · 2008: 17.7pp · 2024: 19.1pp
- All cycles
- 2024: D+19.1 2020: D+21.0 2016: D+14.1 2012: D+17.4 2008: D+17.7
Not yet ingested
- Civics
- —
Market trends
- HPI YoY
- ▼ -148.22%
- Current HPI
- 263.9973
- Rent YoY
- —
- Metro
- Rochester, NY
- State GDP YoY
- ▲ 2.60%
- F500 in state
- 92
Industry mix (Fortune 500 HQ in NY)
| Industry | F500 HQs | Revenue |
|---|---|---|
| Financial Services | 10 | $950B |
|
||
| Consumer Goods | 9 | $162B |
|
||
| Insurance | 4 | $225B |
|
||
| Telecommunications | 2 | $144B |
|
||
| Pharmaceuticals | 2 | $112B |
|
||
| Media / Entertainment | 2 | $69B |
|
||
Price history
-5.3% since first listed12 events — show timeline
- 2026-05-08 Pending — UNYREIS
- 2026-04-27 Price Changed $270,000 UNYREIS
- 2026-04-23 Price Changed $280,000 UNYREIS
- 2026-04-08 Listed $285,000 UNYREIS
- 2026-03-15 Listing Removed — UNYREIS
- 2026-03-13 Relisted — UNYREIS
- 2026-02-27 Contingent — UNYREIS
- 2026-02-27 Pending — UNYREIS
- 2026-02-13 Contingent — UNYREIS
- 2026-02-04 Listed $285,000 UNYREIS
- 2025-12-24 Listing Removed — UNYREIS
- 2025-12-04 Listed $285,000 UNYREIS
Property tax history
+2.5%/yrLatest (2025): $5,875 · +46.8% YoY. Source: county tax records.
Cash-flow waterfall
monthlySold comps — $/sqft
last 12 mo · ≤1 miLoading sold comps…