5305 Seacliff Pl #3 · San Diego, CA
Flood risk No data
- FEMA flood zone
- —
- Chance of flooding over 30 yrs
- —
- Est. flood insurance / yr
- —
Fire risk No data
- Est. fire insurance / yr
- —
Heat risk No data
- Hot days now (above threshold)
- —
- Hot days in 30 yrs
- —
Wind risk No data
- Chance of severe wind over 30 yrs
- —
Air-quality risk No data
- Unhealthy air days now
- —
- Unhealthy air days in 30 yrs
- —
Risk factors via First Street. Map © Google.
Why this score? — see what drove the D+ grade
The composite is a weighted blend of 9 inputs, each scored 0–100. Each bar is that input's sub-score; the figure is the points it added to the 100-point composite (weight × sub-score).
- ARV discount +15.0/15.0
- Cash flow +11.9/30.0
- Condition / age +5.0/5.0
- Schools +3.9/10.0
- Livability +3.8/5.0
- 1% rule +3.5/10.0
- DSCR +3.5/10.0
- Rent growth +2.4/5.0
- Appreciation +0.0/10.0
$448,895
🖨 Deal sheet 📄 Offer letter ✓ Due diligence
Listing remarks
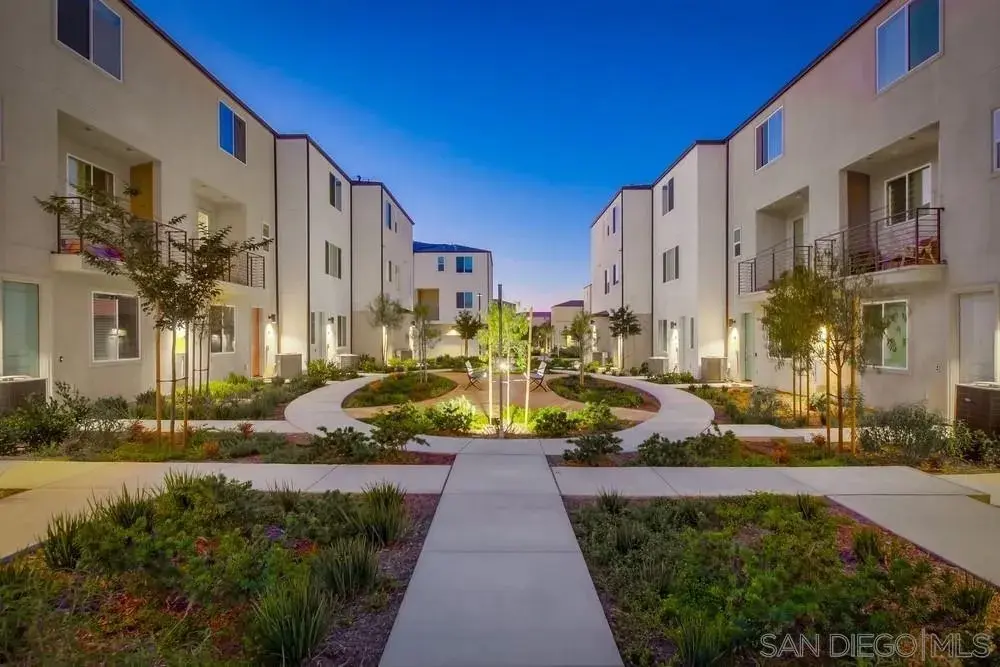
Brand new 3-story Affordable Housing Opportunity! Priced well below market as part of a DEED RESTRICTED AFFORDABLE HOUSING PROGRAM ideal for qualified, first time buyers seeking home ownership at a fraction of typical costs. Minimum household size of 4 required. Income and other eligibility restrictions apply. This spacious home offers 1,875 sf of modern living space, including an attached 2-car garage, and an additional bonus room, perfect for guest space or an office. With a multi-level layout, there's room for everyone to spread out and enjoy. Don't miss this opportunity to own a brand new townhome in the vibrant 92154 zip code!
Key facts
- $382 HOA
- 2 garage spots
- Built 2024
Property features AI
Finance
- HOA & community: Homeowners association with monthly fee of $382; HOA covers maintenance of grounds and maintenance of structure; Community/Building name: Agualuna; Subdivision: SAN DIEGO
Exterior
- Parking: Attached garage with garage door opener; 2 garage spaces (2 total parking spaces)
- Utilities: Public water; Public sewer
- Home design: Townhouse (residential); 3 stories; Entry level: 1; No one above and no one below (no shared vertically stacked units)
- Construction: Stucco construction; Composition roof
- Exterior features: Full fencing; Solar panels
Interior
- Kitchen: Gas range; Gas cooktop; Dishwasher; Disposal; Range hood
- Bedrooms: Potential for 4 bedrooms
- Bathrooms: 3 full bathrooms
- Heating & cooling: Central air conditioning; Forced air heating (natural gas)
- Interior features: Dishwasher; Disposal; Gas range; Gas cooktop; Range hood
Neighborhood map
What this means for you Summary
Snapshot
- This is a 3-bed/3.0-bath townhouse listed at $449k. Condition is rated excellent.
Deal economics
- At list price, monthly cash flow is $-112 ($-1k/yr) — negative.
- To cash-flow at today's rent, offer at most $429k (4.4% below list).
- To meet the 1% rule (rent ≥ 1% of price), the offer needs to be $383k (14.6% below list).
- Recommended offer: $383k (14.6% below list) — sets the bar for 1% rule.
- Cap rate 6.0% vs local median 2.0% in San Diego — top-decile yield for the area; either an underpriced asset or a hidden risk that comps aren't pricing in. Stress-test before assuming the spread holds.
Location & tenants
- Location reads 75/100 on livability (#123 in CA, #4,206 nationally) — a middle-class / working-renter tenant base. Strengths: amenities A+, commute A+, employment A+; Watch: health & safety C-, crime D+, cost of living F.
- Sweetwater Union High (suburban): math 36% / reading 52% proficiency, ranked #187 of 517 in CA (top 36%) — families likely to look elsewhere, expect single-tenant / working-renter base with shorter leases.
- Market conditions: Rents soft (-0.5%/yr); 210 active listings in the ZIP; 21 comparable units currently listed for rent nearby; rentals leasing fast (median 2d on market — plan ~1-2 weeks tenant-placement turnaround); solid renter incomes; 11,759 units permitted in San Diego County in 2024 (7,244 in 5+ unit buildings).
- At $3,833/mo this rent would consume 48% of the median local household income ($95k/yr) (locally 2959% of renters already pay >50% of income on rent) — very limited rent-growth headroom before tenants either downsize or default.
Forward outlook
- Local home prices are declining (-3.0%/yr); year-one equity from $3k of loan paydown is wiped out by about $13k of value loss. Plan a longer hold.
- San Diego County population projected at +20% by 2050 — long-run rental-demand tailwind backs the buy-and-hold thesis.
Negotiation context
- It's been on market 73 days — a 6% lower offer ($422k) is reasonable based on typical stale-listing flexibility.
Questions for the listing agent
- What do current leases actually rent for vs. the listed asking? Can we see a recent rent roll and the last 12 months of T-12 income?
- It's been on market 73 days. Have you received any prior offers? Is the seller open to a 15% concession, seller financing, or rate buy-down credit?
- What does the HOA fee cover, when was the last increase, and are there any pending special assessments or reserve-fund shortfalls?
- Why hasn't it sold? Are there any deal-killer items the seller is aware of (foundation, flood, title, zoning, code violations)?
- Is there a deadline driving the sale (1031 exchange, divorce, estate, relocation)? That informs how much negotiation room exists.
- Schools are B-rated — typically a magnet for longer-tenancy family renters. What's the average tenant stay here, and is there a school-zone premium baked into asking?
- Crime grade is D in this area — have there been break-ins, vandalism, or insurance claims at this property in the last 3 years? What carrier currently insures it and at what premium?
- The area grade is low — what's the realistic commute time and amenity access for the typical tenant pool here? Any planned neighborhood developments (good or bad) we should know about?
- What's the average days-on-market for RENTAL listings here right now (not sales)? A rising rental-DOM trend means longer vacancies and softer asking-rent achievability than the comps imply.
- What's the recent tenant-quality profile in this submarket — average credit score on applications, eviction rate, late-payment / NSF rate, and stable-employment percentage? A property-management company in the area should have these aggregated.
- How much new for-sale + rental construction is in the pipeline within 1–3 miles? Heavy new supply typically softens prices + rents 12–24 months out; constrained supply supports both.
Investment metrics
- 1% rule
- 0.85% ✗
- Cap rate
- 5.99%
- Cash-on-cash
- -1.07%
- DSCR
- 0.95
- GRM
- 9.8
CMA / ARV
- ARV (on-the-fly)
- $716,250
- Comps found
- 12
Show comp detail 12 sales within ~0.75 mi
| Address | Dist | Beds/Ba | Sqft | Sold | Price | $/sf | Match |
|---|---|---|---|---|---|---|---|
| 1700 Santa Gloria | 0.28mi | 3/3.0 | 1,829 (-2%) | 1mo | $670,000 | $366 | 82 |
| 5464 Shorefront Dr #148 | 0.11mi | 4/3.5 (+1) | 1,946 (+4%) | 1mo | $695,000 | $357 | 80 |
| 5212 Sunset Wave Dr #77 | 0.03mi | 4/3.0 (+1) | 1,702 (-9%) | 2mo | $670,000 | $394 | 77 |
| 5204 Beachfront Cove St #22 | 0.42mi | 4/3.5 (+1) | 1,875 (0%) | 2mo | $695,000 | $371 | 72 |
| 5551 Santa Alicia | 0.32mi | 4/3.5 (+1) | 1,829 (-2%) | 3mo | $715,000 | $391 | 72 |
| 5232 Beachfront Cove St #73 | 0.50mi | 4/3.5 (+1) | 1,875 (0%) | 3mo | $665,000 | $355 | 67 |
| 5407 Sand Arch Ln #206 | 0.54mi | 4/3.5 (+1) | 1,914 (+2%) | 0mo | $680,000 | $355 | 64 |
| 5479 San Alejandro | 0.19mi | 3/2.5 | 1,600 (-15%) | 2mo | $650,000 | $406 | 63 |
| 5264 Beachfront Cove St #214 | 0.43mi | 4/3.5 (+1) | 1,777 (-5%) | 2mo | $685,000 | $385 | 63 |
| 5261 Beachfront Cove St #174 | 0.44mi | 4/3.5 (+1) | 1,777 (-5%) | 3mo | $679,000 | $382 | 62 |
| 5502 Caminito Sandwaves #173 | 0.53mi | 4/3.5 (+1) | 1,777 (-5%) | 3mo | $685,000 | $385 | 58 |
| 5381 Calle Rockfish #63 | 0.54mi | 3/2.0 | 2,014 (+7%) | 2mo | $650,000 | $323 | 57 |
Match score weights: distance 35% · size 25% · config 20% · recency 20%. Top-matched comps best support the ARV.
Projected returns pro-forma
-3.0% appreciation · 0.0% rent growth · sell at horizon
- IRR
- -21.5%
- Equity multiple
- 0.28×
- Total profit
- $-91,026
- Equity at exit
- $66,932
- IRR
- -24.7%
- Equity multiple
- -0.05×
- Total profit
- $-131,530
- Equity at exit
- $38,812
Cash invested: $125,691 (down + closing). Projections, not guarantees.
Landlord ↔ Tenant lean methodology
- Overall (STATE)
- 18 Strongly Tenant-Friendly
- State California
- 18 Strongly Tenant-Friendly · D+13
- County
- — inherits STATE
- City
- — inherits STATE
ZIP-level market 92154
- Rents YoY
- -0.5%
- Active inventory
- 210
- Price-to-rent
- 9.8×
Monthly cashflow live
- Estimated rent
- $3,833 high interval (Pro) →
- Mortgage (P&I)
- −$2,354
- Tax from tax record
- −$217 /mo · $2,602/yr
- Insurance
- −$187
- HOA
- −$382
- Vacancy / Maint / Mgmt
- −$805
- Net cashflow
- $-112
Break-even live
UW: 25.0% down · 7.5% · 30yr · 1.5% tax · 5.0% vac · 8.0% maint · 8.0% mgmt
Financing live
Cash to close
- Down payment
- $112,224
- Closing costs
- $13,467
- Reserves months
- —
- Total cash needed
- —
Loan-product check · same deal, 3 products live
Conventional
25% down · 7.5% · 30yr
- Down + closing
- —
- Monthly P&I
- —
- Monthly cashflow
- —
- DSCR
- —
- Eligible?
- —
Personal DTI + credit; lowest rate.
DSCR
20% down · 8.5% · 30yr
- Down + closing
- —
- Monthly P&I
- —
- Monthly cashflow
- —
- DSCR
- —
- Eligible?
- —
No personal income docs; deal must DSCR.
Hard money
10% down · 12.0% · 12mo
- Down + closing
- —
- Monthly P&I
- —
- Monthly cashflow
- —
- DSCR
- —
- Eligible?
- —
Short-term bridge; refi at stabilization.
Rent comps 21 comps
| Address | Beds | Baths | Sqft | Rent | $/sqft | DOM | Units | Dist |
|---|---|---|---|---|---|---|---|---|
| 1644 Waterside Dr #60 San Diego, CA | 4.0 | 3.5 | 1946 | $4,295 | $2.21 | 1d | 1 | 0.10mi |
| 5480 Shorefront Dr #163 San Diego, CA | 4.0 | 3.5 | 1946 | $3,950 | $2.03 | 1d | 1 | 0.11mi |
| 5495 Seacliff Pl San Diego, CA | 4.0 | 3.5 | 1800 | $3,295 | $1.83 | 1d | 1 | 0.15mi |
| 5405 San Virgilio San Diego, CA | 3.0 | 3.0 | 1702 | $3,500 | $2.06 | 1d | 1 | 0.16mi |
| 1584 Santa Carolina San Diego, CA | 3.0 | 3.0 | 1485 | $3,750 | $2.53 | 1d | 1 | 0.16mi |
| 1723 San Eugenio San Diego, CA | 3.0 | 2.5 | 1686 | $3,995 | $2.37 | 2d | 1 | 0.27mi |
| 1741 San Jovani San Diego, CA | 3.0 | 2.5 | 1504 | $3,695 | $2.46 | 1d | 1 | 0.30mi |
| 5422 Beachfront Cv Unit 61 San Diego, CA | 2.0 | 2.5 | 1321 | $3,250 | $2.46 | 14d | 1 | 0.42mi |
| 5280 Beachfront Cove St #240 San Diego, CA | 4.0 | 2.5 | 1696 | $3,795 | $2.24 | 1d | 1 | 0.43mi |
| 5252 Beachfront Cove St #198 San Diego, CA | 4.0 | 3.5 | 1777 | $4,000 | $2.25 | 1d | 1 | 0.44mi |
| 5200 Beachside Ln San Diego, CA | 2.0 | 2.0 | 1332 | $3,050 | $2.29 | 10d | 1 | 0.59mi |
| 1205 Calle Seabass #46 San Diego, CA | 4.0 | 4.0 | 2034 | $4,195 | $2.06 | 1d | 1 | 0.71mi |
| 5134 Seaglen Way San Diego, CA | 4.0 | 3.0 | 1934 | $5,500 | $2.84 | 1d | 1 | 0.77mi |
| 5944 Vista Santa Catarina San Diego, CA | 4.0 | 2.5 | 2166 | $4,500 | $2.08 | 1d | 1 | 1.00mi |
| 6349 Avenida de las Vistas #4 San Diego, CA | 3.0 | 2.5 | 1471 | $3,200 | $2.18 | 1d | 1 | 1.04mi |
| 732 Silver Shoals Pt San Diego, CA | 4.0 | 3.0 | 2200 | $7,000 | $3.18 | 24d | 1 | 1.42mi |
| 2115 Reed Dr San Diego, CA | 3.0 | 2.5 | 1254 | $3,600 | $2.87 | 2d | 1 | 1.44mi |
| 2052 Vela Ln San Diego, CA | 3.0 | 3.0 | 1385 | $3,650 | $2.64 | 1d | 1 | 1.46mi |
| 4483 Corona Borealis San Diego, CA | 2.0 | 2.5 | 1400 | $3,800 | $2.71 | 14d | 1 | 1.48mi |
| 2126 Senita Dr San Diego, CA | 3.0 | 3.0 | 1385 | $3,988 | $2.88 | 1d | 1 | 1.48mi |
| 2105 Senita Dr San Diego, CA | 3.0 | 3.0 | 1385 | $3,998 | $2.89 | 1d | 1 | 1.48mi |
HOA detail
- Monthly dues
- $382 · $4,584/yr
Listing history 15 events
-
2026-06-18days on market $448,895 Active 73 DOM
-
2026-06-17days on market $448,895 Active 72 DOM
-
2026-06-16days on market $448,895 Active 71 DOM
-
2026-06-15days on market $448,895 Active 70 DOM
-
2026-06-13days on market $448,895 Active 68 DOM
-
2026-06-13days on market $448,895 Active 67 DOM
-
2026-06-09days on market $448,895 Active 64 DOM
-
2026-06-08days on market $448,895 Active 63 DOM
-
2026-06-07days on market $448,895 Active 62 DOM
-
2026-06-04days on market $448,895 Active 59 DOM
-
2026-06-03days on market $448,895 Active 58 DOM
-
2026-06-02days on market $448,895 Active 57 DOM
-
2026-06-01days on market $448,895 Active 56 DOM
-
2026-05-31days on market $448,895 Active 55 DOM
-
2026-04-06$448,895 Active
ⓘ Source: listings_history table (triggers on properties + properties_extension) + one-shot
backfill from property_details.listing_events for pre-trigger history.
Tax reassessment forecast CA · Resets to sale price
- Current annual tax
- $2,602 · $217/mo
- Projected year-2 tax
- $3,412 · $284/mo
- Expected delta
- +$810/yr (+$67/mo · 31.1%)
ⓘ Screening estimate from a state-policy table — verify with the county assessor before closing.
Nearby sold comps map
Loading sold comps map…
Walkable amenities ~0.75 mi
Loading nearby amenities…
Taxation est. · year 1
- Rental income
- $45,994
- − Mortgage interest
- −$25,145
- − Property taxes
- −$2,602
- − Insurance
- −$2,244
- − Repairs & maintenance
- −$3,679
- − Management
- −$3,679
- − HOA
- −$4,584
- − Depreciation
- −$13,059
- Taxable loss
- −$9,000
- Est. tax savings @ 24.0%
- +$2,160
- After-tax cash flow
- $816/yr
For passive investors: Depreciation is non-cash, so a rental often shows a tax loss while cash-flowing — sheltering income. Rental losses are passive: they offset passive income freely, and up to $25,000/yr can offset ordinary (W-2) income if you actively participate and your MAGI is under $100k (phasing out to $0 by $150k); unused losses carry forward. On sale, claimed depreciation is recaptured at up to 25%, and gains may owe capital-gains tax (a 1031 exchange can defer both). Figures are a year-1 estimate at your 24.0% rate — not tax advice; consult a CPA.
Condition & rehab AI · 12 photos
This brand new, move-in-ready townhome in San Diego's 92154 zip code is in excellent condition with no visible repairs or maintenance needed. It offers modern living space, a spacious layout, and a well-maintained exterior and interior. Potential buyers and tenants can expect a high return on investment with minimal updates required.
Value-add opportunities
- Both Painting the exterior and interior walls — Fresh paint can enhance curb appeal and interior aesthetics.
- Both Installing new flooring in the kitchen and bathrooms — New flooring can improve the overall look and feel of the home.
- Both Upgrading the kitchen appliances — Modern appliances can increase the home's appeal and value.
- Both Landscaping improvements — Enhanced landscaping can boost curb appeal and attract potential buyers/tenants.
- Both Adding smart home features — Smart home features can increase the home's appeal and value, especially for tech-savvy buyers/tenants.
Renovation cost estimate screening
Value-add ROI direction
- Both Painting the exterior and interior walls — Fresh paint can enhance curb appeal and interior aesthetics. ↑
- Both Installing new flooring in the kitchen and bathrooms — New flooring can improve the overall look and feel of the home. ↑
- Both Upgrading the kitchen appliances — Modern appliances can increase the home's appeal and value. ↑
- Both Landscaping improvements — Enhanced landscaping can boost curb appeal and attract potential buyers/tenants. ↑
- Both Adding smart home features — Smart home features can increase the home's appeal and value, especially for tech-savvy buyers/tenants. ↑
ⓘ Cost ranges are severity-bucket heuristics (US national rule-of-thumb). Get contractor quotes + a written scope before underwriting a rehab budget.
Schools (NCES district)
- District
- Sweetwater Union High
- NCES district ID
- 0638640
- Math proficiency
- 36% ▲ 3.00%
- Reading proficiency
- 52% ▼ -2.00%
- Median HH income
- $59,051
- Composite
- 38.61/100
- National rank
- #4158
- State rank
- #187 of 517 in CA
Livability — San Diego
- Score
- 75/100
- State rank
- #123
- US rank
- #4206
Category grades
Schools grade is shown separately in the Schools card above.
Census & demographics
- Census place
- San Diego, CA
- County
- San Diego County · 3,178,799 people
- City population
- 1,397,612
- Metro
- San Diego-Chula Vista-Carlsbad, CA
- Population (ZIP)
- 80,445
- Household income
- $94,901
- Rent vs Own
- Severe rent burden
- 2959.0
Population outlook (San Diego County) Hauer SSP2
- Today (2025)
- 3,678,185 people
- By 2030
- 3,856,546 · +4.8%
- By 2040
- 4,171,407 · +13.4%
- By 2050
- 4,421,607 · +20.2%
- By 2075
- 4,831,599 · +31.4%
- By 2100
- 4,832,502 · +31.4%
Race, ethnicity, and origin ACS 2023
- Neighborhood character
- Predominantly Hispanic (68%)
- Race & ethnicity
- Hispanic / Latino 68% Two or more races 30% White 12% Asian 12% Black 5% Native American 1%
- Hispanic origin (detail)
- Mexican 65%
- Foreign-born
- 32% · Canada, China
- Languages at home
- 35% English-only · Spanish 56% Tagalog/Filipino 7% Chinese 1%
Political lean MEDSL · San Diego
- 2024 margin
- D (+16.8) · D 56.9% · R 40.1% · Other 2.9%
- 2008→2024 swing
- +6.6pp toward D · 2008: 10.2pp · 2024: 16.8pp
- All cycles
- 2024: D+16.8 2020: D+22.8 2016: D+17.8 2012: D+5.1 2008: D+10.2
Not yet ingested
- Civics
- —
Market trends
- HPI YoY
- ▼ -568.62%
- Current HPI
- 393.1836
- Rent YoY
- ▼ -0.52%
- Metro
- San Diego-Chula Vista-Carlsbad, CA
- State GDP YoY
- ▲ 3.21%
- F500 in state
- 116
Industry mix (Fortune 500 HQ in CA)
| Industry | F500 HQs | Revenue |
|---|---|---|
| Technology | 27 | $1,492B |
|
||
| Financial Services | 3 | $174B |
|
||
| Retail | 3 | $44B |
|
||
| Insurance | 3 | $26B |
|
||
| Media / Entertainment | 2 | $115B |
|
||
| Pharmaceuticals / Biotech | 2 | $62B |
|
||
Price history
1 event — show timeline
- 2026-04-06 Listed $448,895 SDMLS
Property tax history
+2.1%/yrLatest (2025): $2,602 · +2.1% YoY. Source: county tax records.
Cash-flow waterfall
monthlySold comps — $/sqft
last 12 mo · ≤1 miLoading sold comps…