500 Loop Rd · North Adams, MA
Flood risk 1/10 · Minimal
- FEMA flood zone
- —
- Chance of flooding over 30 yrs
- 0.0%
- Est. flood insurance / yr
- —
Fire risk 3/10 · Minor
- Est. fire insurance / yr
- $915 – $1,699
Heat risk 1/10 · Minimal
- Hot days now (above 87°F)
- 7 days/yr
- Hot days in 30 yrs
- 16 days/yr
Wind risk 4/10 · Minor
- Chance of severe wind over 30 yrs
- 9.0%
Air-quality risk 2/10 · Minimal
- Unhealthy air days now
- 1 days/yr
- Unhealthy air days in 30 yrs
- 1 days/yr
Risk factors via First Street. Map © Google.
Why this score? — see what drove the D grade
The composite is a weighted blend of 9 inputs, each scored 0–100. Each bar is that input's sub-score; the figure is the points it added to the 100-point composite (weight × sub-score).
- Cash flow +10.9/30.0
- ARV discount +7.5/15.0
- Appreciation +6.2/10.0
- DSCR +3.2/10.0
- Livability +2.8/5.0
- Rent growth +2.5/5.0
- Condition / age +2.5/5.0
- 1% rule +2.3/10.0
- Schools +2.1/10.0
$229,000
🖨 Deal sheet (PDF) 📄 Offer letter ✓ Due diligence
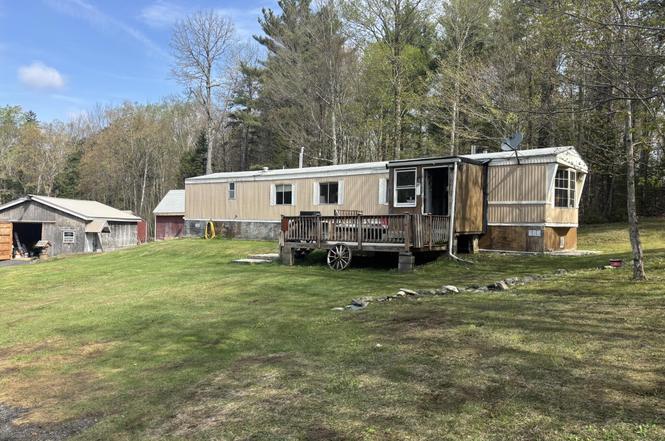
Listing remarks
Country Living in the lovely hamlet of Savoy. A 3 bedroom 1 bath manufactured home featuring kitchen, open living room with wood stove. Over 3.5 acres, multiple outbuildings included with power and heat. Wild life abounds, close to all cultural attractions, trails / state property. Title V completed, new carpets and new bathroom floor Possible some owner financing Start living the country life!
Key facts
- Open living room
- Wood stove
- New bathroom floor
Tags
Neighborhood map
What this means for you Summary
Snapshot
- This is a 2-bed/1.5-bath manufactured listed at $229k.
Deal economics
- At list price, monthly cash flow is $-99 ($-1k/yr) — negative.
- To cash-flow at today's rent, offer at most $212k (7.6% below list).
- To meet the 1% rule (rent ≥ 1% of price), the offer needs to be $167k (27.2% below list).
- Recommended offer: $167k (27.2% below list) — sets the bar for 1% rule.
Location & tenants
- Location reads 55/100 on livability (#242 in MA) — a working-class tenant base; expect higher turnover. Strengths: housing A+, cost of living A-; Watch: employment C-, health & safety D, crime F.
- Savoy (rural): math 0% / reading 40% proficiency, ranked #365 of 371 in MA (top 98%) — low school quality limits family demand, transient renter base, plan for 1-2y turnover.
- Zoned schools: Emma L Miller Elementary School (math 30% / reading 30%, grade F, #657 of 938 statewide, top 70%, 40 students, 0% FRL) — zoned schools average 0% FRL vs 38% district-wide (38 pts lower); this property's tenant base skews higher-income than the district average.
- Market conditions: 6 active listings in the ZIP; 130 units permitted in Berkshire County in 2024 (10 in 5+ unit buildings).
Forward outlook
- In year one you build about $7k of equity ($2k loan paydown + $6k appreciation (2.5% local appreciation)).
- Berkshire County population projected at -24% by 2050 — secular population decline; favor cash flow + early exit over multi-decade hold.
- By year 5, paydown + projected appreciation supports a ~$32k cash-out refi (75% LTV) — recoverable capital for the next deal without selling this one.
Negotiation context
- It's been on market 28 days — a 2% lower offer ($226k) is reasonable based on typical stale-listing flexibility.
- 3 sale attempts with the ask held roughly flat each time — persistent listings suggest the price (not the market) is what's stuck; bring a comps-based counter.
Questions for the listing agent
- What do current leases actually rent for vs. the listed asking? Can we see a recent rent roll and the last 12 months of T-12 income?
- Is there a deadline driving the sale (1031 exchange, divorce, estate, relocation)? That informs how much negotiation room exists.
- Schools are F-rated, which usually means shorter tenancies and higher turnover. Who's the typical renter profile here, and what's been the actual vacancy rate?
- Crime grade is F in this area — have there been break-ins, vandalism, or insurance claims at this property in the last 3 years? What carrier currently insures it and at what premium?
- The area grade is low — what's the realistic commute time and amenity access for the typical tenant pool here? Any planned neighborhood developments (good or bad) we should know about?
- What's the average days-on-market for RENTAL listings here right now (not sales)? A rising rental-DOM trend means longer vacancies and softer asking-rent achievability than the comps imply.
- What's the recent tenant-quality profile in this submarket — average credit score on applications, eviction rate, late-payment / NSF rate, and stable-employment percentage? A property-management company in the area should have these aggregated.
- How much new for-sale + rental construction is in the pipeline within 1–3 miles? Heavy new supply typically softens prices + rents 12–24 months out; constrained supply supports both.
Investment metrics
- 1% rule
- 0.73% ✗
- Cap rate
- 5.78%
- Cash-on-cash
- -1.84%
- DSCR
- 0.92
- GRM
- 11.4
CMA / ARV
No comps found within radius.
Projected returns pro-forma
2.49% appreciation · 3.0% rent growth · sell at horizon
- IRR
- 4.2%
- Equity multiple
- 1.24×
- Total profit
- $15,099
- Equity at exit
- $96,443
- IRR
- 7.6%
- Equity multiple
- 2.10×
- Total profit
- $70,266
- Equity at exit
- $143,743
Cash invested: $64,120 (down + closing). Projections, not guarantees.
Landlord ↔ Tenant lean methodology
- Overall (STATE)
- 20 Strongly Tenant-Friendly
- State Massachusetts
- 20 Strongly Tenant-Friendly · D+15
- County
- — inherits STATE
- City
- — inherits STATE
ZIP-level market 01256
- Home prices YoY
- 1.8%
- Active inventory
- 6
- Price-to-rent
- 11.4×
Monthly cashflow live
- Estimated rent
- $1,668 medium interval (Pro) →
- Mortgage (P&I)
- −$1,201
- Tax from tax record
- −$120 /mo · $1,437/yr
- Insurance
- −$95
- HOA
- −$0
- Vacancy / Maint / Mgmt
- −$350
- Net cashflow
- $-99
Break-even live
Sensitivity live
| Price | -10% $31 | -5% $-34 | +0% $-99 | +5% $-163 | +10% $-228 |
|---|---|---|---|---|---|
| Rent | -10% $-230 | -5% $-164 | +0% $-99 | +5% $-33 | +10% $33 |
| Rate | -1.0pp $17 | -0.5pp $-40 | base $-99 | +0.5pp $-158 | +1.0pp $-218 |
UW: 25.0% down · 7.5% · 30yr · 1.5% tax · 5.0% vac · 8.0% maint · 8.0% mgmt
Financing live
Cash to close
- Down payment
- $57,250
- Closing costs
- $6,870
- Reserves months
- —
- Total cash needed
- —
Loan-product check · same deal, 3 products live
Conventional
25% down · 7.5% · 30yr
- Down + closing
- —
- Monthly P&I
- —
- Monthly cashflow
- —
- DSCR
- —
- Eligible?
- —
Personal DTI + credit; lowest rate.
DSCR
20% down · 8.5% · 30yr
- Down + closing
- —
- Monthly P&I
- —
- Monthly cashflow
- —
- DSCR
- —
- Eligible?
- —
No personal income docs; deal must DSCR.
Hard money
10% down · 12.0% · 12mo
- Down + closing
- —
- Monthly P&I
- —
- Monthly cashflow
- —
- DSCR
- —
- Eligible?
- —
Short-term bridge; refi at stabilization.
Listing history 11 events
-
2026-03-31status Pending
-
2026-03-03$229,000 Active
-
2025-11-10status Pending
-
2025-11-08historical
-
2025-11-07historical
-
2025-10-02price $255,000
-
2025-09-18status Active
-
2025-09-15historical
-
2025-08-27price $275,000
-
2025-05-12price $299,999
-
2025-05-12$299,900 Active
ⓘ Source: listings_history table (triggers on properties + properties_extension) + one-shot
backfill from property_details.listing_events for pre-trigger history.
Tax reassessment forecast MA · Partial reset (capped growth)
- Current annual tax
- $1,437 · $120/mo
- Projected year-2 tax
- $2,127 · $177/mo
- Expected delta
- +$690/yr (+$57/mo · 48.0%)
ⓘ Screening estimate from a state-policy table — verify with the county assessor before closing.
Climate risk First Street
- Flood 1/10 Low 0% chance over 30 yrs
- Wildfire 3/10 Moderate
- Heat 1/10 Low 7 d/yr ≥87°F today · 16 d/yr by 30 yrs out
- Wind 4/10 Moderate 9% chance of damaging wind over 30 yrs
- Air quality 2/10 Low 1 unhealthy d/yr today · 1 by 30 yrs out
Nearby sold comps map
Loading sold comps map…
Walkable amenities ~0.75 mi
Loading nearby amenities…
Taxation est. · year 1
- Rental income
- $20,013
- − Mortgage interest
- −$12,828
- − Property taxes
- −$1,437
- − Insurance
- −$1,145
- − Repairs & maintenance
- −$1,601
- − Management
- −$1,601
- − Depreciation
- −$6,662
- Taxable loss
- −$5,260
- Est. tax savings @ 24.0%
- +$1,263
- After-tax cash flow
- $80/yr
For passive investors: Depreciation is non-cash, so a rental often shows a tax loss while cash-flowing — sheltering income. Rental losses are passive: they offset passive income freely, and up to $25,000/yr can offset ordinary (W-2) income if you actively participate and your MAGI is under $100k (phasing out to $0 by $150k); unused losses carry forward. On sale, claimed depreciation is recaptured at up to 25%, and gains may owe capital-gains tax (a 1031 exchange can defer both). Figures are a year-1 estimate at your 24.0% rate — not tax advice; consult a CPA.
Schools (NCES district)
- District
- Savoy
- NCES district ID
- 2510530
- Math proficiency
- 0% ▬ 0.00%
- Reading proficiency
- 40% ▬ 0.00%
- Median HH income
- $54,180
- Composite
- 21.48/100
- National rank
- #13629
- State rank
- #365 of 371 in MA
Livability — North Adams
- Score
- 55/100
- State rank
- #242
- US rank
- #23506
Category grades
Schools grade is shown separately in the Schools card above.
Census & demographics
- City population
- 14,967
- Population (ZIP)
- 733
Population outlook (Berkshire County) Hauer SSP2
- Today (2025)
- 119,723 people
- By 2030
- 114,608 · -4.3%
- By 2040
- 102,806 · -14.1%
- By 2050
- 91,305 · -23.7%
- By 2075
- 71,517 · -40.3%
- By 2100
- 57,988 · -51.6%
Race, ethnicity, and origin ACS 2023
- Neighborhood character
- Predominantly White (97%)
- Race & ethnicity
- White 97% Hispanic / Latino 2% Two or more races 1%
- Common ancestry
- Romanian 15% Lithuanian 13% Italian 6%
- Foreign-born
- 1% · Canada
- Languages at home
- 98% English-only · Spanish 2%
Political lean MEDSL · Berkshire
- 2024 margin
- Solid D (+39.9) · D 68.9% · R 29.0% · Other 2.1%
- 2008→2024 swing
- -12.5pp toward R · 2008: 52.4pp · 2024: 39.9pp
- All cycles
- 2024: D+39.9 2020: D+47.1 2016: D+41.5 2012: D+53.7 2008: D+52.4
Not yet ingested
- Civics
- —
Market trends
- HPI YoY
- ▲ 2.49%
- Current HPI
- 140.3059
- Rent YoY
- —
- Metro
- —
- State GDP YoY
- ▲ 2.28%
- F500 in state
- 38
Industry mix (Fortune 500 HQ in MA)
| Industry | F500 HQs | Revenue |
|---|---|---|
| Technology | 3 | $17B |
|
||
| Insurance | 2 | $84B |
|
||
| Retail | 2 | $76B |
|
||
| Life Sciences | 1 | $43B |
|
||
| Energy Technology | 1 | $31B |
|
||
| Aerospace / Defense | 1 | $18B |
|
||
Price history
-23.6% since first listed11 events — show timeline
- 2026-03-31 Pending — BCMLS
- 2026-03-03 Listed $229,000 BCMLS
- 2025-11-10 Pending — BCMLS
- 2025-11-08 Listing Removed — BCMLS
- 2025-11-07 Listing Removed — BCMLS
- 2025-10-02 Price Changed $255,000 BCMLS
- 2025-09-18 Relisted — BCMLS
- 2025-09-15 Listing Removed — BCMLS
- 2025-08-27 Price Changed $275,000 BCMLS
- 2025-05-12 Price Changed $299,999 BCMLS
- 2025-05-12 Listed $299,900 BCMLS
Property tax history
+3.7%/yrLatest (2023): $1,437 · +0.7% YoY. Source: county tax records.
Cash-flow waterfall
monthlySold comps — $/sqft
last 12 mo · ≤1 miLoading sold comps…