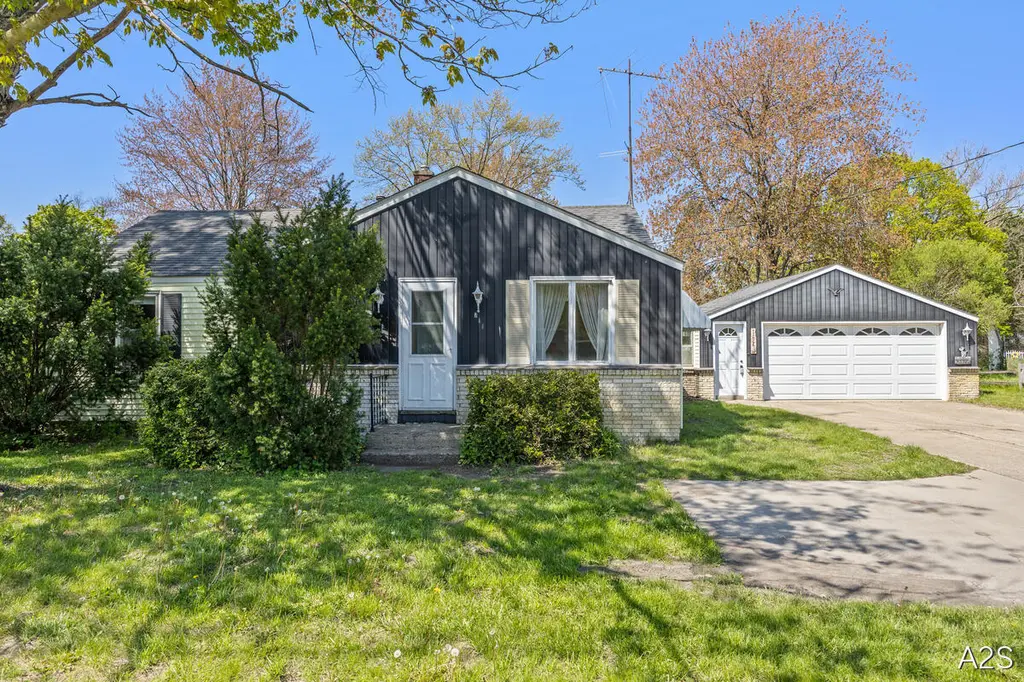
711 Riley St · Beechwood, MI
Flood risk 4/10 · Minor
- FEMA flood zone
- X (unshaded)
- Chance of flooding over 30 yrs
- 0.22%
- Est. flood insurance / yr
- $473 – $860
Fire risk 1/10 · Minimal
- Est. fire insurance / yr
- $784 – $1,456
Heat risk 2/10 · Minimal
- Hot days now (above 97°F)
- 7 days/yr
- Hot days in 30 yrs
- 15 days/yr
Wind risk 2/10 · Minimal
- Chance of severe wind over 30 yrs
- —
Air-quality risk 4/10 · Minor
- Unhealthy air days now
- 4 days/yr
- Unhealthy air days in 30 yrs
- 6 days/yr
Risk factors via First Street. Map © Google.
Why this score? — see what drove the C- grade
The composite is a weighted blend of 9 inputs, each scored 0–100. Each bar is that input's sub-score; the figure is the points it added to the 100-point composite (weight × sub-score).
- ARV discount +15.0/15.0
- Cash flow +14.9/30.0
- DSCR +4.6/10.0
- Livability +4.3/5.0
- Schools +3.9/10.0
- Rent growth +3.8/5.0
- 1% rule +3.3/10.0
- Condition / age +2.5/5.0
- Appreciation +0.0/10.0
$220,000
🖨 Deal sheet (PDF) 📄 Offer letter ✓ Due diligence
Listing remarks MLS
PRICED TO SELL! Home needs some love, but priced accordingly. Charming 3 Bedroom Ranch on Large Private Lot in Holland! Highest and best offers due on May 22.Offering over 1,300 sq ft of comfortable living space, this home combines classic charm. Inside, you'll find:G£ö Updated kitchen and bathG£ö Convenient main floor laundryG£ö Bright dining area with sliders to deckG£ö Spacious living areasG£ö Central air and forced-air heatStep outside to enjoy the private backyard featuring mature landscaping, flower gardens, fruit trees, underground sprinkling, and a large deck perfect for relaxing or entertaining. Additional highlights include:nÜù 2-stall attached garagenÅá Storage shed for extra spacenöº Home needs some love, but priced accordingly:Furnace & A/C (2002)Drain field (2004)Roof shingles (2005)Conveniently located near shopping, schools, and everyday amenities, this home offers incredible value
Key facts
- 0.38 acre lot
- 2 garage spots
- Built 1946
Neighborhood map
What this means for you Summary
Snapshot
- This is a 3-bed/1.0-bath single-family listed at $220k.
Deal economics
- At list price, monthly cash flow is $66 ($787/yr) — positive.
- The deal already cash-flows at list — no discount required.
- To meet the 1% rule (rent ≥ 1% of price), the offer needs to be $182k (17.2% below list).
- Recommended offer: $182k (17.2% below list) — sets the bar for 1% rule.
- Cap rate 6.7% vs local median 3.6% in Beechwood — top-decile yield for the area; either an underpriced asset or a hidden risk that comps aren't pricing in. Stress-test before assuming the spread holds.
Location & tenants
- Location reads 86/100 on livability (#21 in MI, #378 nationally) — a professional / high-income tenant draw. Strengths: crime A+, cost of living A+, housing A+; Watch: employment D.
- West Ottawa Public School District (suburban): math 37% / reading 52% proficiency, ranked #140 of 540 in MI (top 26%) — families likely to look elsewhere, expect single-tenant / working-renter base with shorter leases.
- Zoned schools: Great Lakes Elementary School (math 29% / reading 39%, grade F, #798 of 1,397 statewide, top 57%, 409 students, 74% FRL); Harbor Lights Middle School (math 38% / reading 53%, grade D+, #161 of 493 statewide, top 33%, 817 students, 52% FRL); West Ottawa High School Campus (math 39% / reading 62%, grade D+, #146 of 713 statewide, top 21%, 2,196 students, 51% FRL).
- Market conditions: Rents rising fast (+5.1%/yr); 343 active listings in the ZIP; 3 comparable units currently listed for rent nearby; rentals leasing fast (median 4d on market — plan ~1-2 weeks tenant-placement turnaround); solid renter incomes; 1,237 units permitted in Ottawa County in 2024 (443 in 5+ unit buildings).
Forward outlook
- Local home prices are declining (-3.0%/yr); year-one equity from $2k of loan paydown is wiped out by about $7k of value loss. Plan a longer hold.
- Ottawa County population projected at +24% by 2050 — long-run rental-demand tailwind backs the buy-and-hold thesis.
Negotiation context
- It's been on market 15 days — a 2% lower offer ($217k) is reasonable based on typical stale-listing flexibility.
- 5 sale attempts since 14y ago with the ask held roughly flat each time — persistent listings suggest the price (not the market) is what's stuck; bring a comps-based counter.
- Current owner paid $70k; list at $220k implies a 214% gain — meaningful room to come down on a strong offer.
Risks & watch-outs
- Watch-outs: built in 1946 — expect roof / HVAC / electrical / plumbing capex.
Questions for the listing agent
- Built in 1946 — when were the roof, HVAC, electrical panel, plumbing, and water heater last replaced?
- Is there a deadline driving the sale (1031 exchange, divorce, estate, relocation)? That informs how much negotiation room exists.
- Schools are F-rated, which usually means shorter tenancies and higher turnover. Who's the typical renter profile here, and what's been the actual vacancy rate?
- What's the average days-on-market for RENTAL listings here right now (not sales)? A rising rental-DOM trend means longer vacancies and softer asking-rent achievability than the comps imply.
- What's the recent tenant-quality profile in this submarket — average credit score on applications, eviction rate, late-payment / NSF rate, and stable-employment percentage? A property-management company in the area should have these aggregated.
- How much new for-sale + rental construction is in the pipeline within 1–3 miles? Heavy new supply typically softens prices + rents 12–24 months out; constrained supply supports both.
Investment metrics
- 1% rule
- 0.83% ✗
- Cap rate
- 6.65%
- Cash-on-cash
- 1.28%
- DSCR
- 1.06
- GRM
- 10.1
CMA / ARV
- ARV (median comp)
- $280,858
- List price
- $220,000
- Delta
- -21.67%
- Verdict
- UNDERPRICED
- Comps
- 20 within 1.0 mi
Show comp detail 6 sales within ~0.75 mi
| Address | Dist | Beds/Ba | Sqft | Sold | Price | $/sf | Match |
|---|---|---|---|---|---|---|---|
| 971 Shadybrook Dr | 0.33mi | 3/1.5 | 1,107 (-10%) | 9mo | $344,900 | $312 | 60 |
| 3590 142nd Ave | 0.59mi | 3/1.5 | 1,128 (-8%) | 1mo | $350,000 | $310 | 56 |
| 781 Shadybrook Dr | 0.42mi | 3/2.0 | 1,400 (+14%) | 8mo | $385,200 | $275 | 45 |
| 434 Riley St | 0.60mi | 3/1.5 | 1,368 (+12%) | 6mo | $330,000 | $241 | 45 |
| 14628 Riley St | 0.20mi | 3/1.5 | 1,404 (+15%) | 23mo | $310,000 | $221 | 45 |
| 14163 Ridgewood Dr | 0.66mi | 4/1.5 (+1) | 1,092 (-11%) | 9mo | $284,000 | $260 | 36 |
Match score weights: distance 35% · size 25% · config 20% · recency 20%. Top-matched comps best support the ARV.
Projected returns pro-forma
-3.0% appreciation · 5.08% rent growth · sell at horizon
- IRR
- -12.2%
- Equity multiple
- 0.55×
- Total profit
- $-27,648
- Equity at exit
- $32,803
- IRR
- -0.5%
- Equity multiple
- 0.96×
- Total profit
- $-2,303
- Equity at exit
- $19,022
Cash invested: $61,600 (down + closing). Projections, not guarantees.
Landlord ↔ Tenant lean methodology
- Overall (STATE)
- 62 Landlord-Friendly
- State Michigan
- 62 Landlord-Friendly · EVEN
- County
- — inherits STATE
- City
- — inherits STATE
ZIP-level market 49424
- Rents YoY
- 5.1%
- Active inventory
- 343
- Price-to-rent
- 10.1×
Monthly cashflow live
- Estimated rent
- $1,821 medium interval (Pro) →
- Mortgage (P&I)
- −$1,154
- Tax from tax record
- −$127 /mo · $1,528/yr
- Insurance
- −$92
- HOA
- −$0
- Vacancy / Maint / Mgmt
- −$382
- Net cashflow
- $66
Break-even live
Sensitivity live
| Price | -10% $190 | -5% $128 | +0% $66 | +5% $3 | +10% $-59 |
|---|---|---|---|---|---|
| Rent | -10% $-78 | -5% $-6 | +0% $66 | +5% $137 | +10% $209 |
| Rate | -1.0pp $176 | -0.5pp $122 | base $66 | +0.5pp $9 | +1.0pp $-49 |
UW: 25.0% down · 7.5% · 30yr · 1.5% tax · 5.0% vac · 8.0% maint · 8.0% mgmt
Financing live
Cash to close
- Down payment
- $55,000
- Closing costs
- $6,600
- Reserves months
- —
- Total cash needed
- —
Loan-product check · same deal, 3 products live
Conventional
25% down · 7.5% · 30yr
- Down + closing
- —
- Monthly P&I
- —
- Monthly cashflow
- —
- DSCR
- —
- Eligible?
- —
Personal DTI + credit; lowest rate.
DSCR
20% down · 8.5% · 30yr
- Down + closing
- —
- Monthly P&I
- —
- Monthly cashflow
- —
- DSCR
- —
- Eligible?
- —
No personal income docs; deal must DSCR.
Hard money
10% down · 12.0% · 12mo
- Down + closing
- —
- Monthly P&I
- —
- Monthly cashflow
- —
- DSCR
- —
- Eligible?
- —
Short-term bridge; refi at stabilization.
Rent comps 3 comps
| Address | Beds | Baths | Sqft | Rent | $/sqft | DOM | Units | Dist |
|---|---|---|---|---|---|---|---|---|
| 477 W Mae Rose Ave Holland, MI | 2.0 | 1.5 | 1200 | $1,500 | $1.25 | 4d | 1 | 0.59mi |
| 13620 Carmella Ln Holland, MI | 2.0–3.0 | 1.5–2.0 | 1085 | $1,841 | $1.70 | 4d | 7 | 1.23mi |
| 539 136th Ave Holland, MI | 2.0 | 1.0 | 889 | $1,450 | $1.63 | 4d | 1 | 1.48mi |
Listing history 8 events
-
2026-05-08$220,000 Active 1007-char remark
Show marketing remark (1007 chars)
PRICED TO SELL! Home needs some love, but priced accordingly. Charming 3 Bedroom Ranch on Large Private Lot in Holland! Highest and best offers due on May 22.Offering over 1,300 sq ft of comfortable living space, this home combines classic charm. Inside, you'll find:G£ö Updated kitchen and bathG£ö Convenient main floor laundryG£ö Bright dining area with sliders to deckG£ö Spacious living areasG£ö Central air and forced-air heatStep outside to enjoy the private backyard featuring mature landscaping, flower gardens, fruit trees, underground sprinkling, and a large deck perfect for relaxing or entertaining. Additional highlights include:nÜù 2-stall attached garagenÅá Storage shed for extra spacenöº Home needs some love, but priced accordingly:Furnace & A/C (2002)Drain field (2004)Roof shingles (2005)Conveniently located near shopping, schools, and everyday amenities, this home offers incredible value
-
2026-05-08$220,000 Active
Show marketing remark (1007 chars)
PRICED TO SELL! Home needs some love, but priced accordingly. Charming 3 Bedroom Ranch on Large Private Lot in Holland! Highest and best offers due on May 22.Offering over 1,300 sq ft of comfortable living space, this home combines classic charm. Inside, you'll find:G£ö Updated kitchen and bathG£ö Convenient main floor laundryG£ö Bright dining area with sliders to deckG£ö Spacious living areasG£ö Central air and forced-air heatStep outside to enjoy the private backyard featuring mature landscaping, flower gardens, fruit trees, underground sprinkling, and a large deck perfect for relaxing or entertaining. Additional highlights include:nÜù 2-stall attached garagenÅá Storage shed for extra spacenöº Home needs some love, but priced accordingly:Furnace & A/C (2002)Drain field (2004)Roof shingles (2005)Conveniently located near shopping, schools, and everyday amenities, this home offers incredible value
-
2012-12-19soldstatus $70,000
-
2012-12-14soldstatus $70,000
-
2012-12-14soldstatus $70,000
-
2012-09-05$79,900
-
2012-09-05$79,900
ⓘ Source: listings_history table (triggers on properties + properties_extension) + one-shot
backfill from property_details.listing_events for pre-trigger history.
Tax reassessment forecast MI · Partial reset (capped growth)
- Current annual tax
- $1,528 · $127/mo
- Projected year-2 tax
- $2,458 · $205/mo
- Expected delta
- +$930/yr (+$77/mo · 60.8%)
ⓘ Screening estimate from a state-policy table — verify with the county assessor before closing.
Climate risk First Street
- Flood 4/10 Moderate FEMA zone X (unshaded) · 22% chance over 30 yrs
- Wildfire 1/10 Low
- Heat 2/10 Low 7 d/yr ≥97°F today · 15 d/yr by 30 yrs out
- Wind 2/10 Low
- Air quality 4/10 Moderate 4 unhealthy d/yr today · 6 by 30 yrs out
Nearby sold comps map
Loading sold comps map…
Walkable amenities ~0.75 mi
Loading nearby amenities…
Taxation est. · year 1
- Rental income
- $21,847
- − Mortgage interest
- −$12,323
- − Property taxes
- −$1,528
- − Insurance
- −$1,100
- − Repairs & maintenance
- −$1,748
- − Management
- −$1,748
- − Depreciation
- −$6,400
- Taxable loss
- −$3,000
- Est. tax savings @ 24.0%
- +$720
- After-tax cash flow
- $1,507/yr
For passive investors: Depreciation is non-cash, so a rental often shows a tax loss while cash-flowing — sheltering income. Rental losses are passive: they offset passive income freely, and up to $25,000/yr can offset ordinary (W-2) income if you actively participate and your MAGI is under $100k (phasing out to $0 by $150k); unused losses carry forward. On sale, claimed depreciation is recaptured at up to 25%, and gains may owe capital-gains tax (a 1031 exchange can defer both). Figures are a year-1 estimate at your 24.0% rate — not tax advice; consult a CPA.
Schools (NCES district)
- District
- West Ottawa Public School District
- NCES district ID
- 2635910
- Math proficiency
- 37% ▼ -4.00%
- Reading proficiency
- 52% ▼ -4.00%
- Median HH income
- $58,127
- Composite
- 38.94/100
- National rank
- #4087
- State rank
- #140 of 540 in MI
Livability — Beechwood
- Score
- 86/100
- State rank
- #21
- US rank
- #378
Category grades
Schools grade is shown separately in the Schools card above.
Census & demographics
- County
- Ottawa County · 144,142 people
- Metro
- Grand Rapids-Kentwood, MI
- Population (ZIP)
- 49,810
- Household income
- $85,478
- Rent vs Own
- Severe rent burden
- 864.0
Population outlook (Ottawa County) Hauer SSP2
- Today (2025)
- 313,561 people
- By 2030
- 330,027 · +5.3%
- By 2040
- 361,118 · +15.2%
- By 2050
- 388,414 · +23.9%
- By 2075
- 452,175 · +44.2%
- By 2100
- 473,041 · +50.9%
Race, ethnicity, and origin ACS 2023
- Neighborhood character
- Predominantly White (65%)
- Race & ethnicity
- White 65% Hispanic / Latino 25% Two or more races 10% Asian 6% Black 1%
- Hispanic origin (detail)
- Mexican 19% Puerto Rican 1%
- Common ancestry
- Iranian 22% Romanian 3% Lithuanian 2%
- Foreign-born
- 11% · Canada, Vietnam, South Korea
- Languages at home
- 80% English-only · Spanish 15% Other Asian/Pacific 3% Vietnamese 1%
Political lean MEDSL · Ottawa
- 2024 margin
- Strong R (+20.4) · D 39.0% · R 59.5% · Other 1.5%
- 2008→2024 swing
- +3.4pp toward D · 2008: -23.9pp · 2024: -20.4pp
- All cycles
- 2024: R+20.4 2020: R+21.5 2016: R+30.4 2012: R+34.2 2008: R+23.9
Not yet ingested
- Civics
- —
Market trends
- HPI YoY
- ▼ -240.90%
- Current HPI
- 252.5142
- Rent YoY
- ▲ 5.08%
- Metro
- Grand Rapids-Kentwood, MI
- State GDP YoY
- ▲ 1.37%
- F500 in state
- 28
Industry mix (Fortune 500 HQ in MI)
| Industry | F500 HQs | Revenue |
|---|---|---|
| Automotive Parts | 3 | $48B |
|
||
| Automotive | 2 | $372B |
|
||
| Chemicals | 1 | $45B |
|
||
| Automotive Retail | 1 | $29B |
|
||
| Healthcare / Medical Devices | 1 | $23B |
|
||
| Automotive Technology | 1 | $20B |
|
||
Price history
+175.3% since first listed11 events — show timeline
- 2026-05-23 Pending — MiRealSource-MiMLS
- 2026-05-23 Pending — REALCOMP
- 2026-05-23 Pending — SW Michigan MLS
- 2026-05-08 Listed $220,000 SW Michigan MLS
- 2026-05-08 Listed $220,000 REALCOMP
- 2026-05-08 Listed $220,000 MiRealSource-MiMLS
- 2012-12-19 Sold (Public Records) $70,000 Public Records
- 2012-12-14 Sold (MLS) $70,000 REALCOMP
- 2012-12-14 Sold (MLS) $70,000 SW Michigan MLS
- 2012-09-05 Listed $79,900 REALCOMP
- 2012-09-05 Listed $79,900 SW Michigan MLS
Property tax history
+3.2%/yrLatest (2025): $1,528 · +3.2% YoY. Source: county tax records.
Cash-flow waterfall
monthlySold comps — $/sqft
last 12 mo · ≤1 miLoading sold comps…