18 Windmill Rd · Southwood Acres, CT
Flood risk 1/10 · Minimal
- FEMA flood zone
- X (unshaded)
- Chance of flooding over 30 yrs
- 0.0%
- Est. flood insurance / yr
- $473 – $860
Fire risk 1/10 · Minimal
- Est. fire insurance / yr
- $829 – $1,539
Heat risk 5/10 · Moderate
- Hot days now (above 99°F)
- 7 days/yr
- Hot days in 30 yrs
- 16 days/yr
Wind risk 6/10 · Moderate
- Chance of severe wind over 30 yrs
- 27.0%
Air-quality risk 3/10 · Minor
- Unhealthy air days now
- 2 days/yr
- Unhealthy air days in 30 yrs
- 3 days/yr
Risk factors via First Street. Map © Google.
Why this score? — see what drove the D grade
The composite is a weighted blend of 9 inputs, each scored 0–100. Each bar is that input's sub-score; the figure is the points it added to the 100-point composite (weight × sub-score).
- ARV discount +14.6/15.0
- Cash flow +10.2/30.0
- Livability +3.6/5.0
- Rent growth +3.5/5.0
- 1% rule +3.2/10.0
- Schools +3.0/10.0
- DSCR +2.9/10.0
- Condition / age +2.5/5.0
- Appreciation +0.0/10.0
$315,000
🖨 Deal sheet (PDF) 📄 Offer letter ✓ Due diligence
Listing remarks
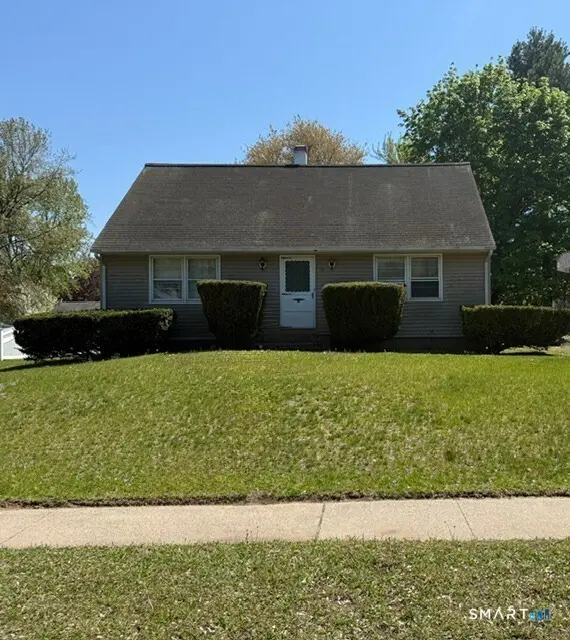
Charming Cape Cod-style home offering 4 bedrooms and 1 full bathroom, ready for your personal touch and creative vision. This property is full of potential and just waiting to be brought back to life with a little TLC. Inside, you'll find a flexible layout with plenty of space to customize to your needs. The home features a full basement, providing ample storage or the opportunity for additional living space. Outside, enjoy a large yard-perfect for gardening, entertaining, or expanding your outdoor oasis. Whether you're an investor, renovator, or looking for a home to build equity, this is a fantastic opportunity to create something special. Bring your ideas and make this home shine!
Key facts
- Large yard
- Full basement
- Cape cod style
Tags
Property features AI
Exterior
- Parking: 3 total parking spaces; Off-street parking; Driveway
- Utilities: Public water connected; Public sewer connected; Natural gas service
- Home design: Single family home
- Construction: Concrete foundation; Concrete construction
- Exterior features: Level lot; Vinyl siding; Asphalt shingle roof; Private paved driveway; Off-street paved parking and driveway
Interior
- Kitchen: Electric range; Oven/Range; Refrigerator; Dishwasher
- Bedrooms: 4 bedrooms
- Bathrooms: 1 full bathroom
- Heating & cooling: Hot water heat (natural gas); Window unit cooling
- Interior features: Cable available; Full basement; Attic with access via hatch
- Laundry & utility: Washer; Dryer; Window unit cooling; Hot water: natural gas (domestic)
Neighborhood map
What this means for you Summary
Snapshot
- This is a 4-bed/1.0-bath single-family listed at $315k.
Deal economics
- At list price, monthly cash flow is $-178 ($-2k/yr) — negative.
- To cash-flow at today's rent, offer at most $284k (10.0% below list).
- To meet the 1% rule (rent ≥ 1% of price), the offer needs to be $259k (17.7% below list).
- Recommended offer: $259k (17.7% below list) — sets the bar for 1% rule.
- Cap rate 5.6% vs local median 4.2% in Southwood Acres — top-decile yield for the area; either an underpriced asset or a hidden risk that comps aren't pricing in. Stress-test before assuming the spread holds.
Location & tenants
- Location reads 72/100 on livability (#83 in CT) — a middle-class / working-renter tenant base. Strengths: employment A+, housing A+, crime A; Watch: cost of living C-, amenities F, commute F.
- Enfield School District (suburban): math 25% / reading 41% proficiency, ranked #114 of 153 in CT (top 74%) — families likely to look elsewhere, expect single-tenant / working-renter base with shorter leases.
- Zoned schools: Edgar H. Parkman School (math 32% / reading 45%, grade F, #312 of 553 statewide, top 57%, 269 students, 48% FRL); John F. Kennedy Middle School (math 22% / reading 39%, grade F, #138 of 175 statewide, top 79%, 1,096 students, 46% FRL); Enfield High School (math 29% / reading 54%, grade F, #102 of 194 statewide, top 53%, 1,490 students, 40% FRL) — zoned schools average 45% FRL vs 29% district-wide (16 pts higher); higher-poverty schools than district average — tighter screening recommended.
- Market conditions: Rents rising (+3.9%/yr); 188 active listings in the ZIP; 1 comparable units currently listed for rent nearby; solid renter incomes; 1,867 units permitted in Capitol Planning Region in 2024 (1,399 in 5+ unit buildings).
- This rent runs 34% of the median local income ($90k/yr) — at the standard rent-burdened threshold; future hikes will face affordability resistance.
Forward outlook
- Local home prices are declining (-3.0%/yr); year-one equity from $2k of loan paydown is wiped out by about $9k of value loss. Plan a longer hold.
Negotiation context
- It's been on market 50 days — a 3% lower offer ($306k) is reasonable based on typical stale-listing flexibility.
- 2 sale attempts with the ask held roughly flat each time — persistent listings suggest the price (not the market) is what's stuck; bring a comps-based counter.
Risks & watch-outs
- Climate carrying-cost: major wind risk, 27% chance of damaging wind over 30y; extreme-heat days projected 7→16/yr by 2055 (HVAC capex compounding) — expect insurance premiums to compound above CPI over the hold.
Questions for the listing agent
- What do current leases actually rent for vs. the listed asking? Can we see a recent rent roll and the last 12 months of T-12 income?
- It's been on market 50 days. Have you received any prior offers? Is the seller open to a 18% concession, seller financing, or rate buy-down credit?
- Built in 1971 — when were the roof, HVAC, electrical panel, plumbing, and water heater last replaced?
- Is there a deadline driving the sale (1031 exchange, divorce, estate, relocation)? That informs how much negotiation room exists.
- The area grade is low — what's the realistic commute time and amenity access for the typical tenant pool here? Any planned neighborhood developments (good or bad) we should know about?
- What's the average days-on-market for RENTAL listings here right now (not sales)? A rising rental-DOM trend means longer vacancies and softer asking-rent achievability than the comps imply.
- What's the recent tenant-quality profile in this submarket — average credit score on applications, eviction rate, late-payment / NSF rate, and stable-employment percentage? A property-management company in the area should have these aggregated.
- How much new for-sale + rental construction is in the pipeline within 1–3 miles? Heavy new supply typically softens prices + rents 12–24 months out; constrained supply supports both.
Investment metrics
- 1% rule
- 0.82% ✗
- Cap rate
- 5.62%
- Cash-on-cash
- -2.42%
- DSCR
- 0.89
- GRM
- 10.1
CMA / ARV
- ARV (median comp)
- $374,120
- List price
- $315,000
- Delta
- -15.80%
- Verdict
- UNDERPRICED
- Comps
- 20 within 1.0 mi
Show comp detail 6 sales within ~0.75 mi
| Address | Dist | Beds/Ba | Sqft | Sold | Price | $/sf | Match |
|---|---|---|---|---|---|---|---|
| 6 Roberts Rd | 0.70mi | 4/1.0 | 1,224 (-6%) | 1mo | $330,000 | $270 | 58 |
| 32 Melrose Rd | 0.58mi | 3/1.0 (-1) | 1,344 (+4%) | 7mo | $365,100 | $272 | 56 |
| 172 Weymouth Rd | 0.29mi | 3/2.0 (-1) | 1,464 (+13%) | 1mo | $400,000 | $273 | 56 |
| 50 Burnham St | 0.73mi | 4/1.0 | 1,296 (0%) | 21mo | $285,000 | $220 | 49 |
| 194 Post Office Rd | 0.59mi | 3/1.0 (-1) | 1,220 (-6%) | 18mo | $280,000 | $230 | 42 |
| 26 Guild St | 0.53mi | 3/1.5 (-1) | 1,401 (+8%) | 20mo | $321,000 | $229 | 38 |
Match score weights: distance 35% · size 25% · config 20% · recency 20%. Top-matched comps best support the ARV.
Projected returns pro-forma
-3.0% appreciation · 3.9% rent growth · sell at horizon
- IRR
- -19.3%
- Equity multiple
- 0.32×
- Total profit
- $-59,937
- Equity at exit
- $46,968
- IRR
- -10.1%
- Equity multiple
- 0.36×
- Total profit
- $-56,607
- Equity at exit
- $27,235
Cash invested: $88,200 (down + closing). Projections, not guarantees.
Landlord ↔ Tenant lean methodology
- Overall (STATE)
- 27 Tenant-Leaning
- State Connecticut
- 27 Tenant-Leaning · D+7
- County
- — inherits STATE
- City
- — inherits STATE
ZIP-level market 06082
- Rents YoY
- 3.9%
- Active inventory
- 188
- Price-to-rent
- 10.1×
Monthly cashflow live
- Estimated rent
- $2,591 medium interval (Pro) →
- Mortgage (P&I)
- −$1,652
- Tax from tax record
- −$442 /mo · $5,304/yr
- Insurance
- −$131
- HOA
- −$0
- Vacancy / Maint / Mgmt
- −$544
- Net cashflow
- $-178
Break-even live
Sensitivity live
| Price | -10% $0 | -5% $-89 | +0% $-178 | +5% $-267 | +10% $-356 |
|---|---|---|---|---|---|
| Rent | -10% $-383 | -5% $-280 | +0% $-178 | +5% $-76 | +10% $27 |
| Rate | -1.0pp $-19 | -0.5pp $-98 | base $-178 | +0.5pp $-260 | +1.0pp $-343 |
UW: 25.0% down · 7.5% · 30yr · 1.5% tax · 5.0% vac · 8.0% maint · 8.0% mgmt
Financing live
Cash to close
- Down payment
- $78,750
- Closing costs
- $9,450
- Reserves months
- —
- Total cash needed
- —
Loan-product check · same deal, 3 products live
Conventional
25% down · 7.5% · 30yr
- Down + closing
- —
- Monthly P&I
- —
- Monthly cashflow
- —
- DSCR
- —
- Eligible?
- —
Personal DTI + credit; lowest rate.
DSCR
20% down · 8.5% · 30yr
- Down + closing
- —
- Monthly P&I
- —
- Monthly cashflow
- —
- DSCR
- —
- Eligible?
- —
No personal income docs; deal must DSCR.
Hard money
10% down · 12.0% · 12mo
- Down + closing
- —
- Monthly P&I
- —
- Monthly cashflow
- —
- DSCR
- —
- Eligible?
- —
Short-term bridge; refi at stabilization.
Rent comps 1 comps
| Address | Beds | Baths | Sqft | Rent | $/sqft | DOM | Units | Dist |
|---|---|---|---|---|---|---|---|---|
| 21 David St Enfield, CT | 3.0 | 1.0 | 1008 | $2,600 | $2.58 | 45d | 1 | 1.32mi |
Listing history 11 events
-
2026-06-22days on market $315,000 Active 50 DOM
-
2026-06-18days on market $315,000 Active 47 DOM
-
2026-06-17days on market $315,000 Active 46 DOM
-
2026-06-16days on market $315,000 Active 45 DOM
-
2026-06-15days on market $315,000 Active 44 DOM
-
2026-06-13statusdays on market $315,000 Active 42 DOM
-
2026-06-02statusdays on market $315,000 Under Contract 41 DOM
-
2026-06-01days on market $315,000 Active 40 DOM
-
2026-05-31days on market $315,000 Active 39 DOM
-
2026-05-07price $315,000 692-char remark
-
2026-04-22$325,000 Active 692-char remark
ⓘ Source: listings_history table (triggers on properties + properties_extension) + one-shot
backfill from property_details.listing_events for pre-trigger history.
Tax reassessment forecast CT · Partial reset (capped growth)
- Current annual tax
- $5,304 · $442/mo
- Projected year-2 tax
- $6,022 · $502/mo
- Expected delta
- +$718/yr (+$60/mo · 13.5%)
ⓘ Screening estimate from a state-policy table — verify with the county assessor before closing.
Climate risk First Street
- Flood 1/10 Low FEMA zone X (unshaded) · 0% chance over 30 yrs
- Wildfire 1/10 Low
- Heat 5/10 Major 7 d/yr ≥99°F today · 16 d/yr by 30 yrs out
- Wind 6/10 Major 27% chance of damaging wind over 30 yrs
- Air quality 3/10 Moderate 2 unhealthy d/yr today · 3 by 30 yrs out
Nearby sold comps map
Loading sold comps map…
Walkable amenities ~0.75 mi
Loading nearby amenities…
Taxation est. · year 1
- Rental income
- $31,098
- − Mortgage interest
- −$17,645
- − Property taxes
- −$5,304
- − Insurance
- −$1,575
- − Repairs & maintenance
- −$2,488
- − Management
- −$2,488
- − Depreciation
- −$9,164
- Taxable loss
- −$7,566
- Est. tax savings @ 24.0%
- +$1,816
- After-tax cash flow
- $-319/yr
For passive investors: Depreciation is non-cash, so a rental often shows a tax loss while cash-flowing — sheltering income. Rental losses are passive: they offset passive income freely, and up to $25,000/yr can offset ordinary (W-2) income if you actively participate and your MAGI is under $100k (phasing out to $0 by $150k); unused losses carry forward. On sale, claimed depreciation is recaptured at up to 25%, and gains may owe capital-gains tax (a 1031 exchange can defer both). Figures are a year-1 estimate at your 24.0% rate — not tax advice; consult a CPA.
Schools (NCES district)
- District
- Enfield School District
- NCES district ID
- 0901470
- Math proficiency
- 25% ▼ -14.00%
- Reading proficiency
- 41% ▼ -10.00%
- Median HH income
- $68,750
- Composite
- 30.42/100
- National rank
- #6238
- State rank
- #114 of 153 in CT
Livability — Southwood Acres
- Score
- 72/100
- State rank
- #83
- US rank
- #6054
Category grades
Schools grade is shown separately in the Schools card above.
Census & demographics
- Census place
- Southwood Acres, CT
- County
- Hartford County · 754,208 people
- Metro
- Hartford-East Hartford-Middletown, CT
- Population (ZIP)
- 41,090
- Household income
- $90,404
- Rent vs Own
- Severe rent burden
- 954.0
Population outlook (Capitol County) Hauer SSP2
- By 2040
- 1,063,519
Race, ethnicity, and origin ACS 2023
- Neighborhood character
- Predominantly White (76%)
- Race & ethnicity
- White 76% Hispanic / Latino 11% Two or more races 9% Black 5% Asian 2%
- Hispanic origin (detail)
- Mexican 1% Puerto Rican 7%
- Common ancestry
- Romanian 10% Lithuanian 9% Slovak 2%
- Foreign-born
- 6% · Canada, Jamaica
- Languages at home
- 89% English-only · Spanish 5% Other Indo-European 2% Russian/Polish/Slavic 1%
Political lean MEDSL · Capitol
- 2024 margin
- Strong D (+21.9) · D 60.1% · R 38.2% · Other 1.7%
- All cycles
- 2024: D+21.9
Not yet ingested
- Civics
- —
Market trends
- HPI YoY
- ▼ -494.72%
- Current HPI
- 192.4011
- Rent YoY
- ▲ 3.90%
- Metro
- Hartford-East Hartford-Middletown, CT
- State GDP YoY
- ▲ 1.06%
- F500 in state
- 38
Industry mix (Fortune 500 HQ in CT)
| Industry | F500 HQs | Revenue |
|---|---|---|
| Industrial Machinery | 4 | $38B |
|
||
| Insurance | 3 | $71B |
|
||
| Financial Services | 2 | $25B |
|
||
| Transportation / Logistics | 2 | $18B |
|
||
| Healthcare | 1 | $247B |
|
||
| Telecommunications | 1 | $55B |
|
||
Price history
-3.1% since first listed4 events — show timeline
- 2026-06-12 Relisted — Smart MLS
- 2026-06-02 Pending — Smart MLS
- 2026-05-07 Price Changed $315,000 Smart MLS
- 2026-04-22 Listed $325,000 Smart MLS
Property tax history
+2.3%/yrLatest (2025): $5,304 · +2.8% YoY. Source: county tax records.
Cash-flow waterfall
monthlySold comps — $/sqft
last 12 mo · ≤1 miLoading sold comps…