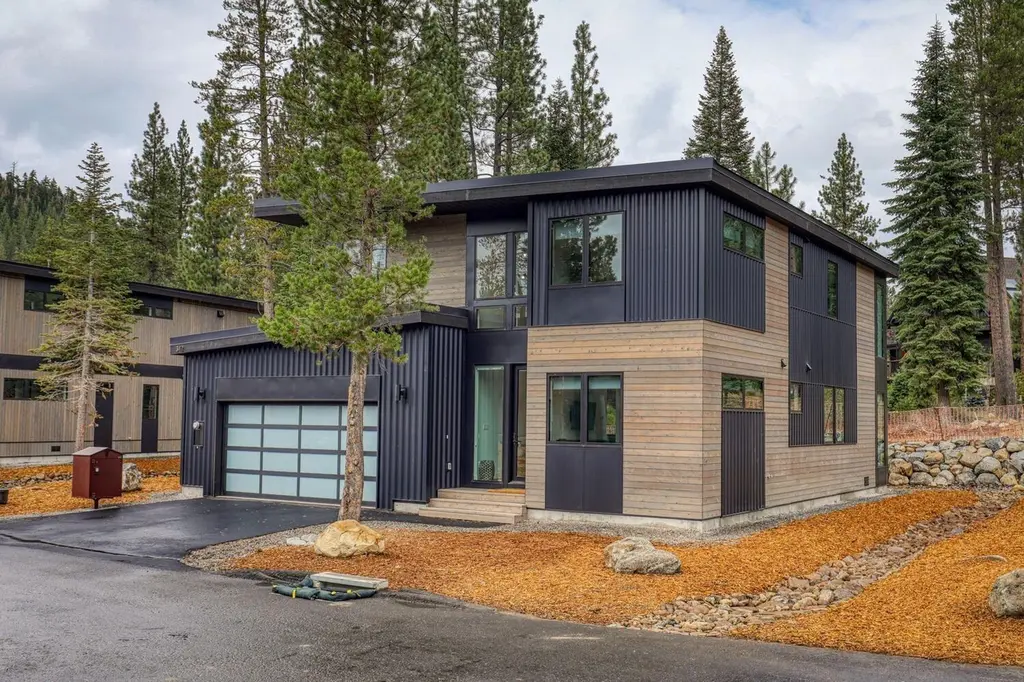
342 Palisades Cir · Sunnyside-Tahoe City, CA
Flood risk 3/10 · Minor
- FEMA flood zone
- X (unshaded)
- Chance of flooding over 30 yrs
- 0.2%
- Est. flood insurance / yr
- $507 – $1,088
Fire risk 6/10 · Moderate
- Est. fire insurance / yr
- $659 – $1,223
Heat risk 2/10 · Minimal
- Hot days now (above 82°F)
- 11 days/yr
- Hot days in 30 yrs
- 29 days/yr
Wind risk 1/10 · Minimal
- Chance of severe wind over 30 yrs
- —
Air-quality risk 7/10 · Major
- Unhealthy air days now
- 10 days/yr
- Unhealthy air days in 30 yrs
- 17 days/yr
Risk factors via First Street. Map © Google.
Why this score? — see what drove the C- grade
The composite is a weighted blend of 9 inputs, each scored 0–100. Each bar is that input's sub-score; the figure is the points it added to the 100-point composite (weight × sub-score).
- Cash flow +17.1/30.0
- ARV discount +7.5/15.0
- Appreciation +6.6/10.0
- DSCR +5.3/10.0
- 1% rule +4.6/10.0
- Schools +4.4/10.0
- Rent growth +2.5/5.0
- Livability +2.5/5.0
- Condition / age +2.5/5.0
$359,000
🖨 Deal sheet 📄 Offer letter ✓ Due diligence
Listing remarks MLS
New co-ownership opportunity: Own one-eighth of this professionally managed, turnkey home by Pacaso. Modern meets mountains in Jasper, conveniently located near the base of Palisades Tahoe Resort and just a short drive to Lake Tahoe. This home combines contemporary design with comfortable indoor and outdoor spaces. The great room features a gas fireplace and access to a covered wood deck with modern metal railings. The gourmet kitchen is equipped with custom wood cabinets, an island with waterfall edges, ample counter space, generous storage, a stainless steel gas range, and a wine fridge. The main floor includes laundry and powder rooms for convenience. Floating wood and metal stairs lead to a versatile sitting area and four bedrooms. The primary suite has access to a second covered deck and includes an en suite bathroom with a double-sink vanity, a soaking tub, and a tiled shower. The home comes fully furnished and thoughtfully designed.
Key facts
- Turnkey home
- Covered wood deck
- Gas fireplace
Tags
Property features AI
Finance
- HOA & community: Association amenities (see remarks); Community association present
Exterior
- Parking: Attached 2-car garage; Two covered parking spaces
- Utilities: Water from utility district; Sewer to utility district; Natural gas available
- Home design: Contemporary style; Two levels; Timeshare property; Like-new condition
- Construction: Frame construction
- Exterior features: Deck; Greenbelt lot setting; Hot tub
Interior
- Kitchen: Range; Oven; Microwave; Dishwasher; Refrigerator; Garbage disposal
- Flooring: Tile flooring; Wood flooring
- Bathrooms: Three full bathrooms; One half bathroom
- Heating & cooling: Natural gas heating available; Electric heating
- Interior features: Loft; Living room fireplace
- Laundry & utility: In-unit laundry room; Washer; Dryer
Neighborhood map
What this means for you Summary
Snapshot
- This is a 4-bed/3.5-bath single-family listed at $359k.
Deal economics
- At list price, monthly cash flow is $252 ($3k/yr) — positive.
- The deal already cash-flows at list — no discount required.
- To meet the 1% rule (rent ≥ 1% of price), the offer needs to be $346k (3.6% below list).
- Recommended offer: $346k (3.6% below list) — sets the bar for 1% rule.
- Cap rate 7.1% vs local median 0.1% in Sunnyside-Tahoe City — top-decile yield for the area; either an underpriced asset or a hidden risk that comps aren't pricing in. Stress-test before assuming the spread holds.
Location & tenants
- Location reads: area grade C — affects rentability + tenant quality, not the cash-flow math above.
- Tahoe-Truckee Unified (town): math 44% / reading 56% proficiency, ranked #136 of 517 in CA (top 26%) — acceptable for families but not a draw, mixed tenant base, ~2y average lease.
- Market conditions: 50 active listings in the ZIP; 3,535 units permitted in Placer County in 2024 (689 in 5+ unit buildings).
Forward outlook
- In year one you build about $14k of equity ($2k loan paydown + $12k appreciation (3.2% local appreciation)).
- Placer County population projected at +20% by 2050 — long-run rental-demand tailwind backs the buy-and-hold thesis.
- At projected returns (3.2% appreciation + 3.0% rent growth), your $101k cash investment doubles in ~6 years — after that, you're playing with house money.
- By year 3, paydown + projected appreciation supports a ~$35k cash-out refi (75% LTV) — recoverable capital for the next deal without selling this one.
Negotiation context
- It's been on market 15 days — a 2% lower offer ($354k) is reasonable based on typical stale-listing flexibility.
- 3 sale attempts since 2y ago with the ask held roughly flat each time — persistent listings suggest the price (not the market) is what's stuck; bring a comps-based counter.
Risks & watch-outs
- Climate carrying-cost: major wildfire risk — expect insurance premiums to compound above CPI over the hold.
Questions for the listing agent
- Is there a deadline driving the sale (1031 exchange, divorce, estate, relocation)? That informs how much negotiation room exists.
- What's the average days-on-market for RENTAL listings here right now (not sales)? A rising rental-DOM trend means longer vacancies and softer asking-rent achievability than the comps imply.
- What's the recent tenant-quality profile in this submarket — average credit score on applications, eviction rate, late-payment / NSF rate, and stable-employment percentage? A property-management company in the area should have these aggregated.
- How much new for-sale + rental construction is in the pipeline within 1–3 miles? Heavy new supply typically softens prices + rents 12–24 months out; constrained supply supports both.
Investment metrics
- 1% rule
- 0.96% ✗
- Cap rate
- 7.13%
- Cash-on-cash
- 3.00%
- DSCR
- 1.13
- GRM
- 8.6
CMA / ARV
- ARV (on-the-fly)
- $2,246,020
- Comps found
- 12
Show comp detail 12 sales within ~0.75 mi
| Address | Dist | Beds/Ba | Sqft | Sold | Price | $/sf | Match |
|---|---|---|---|---|---|---|---|
| 342 Palisades Cir Unit Share 2 | 0.00mi | 4/3.5 | 2,630 (0%) | 5mo | $320,000 | $122 | 96 |
| 211 Palisades Cir #2 | 0.15mi | 4/3.5 | 2,630 (0%) | 1mo | $265,000 | $101 | 92 |
| 342 Palisades Cir | 0.00mi | 4/3.5 | 2,630 (0%) | 12mo | $339,000 | $129 | 90 |
| 342 Palisades Cir #5 | 0.16mi | 4/3.5 | 2,630 (0%) | 8mo | $350,000 | $133 | 86 |
| 206 Shoshone Way | 0.22mi | 4/3.5 | 2,567 (-2%) | 7mo | $2,300,000 | $896 | 80 |
| 211 Palisades Cir | 0.15mi | 4/3.5 | 2,630 (0%) | 17mo | $269,000 | $102 | 79 |
| 389 Palisades Cir #43 | 0.09mi | 4/4.5 | 2,810 (+7%) | 10mo | $2,550,000 | $907 | 72 |
| 120 Smiley Cir | 0.13mi | 4/3.5 | 2,444 (-7%) | 14mo | $2,395,000 | $980 | 70 |
| 377 Palisades Cir | 0.07mi | 4/4.5 | 2,800 (+6%) | 20mo | $2,400,000 | $857 | 65 |
| 401 Palisades Cir | 0.13mi | 4/4.5 | 2,810 (+7%) | 19mo | $2,400,000 | $854 | 62 |
| 215 Smiley Ct | 0.16mi | 4/3.0 | 2,381 (-10%) | 19mo | $2,050,000 | $861 | 59 |
| 509 Forest Glen Rd | 0.57mi | 3/2.5 (-1) | 2,913 (+11%) | 17mo | $1,820,000 | $625 | 32 |
Match score weights: distance 35% · size 25% · config 20% · recency 20%. Top-matched comps best support the ARV.
Projected returns pro-forma
3.22% appreciation · 3.0% rent growth · sell at horizon
- IRR
- 10.9%
- Equity multiple
- 1.63×
- Total profit
- $63,486
- Equity at exit
- $165,845
- IRR
- 13.0%
- Equity multiple
- 2.98×
- Total profit
- $198,558
- Equity at exit
- $259,080
Cash invested: $100,520 (down + closing). Projections, not guarantees.
Landlord ↔ Tenant lean methodology
- Overall (STATE)
- 18 Strongly Tenant-Friendly
- State California
- 18 Strongly Tenant-Friendly · D+13
- County
- — inherits STATE
- City
- — inherits STATE
ZIP-level market 96146
- Home prices YoY
- 1.5%
- Active inventory
- 50
- Price-to-rent
- 8.6×
Monthly cashflow live
- Estimated rent
- $3,459 medium interval (Pro) →
- Mortgage (P&I)
- −$1,883
- Tax est. 1.5%
- −$449 /mo · $5,385/yr
- Insurance
- −$150
- HOA
- −$0
- Vacancy / Maint / Mgmt
- −$726
- Net cashflow
- $252
Break-even live
UW: 25.0% down · 7.5% · 30yr · 1.5% tax · 5.0% vac · 8.0% maint · 8.0% mgmt
Financing live
Cash to close
- Down payment
- $89,750
- Closing costs
- $10,770
- Reserves months
- —
- Total cash needed
- —
Loan-product check · same deal, 3 products live
Conventional
25% down · 7.5% · 30yr
- Down + closing
- —
- Monthly P&I
- —
- Monthly cashflow
- —
- DSCR
- —
- Eligible?
- —
Personal DTI + credit; lowest rate.
DSCR
20% down · 8.5% · 30yr
- Down + closing
- —
- Monthly P&I
- —
- Monthly cashflow
- —
- DSCR
- —
- Eligible?
- —
No personal income docs; deal must DSCR.
Hard money
10% down · 12.0% · 12mo
- Down + closing
- —
- Monthly P&I
- —
- Monthly cashflow
- —
- DSCR
- —
- Eligible?
- —
Short-term bridge; refi at stabilization.
Listing history 11 events
-
2026-06-18days on market $359,000 Active 15 DOM
-
2026-06-17days on market $359,000 Active 14 DOM
-
2026-06-16days on market $359,000 Active 13 DOM
-
2026-06-15days on market $359,000 Active 12 DOM
-
2026-06-14days on market $359,000 Active 10 DOM
-
2026-06-10days on market $359,000 Active 7 DOM
-
2026-06-09days on market $359,000 Active 6 DOM
-
2026-06-08days on market $359,000 Active 5 DOM
-
2026-06-07days on market $359,000 Active 4 DOM
-
2026-06-05remarks 681-char remark
-
2026-06-05$359,000 Active 1 DOM
ⓘ Source: listings_history table (triggers on properties + properties_extension) + one-shot
backfill from property_details.listing_events for pre-trigger history.
Climate risk First Street
- Flood 3/10 Moderate FEMA zone X (unshaded) · 20% chance over 30 yrs
- Wildfire 6/10 Major
- Heat 2/10 Low 11 d/yr ≥82°F today · 29 d/yr by 30 yrs out
- Wind 1/10 Low
- Air quality 7/10 Severe 10 unhealthy d/yr today · 17 by 30 yrs out
Nearby sold comps map
Loading sold comps map…
Walkable amenities ~0.75 mi
Loading nearby amenities…
Taxation est. · year 1
- Rental income
- $41,509
- − Mortgage interest
- −$20,110
- − Property taxes
- −$5,385
- − Insurance
- −$1,795
- − Repairs & maintenance
- −$3,321
- − Management
- −$3,321
- − Depreciation
- −$10,444
- Taxable loss
- −$2,866
- Est. tax savings @ 24.0%
- +$688
- After-tax cash flow
- $3,708/yr
For passive investors: Depreciation is non-cash, so a rental often shows a tax loss while cash-flowing — sheltering income. Rental losses are passive: they offset passive income freely, and up to $25,000/yr can offset ordinary (W-2) income if you actively participate and your MAGI is under $100k (phasing out to $0 by $150k); unused losses carry forward. On sale, claimed depreciation is recaptured at up to 25%, and gains may owe capital-gains tax (a 1031 exchange can defer both). Figures are a year-1 estimate at your 24.0% rate — not tax advice; consult a CPA.
Schools (NCES district)
- District
- Tahoe-Truckee Unified
- NCES district ID
- 0638770
- Math proficiency
- 44% ▼ -9.00%
- Reading proficiency
- 56% ▼ -4.00%
- Median HH income
- $67,136
- Composite
- 44.38/100
- National rank
- #2816
- State rank
- #136 of 517 in CA
Livability — Sunnyside-Tahoe City
No livability data for this city. (Only ~50 U.S. cities are tracked.)
Census & demographics
- Population (ZIP)
- 1,120
Population outlook (Placer County) Hauer SSP2
- Today (2025)
- 422,709 people
- By 2030
- 444,249 · +5.1%
- By 2040
- 480,192 · +13.6%
- By 2050
- 506,390 · +19.8%
- By 2075
- 550,219 · +30.2%
- By 2100
- 547,760 · +29.6%
Race, ethnicity, and origin ACS 2023
- Neighborhood character
- Predominantly White (87%)
- Race & ethnicity
- White 87% Hispanic / Latino 10% Two or more races 8%
- Hispanic origin (detail)
- Mexican 4% Puerto Rican 2%
- Common ancestry
- Lithuanian 8% Italian 5% Scandinavian 3%
- Foreign-born
- 7% · Canada
- Languages at home
- 89% English-only · French/Haitian/Cajun 4% Spanish 3% German/W. Germanic 2%
Political lean MEDSL · Placer
- 2024 margin
- Lean R (+8.5) · D 44.3% · R 52.8% · Other 2.9%
- 2008→2024 swing
- +2.8pp toward D · 2008: -11.3pp · 2024: -8.5pp
- All cycles
- 2024: R+8.5 2020: R+6.7 2016: R+11.3 2012: R+20.1 2008: R+11.3
Not yet ingested
- Civics
- —
Market trends
- HPI YoY
- ▲ 3.22%
- Current HPI
- 224.1632
- Rent YoY
- —
- Metro
- —
- State GDP YoY
- ▲ 3.21%
- F500 in state
- 116
Industry mix (Fortune 500 HQ in CA)
| Industry | F500 HQs | Revenue |
|---|---|---|
| Technology | 27 | $1,492B |
|
||
| Financial Services | 3 | $174B |
|
||
| Retail | 3 | $44B |
|
||
| Insurance | 3 | $26B |
|
||
| Media / Entertainment | 2 | $115B |
|
||
| Pharmaceuticals / Biotech | 2 | $62B |
|
||
Price history
-85.3% since first listed10 events — show timeline
- 2026-06-03 Listed $359,000 TSMLS
- 2025-06-27 Sold (MLS) $339,000 TSMLS
- 2025-06-23 Pending — TSMLS
- 2025-06-05 Listed $349,000 TSMLS
- 2025-03-21 Price Changed $349,000 TSMLS
- 2024-09-30 Pending — TSMLS
- 2024-09-30 Sold (MLS) $379,000 TSMLS
- 2024-06-14 Price Changed $379,000 TSMLS
- 2024-05-29 Listed $429,000 TSMLS
- 2022-06-29 Sold (Public Records) $2,450,000 Public Records
Property tax history
+47.1%/yrLatest (2025): $28,553 · +3.3% YoY. Source: county tax records.
Cash-flow waterfall
monthlySold comps — $/sqft
last 12 mo · ≤1 miLoading sold comps…