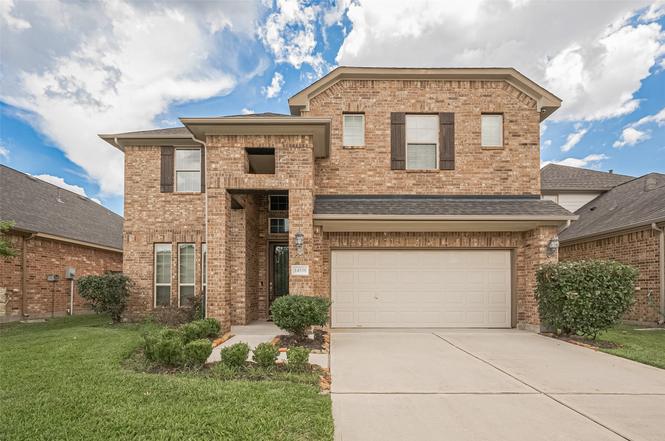
14538 Bending Maple Dr · Houston, TX
Flood risk 1/10 · Minimal
- FEMA flood zone
- X (unshaded)
- Chance of flooding over 30 yrs
- 0.0%
- Est. flood insurance / yr
- $507 – $1,088
Fire risk 1/10 · Minimal
- Est. fire insurance / yr
- $1,222 – $2,270
Heat risk 9/10 · Severe
- Hot days now (above 111°F)
- 7 days/yr
- Hot days in 30 yrs
- 24 days/yr
Wind risk 9/10 · Severe
- Chance of severe wind over 30 yrs
- 99.0%
Air-quality risk 3/10 · Minor
- Unhealthy air days now
- 3 days/yr
- Unhealthy air days in 30 yrs
- 3 days/yr
Risk factors via First Street. Map © Google.
Why this score? — see what drove the F grade
The composite is a weighted blend of 9 inputs, each scored 0–100. Each bar is that input's sub-score; the figure is the points it added to the 100-point composite (weight × sub-score).
- ARV discount +10.5/15.0
- Appreciation +4.5/10.0
- Cash flow +4.1/30.0
- Schools +4.1/10.0
- Livability +3.7/5.0
- Rent growth +3.4/5.0
- Condition / age +2.5/5.0
- 1% rule +1.4/10.0
- DSCR +0.0/10.0
$375,000
🖨 Deal sheet 📄 Offer letter ✓ Due diligence
Listing remarks MLS
LIBERTY BUILDERS - Beautiful open floorplan featuring 4 bedrooms, 2.5 baths with the master bedroom on the first floor. Open floorplan with high ceilings, open & airy kitchen with breakfast bar, three bedrooms and large gameroom upstairs. Low taxes
Key facts
- Formal dining room
- Upgraded flooring
- Covered patio
Tags
Neighborhood map
What this means for you Summary
Snapshot
- This is a 4-bed/2.5-bath single-family listed at $375k.
Deal economics
- At list price, monthly cash flow is $-1k ($-12k/yr) — negative.
- To cash-flow at today's rent, offer at most $193k (48.4% below list).
- To meet the 1% rule (rent ≥ 1% of price), the offer needs to be $239k (36.2% below list).
- Recommended offer: $193k (48.4% below list) — sets the bar for cash-flow.
Location & tenants
- Location reads 74/100 on livability (#184 in TX, #4,771 nationally) — a middle-class / working-renter tenant base. Strengths: amenities A+, cost of living A+, housing A+; Watch: crime F.
- Klein ISD (suburban): math 41% / reading 48% proficiency, ranked #213 of 826 in TX (top 26%) — families likely to look elsewhere, expect single-tenant / working-renter base with shorter leases.
- Zoned schools: Greenwood Forest El (math 30% / reading 34%, grade F, #2,268 of 4,322 statewide, top 55%, 672 students, 75% FRL); Wunderlich Int (math 24% / reading 34%, grade F, #1,103 of 1,662 statewide, top 67%, 1,316 students, 77% FRL); Klein H S (math 58% / reading 67%, grade B-, #234 of 1,632 statewide, top 14%, 3,352 students, 45% FRL) — zoned schools average 66% FRL vs 37% district-wide (28 pts higher); higher-poverty schools than district average — tighter screening recommended.
- Market conditions: Rents rising (+3.5%/yr); 187 active listings in the ZIP; 4 comparable units currently listed for rent nearby; rentals lingering (median 44d on market — plan ~5-8 weeks vacancy on turnover, expect pricing pressure); 50% of comp listings sitting > 30 days — soft ceiling on asking rent; solid renter incomes; 29,883 units permitted in Harris County in 2024 (8,621 in 5+ unit buildings).
- This rent runs 36% of the median local income ($80k/yr) — at the standard rent-burdened threshold; future hikes will face affordability resistance.
Forward outlook
- Local home prices are declining (-1.1%/yr); year-one equity from $3k of loan paydown is wiped out by about $4k of value loss. Plan a longer hold.
- Harris County population projected at +47% by 2050 — long-run rental-demand tailwind backs the buy-and-hold thesis.
Negotiation context
- It's been on market 155 days — a 12% lower offer ($330k) is reasonable based on typical stale-listing flexibility.
- 4 sale attempts since 8y ago; this cycle's ask has dropped $25k (6%) from the opening price — seller is motivated, your offer sets the floor, not the list.
Risks & watch-outs
- Climate carrying-cost: severe wind risk, 99% chance of damaging wind over 30y; extreme-heat days projected 7→24/yr by 2055 (HVAC capex compounding) — expect insurance premiums to compound above CPI over the hold.
Questions for the listing agent
- What do current leases actually rent for vs. the listed asking? Can we see a recent rent roll and the last 12 months of T-12 income?
- It's been on market 155 days. Have you received any prior offers? Is the seller open to a 48% concession, seller financing, or rate buy-down credit?
- What does the HOA fee cover, when was the last increase, and are there any pending special assessments or reserve-fund shortfalls?
- Why hasn't it sold? Are there any deal-killer items the seller is aware of (foundation, flood, title, zoning, code violations)?
- Is there a deadline driving the sale (1031 exchange, divorce, estate, relocation)? That informs how much negotiation room exists.
- Schools are D-rated, which usually means shorter tenancies and higher turnover. Who's the typical renter profile here, and what's been the actual vacancy rate?
- Crime grade is F in this area — have there been break-ins, vandalism, or insurance claims at this property in the last 3 years? What carrier currently insures it and at what premium?
- The area grade is low — what's the realistic commute time and amenity access for the typical tenant pool here? Any planned neighborhood developments (good or bad) we should know about?
- What's the average days-on-market for RENTAL listings here right now (not sales)? A rising rental-DOM trend means longer vacancies and softer asking-rent achievability than the comps imply.
- What's the recent tenant-quality profile in this submarket — average credit score on applications, eviction rate, late-payment / NSF rate, and stable-employment percentage? A property-management company in the area should have these aggregated.
- How much new for-sale + rental construction is in the pipeline within 1–3 miles? Heavy new supply typically softens prices + rents 12–24 months out; constrained supply supports both.
Investment metrics
- 1% rule
- 0.64% ✗
- Cap rate
- 3.00%
- Cash-on-cash
- -11.75%
- DSCR
- 0.48
- GRM
- 13.1
CMA / ARV
- ARV (on-the-fly)
- $401,660
- Comps found
- 12
Show comp detail 12 sales within ~0.75 mi
| Address | Dist | Beds/Ba | Sqft | Sold | Price | $/sf | Match |
|---|---|---|---|---|---|---|---|
| 14538 Bending Maple Dr | 0.00mi | 4/2.5 | 3,020 (0%) | 1mo | $375,000 | $124 | 99 |
| 186 Old Bridge Lk | 0.25mi | 4/3.0 | 3,108 (+3%) | 2mo | $399,000 | $128 | 80 |
| 4418 Windmill Run Dr | 0.35mi | 4/3.0 | 2,760 (-9%) | 0mo | $332,000 | $120 | 68 |
| 13607 Wendelyn Ln | 0.47mi | 4/3.5 | 2,885 (-4%) | 2mo | $385,000 | $133 | 65 |
| 5111 Olympia Fields Ln | 0.49mi | 4/3.0 | 2,801 (-7%) | 2mo | $373,500 | $133 | 62 |
| 5623 Bermuda Dunes Dr | 0.67mi | 4/2.5 | 2,828 (-6%) | 0mo | $420,000 | $149 | 58 |
| 5323 Olympia Fields Ln | 0.66mi | 4/2.5 | 2,806 (-7%) | 0mo | $399,999 | $143 | 57 |
| 105 Old Bridge Lk | 0.44mi | 3/2.5 (-1) | 2,622 (-13%) | 1mo | $269,900 | $103 | 52 |
| 13623 Charwell Crossing Ln | 0.70mi | 5/3.5 (+1) | 3,210 (+6%) | 0mo | $455,000 | $142 | 48 |
| 13603 Foxmoor Ln | 0.53mi | 5/3.5 (+1) | 3,350 (+11%) | 2mo | $420,000 | $125 | 46 |
| 5403 Coral Ridge Rd | 0.67mi | 4/3.5 | 3,362 (+11%) | 1mo | $470,000 | $140 | 45 |
| 14031 Court Of Regents | 0.72mi | 4/3.5 | 3,416 (+13%) | 2mo | $445,000 | $130 | 39 |
Match score weights: distance 35% · size 25% · config 20% · recency 20%. Top-matched comps best support the ARV.
Projected returns pro-forma
-1.09% appreciation · 3.55% rent growth · sell at horizon
- IRR
- -21.4%
- Equity multiple
- 0.11×
- Total profit
- $-93,719
- Equity at exit
- $88,827
- IRR
- -14.3%
- Equity multiple
- -0.24×
- Total profit
- $-130,503
- Equity at exit
- $91,840
Cash invested: $105,000 (down + closing). Projections, not guarantees.
Landlord ↔ Tenant lean methodology
- Overall (STATE)
- 87 Strongly Landlord-Friendly
- State Texas
- 87 Strongly Landlord-Friendly · R+5
- County
- — inherits STATE
- City
- — inherits STATE
ZIP-level market 77069
- Home prices YoY
- -0.5%
- Rents YoY
- 3.5%
- Active inventory
- 187
- Price-to-rent
- 13.1×
Monthly cashflow live
- Estimated rent
- $2,392 medium interval (Pro) →
- Mortgage (P&I)
- −$1,967
- Tax from tax record
- −$699 /mo · $8,384/yr
- Insurance
- −$156
- HOA
- −$96
- Vacancy / Maint / Mgmt
- −$502
- Net cashflow
- $-1,028
Break-even live
UW: 25.0% down · 7.5% · 30yr · 1.5% tax · 5.0% vac · 8.0% maint · 8.0% mgmt
Financing live
Cash to close
- Down payment
- $93,750
- Closing costs
- $11,250
- Reserves months
- —
- Total cash needed
- —
Loan-product check · same deal, 3 products live
Conventional
25% down · 7.5% · 30yr
- Down + closing
- —
- Monthly P&I
- —
- Monthly cashflow
- —
- DSCR
- —
- Eligible?
- —
Personal DTI + credit; lowest rate.
DSCR
20% down · 8.5% · 30yr
- Down + closing
- —
- Monthly P&I
- —
- Monthly cashflow
- —
- DSCR
- —
- Eligible?
- —
No personal income docs; deal must DSCR.
Hard money
10% down · 12.0% · 12mo
- Down + closing
- —
- Monthly P&I
- —
- Monthly cashflow
- —
- DSCR
- —
- Eligible?
- —
Short-term bridge; refi at stabilization.
Rent comps 4 comps
| Address | Beds | Baths | Sqft | Rent | $/sqft | DOM | Units | Dist |
|---|---|---|---|---|---|---|---|---|
| 4622 Falling Sun Dr Houston, TX | 4.0 | 3.0 | 2485 | $2,500 | $1.01 | 44d | 1 | 0.21mi |
| 4807 Wellington Way Houston, TX | 3.0 | 2.5 | 2876 | $2,500 | $0.87 | 44d | 1 | 0.28mi |
| 5135 Westerham Pl Unit 1262307P Houston, TX | 5.0 | 3.5 | 3358 | $17,582 | $5.24 | 22d | 1 | 0.40mi |
| 5415 Olympia Fields Ln Houston, TX | 4.0 | 4.0 | 4163 | $3,500 | $0.84 | 3d | 1 | 0.68mi |
HOA detail
- Monthly dues
- $96 · $1,152/yr
Listing history 22 events
-
2026-04-16status Pending
-
2026-04-10status Pending
-
2026-02-28price $375,000
-
2026-02-28status Active
-
2026-01-12status Pending
-
2026-01-12status Pending
-
2025-12-12status Pending
-
2025-12-04status Pending
-
2025-11-24price $360,000
-
2025-10-20price $375,000
-
2025-10-19price $410,000
-
2025-08-25$399,900 Active
-
2025-08-18historical
-
2025-07-24price $410,000
-
2025-07-06price $420,000
-
2025-06-27status Active
-
2025-06-25historical
-
2025-06-23historical
-
2018-08-13status Pending 254-char remark
Show marketing remark (254 chars)
LIBERTY BUILDERS - Beautiful open floorplan featuring 4 bedrooms, 2.5 baths with the master bedroom on the first floor. Open floorplan with high ceilings, open & airy kitchen with breakfast bar, three bedrooms and large gameroom upstairs. Low taxes
-
2018-07-23soldstatus Sold 254-char remark
Show marketing remark (254 chars)
LIBERTY BUILDERS - Beautiful open floorplan featuring 4 bedrooms, 2.5 baths with the master bedroom on the first floor. Open floorplan with high ceilings, open & airy kitchen with breakfast bar, three bedrooms and large gameroom upstairs. Low taxes
-
2018-06-06price $269,410 254-char remark
Show marketing remark (254 chars)
LIBERTY BUILDERS - Beautiful open floorplan featuring 4 bedrooms, 2.5 baths with the master bedroom on the first floor. Open floorplan with high ceilings, open & airy kitchen with breakfast bar, three bedrooms and large gameroom upstairs. Low taxes
-
2018-05-24$273,410 Active 254-char remark
Show marketing remark (254 chars)
LIBERTY BUILDERS - Beautiful open floorplan featuring 4 bedrooms, 2.5 baths with the master bedroom on the first floor. Open floorplan with high ceilings, open & airy kitchen with breakfast bar, three bedrooms and large gameroom upstairs. Low taxes
ⓘ Source: listings_history table (triggers on properties + properties_extension) + one-shot
backfill from property_details.listing_events for pre-trigger history.
Tax reassessment forecast TX · Resets to sale price
- Current annual tax
- $8,384 · $699/mo
- Projected year-2 tax
- $8,384 · $699/mo
- Expected delta
- $0/yr ($0/mo · 0.0%)
ⓘ Screening estimate from a state-policy table — verify with the county assessor before closing.
Climate risk First Street
- Flood 1/10 Low FEMA zone X (unshaded) · 0% chance over 30 yrs
- Wildfire 1/10 Low
- Heat 9/10 Extreme 7 d/yr ≥111°F today · 24 d/yr by 30 yrs out
- Wind 9/10 Extreme 99% chance of damaging wind over 30 yrs
- Air quality 3/10 Moderate 3 unhealthy d/yr today · 3 by 30 yrs out
Nearby sold comps map
Loading sold comps map…
Walkable amenities ~0.75 mi
Loading nearby amenities…
Taxation est. · year 1
- Rental income
- $28,704
- − Mortgage interest
- −$21,006
- − Property taxes
- −$8,384
- − Insurance
- −$1,875
- − Repairs & maintenance
- −$2,296
- − Management
- −$2,296
- − HOA
- −$1,152
- − Depreciation
- −$10,909
- Taxable loss
- −$19,214
- Est. tax savings @ 24.0%
- +$4,611
- After-tax cash flow
- $-7,722/yr
For passive investors: Depreciation is non-cash, so a rental often shows a tax loss while cash-flowing — sheltering income. Rental losses are passive: they offset passive income freely, and up to $25,000/yr can offset ordinary (W-2) income if you actively participate and your MAGI is under $100k (phasing out to $0 by $150k); unused losses carry forward. On sale, claimed depreciation is recaptured at up to 25%, and gains may owe capital-gains tax (a 1031 exchange can defer both). Figures are a year-1 estimate at your 24.0% rate — not tax advice; consult a CPA.
Schools (NCES district)
- District
- Klein ISD
- NCES district ID
- 4825740
- Math proficiency
- 41% ▼ -12.00%
- Reading proficiency
- 48% ▼ -3.00%
- Median HH income
- $78,288
- Composite
- 40.91/100
- National rank
- #3615
- State rank
- #213 of 826 in TX
Livability — Houston
- Score
- 74/100
- State rank
- #184
- US rank
- #4771
Category grades
Schools grade is shown separately in the Schools card above.
Census & demographics
- Census place
- Houston, TX
- County
- Harris County · 4,702,590 people
- City population
- 3,226,434
- Metro
- Houston-The Woodlands-Sugar Land, TX
- Population (ZIP)
- 20,608
- Household income
- $80,257
- Rent vs Own
- Severe rent burden
- 1259.0
Population outlook (Harris County) Hauer SSP2
- Today (2025)
- 5,571,493 people
- By 2030
- 6,089,821 · +9.3%
- By 2040
- 7,142,806 · +28.2%
- By 2050
- 8,185,864 · +46.9%
- By 2075
- 10,574,329 · +89.8%
- By 2100
- 12,109,958 · +117.4%
Race, ethnicity, and origin ACS 2023
- Neighborhood character
- Diverse neighborhood (Simpson 0.69)
- Race & ethnicity
- White 43% Black 30% Hispanic / Latino 19% Two or more races 12% Asian 5%
- Hispanic origin (detail)
- Mexican 11% Puerto Rican 2% Salvadoran 2%
- Common ancestry
- Slovak 2% Lithuanian 2% Italian 2%
- Foreign-born
- 12% · Canada, Vietnam, Jamaica
- Languages at home
- 79% English-only · Spanish 14% Other Indo-European 2% German/W. Germanic 1%
Political lean MEDSL · Harris
- 2024 margin
- Lean D (+5.5) · D 52.0% · R 46.4% · Other 1.6%
- 2008→2024 swing
- +3.9pp toward D · 2008: 1.6pp · 2024: 5.5pp
- All cycles
- 2024: D+5.5 2020: D+13.3 2016: D+12.4 2012: D+0.1 2008: D+1.6
Not yet ingested
- Civics
- —
Market trends
- HPI YoY
- ▼ -1.09%
- Current HPI
- 201.0894
- Rent YoY
- ▲ 3.55%
- Metro
- Houston-The Woodlands-Sugar Land, TX
- State GDP YoY
- ▲ 3.95%
- F500 in state
- 110
Industry mix (Fortune 500 HQ in TX)
| Industry | F500 HQs | Revenue |
|---|---|---|
| Energy | 16 | $1,198B |
|
||
| Technology | 5 | $198B |
|
||
| Engineering / Construction | 4 | $72B |
|
||
| Energy Services | 3 | $60B |
|
||
| Utilities | 3 | $41B |
|
||
| Healthcare | 2 | $330B |
|
||
Price history
+37.2% since first listed22 events — show timeline
- 2026-04-16 Pending — HARMLS
- 2026-04-10 Pending — HARMLS
- 2026-02-28 Price Changed $375,000 HARMLS
- 2026-02-28 Relisted — HARMLS
- 2026-01-12 Pending — HARMLS
- 2026-01-12 Pending — HARMLS
- 2025-12-12 Pending — HARMLS
- 2025-12-04 Pending — HARMLS
- 2025-11-24 Price Changed $360,000 HARMLS
- 2025-10-20 Price Changed $375,000 HARMLS
- 2025-10-19 Price Changed $410,000 HARMLS
- 2025-08-25 Listed $399,900 HARMLS
- 2025-08-18 Listing Removed — HARMLS
- 2025-07-24 Price Changed $410,000 HARMLS
- 2025-07-06 Price Changed $420,000 HARMLS
- 2025-06-27 Relisted — HARMLS
- 2025-06-25 Listing Removed — HARMLS
- 2025-06-23 Coming Soon — HARMLS
- 2018-08-13 Pending — HARMLS
- 2018-07-23 Sold (MLS) — HARMLS
- 2018-06-06 Price Changed $269,410 HARMLS
- 2018-05-24 Listed $273,410 HARMLS
Property tax history
+28.1%/yrLatest (2025): $8,384 · +7.9% YoY. Source: county tax records.
Cash-flow waterfall
monthlySold comps — $/sqft
last 12 mo · ≤1 miLoading sold comps…