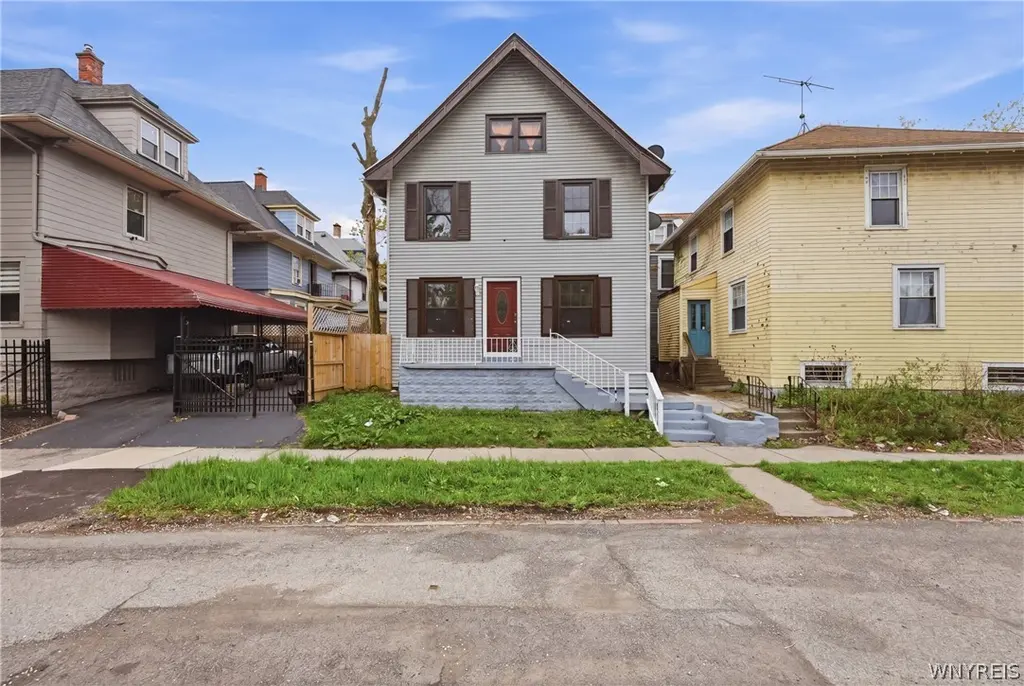
957 W Delavan Ave Unit S · Buffalo, NY
Flood risk 1/10 · Minimal
- FEMA flood zone
- X (unshaded)
- Chance of flooding over 30 yrs
- 0.0%
- Est. flood insurance / yr
- $473 – $860
Fire risk 1/10 · Minimal
- Est. fire insurance / yr
- $691 – $1,283
Heat risk 2/10 · Minimal
- Hot days now (above 91°F)
- 7 days/yr
- Hot days in 30 yrs
- 14 days/yr
Wind risk 1/10 · Minimal
- Chance of severe wind over 30 yrs
- —
Air-quality risk 4/10 · Minor
- Unhealthy air days now
- 4 days/yr
- Unhealthy air days in 30 yrs
- 9 days/yr
Risk factors via First Street. Map © Google.
Why this score? — see what drove the C grade
The composite is a weighted blend of 9 inputs, each scored 0–100. Each bar is that input's sub-score; the figure is the points it added to the 100-point composite (weight × sub-score).
- Cash flow +15.7/30.0
- ARV discount +15.0/15.0
- Appreciation +5.9/10.0
- DSCR +4.8/10.0
- Rent growth +4.6/5.0
- Livability +3.9/5.0
- Schools +3.3/10.0
- 1% rule +3.1/10.0
- Condition / age +2.5/5.0
$229,999
🖨 Deal sheet 📄 Offer letter ✓ Due diligence
Listing remarks
Welcome to 957 W Delavan. Located in a desirable Buffalo neighborhood near many local amenities, restaurants, and shopping, this fully remodeled 4-bedroom, 2 full bathroom home offers modern updates throughout. Features include new luxury vinyl flooring, remodeled kitchen and bathrooms, new lighting fixtures, and new windows. Stainless steel appliances are included. Additional updates include a new electrical panel. Full basement provides additional storage or potential usable space. Low taxes. Showings begin immediately.
Key facts
- Remodeled kitchen
- Remodeled bathrooms
- New windows
Tags
Property features AI
Exterior
- Parking: No garage; No driveway
- Utilities: Electricity connected (circuit breakers); Public water connected; Sewer connected; High-speed internet available
- Home design: 2-story home; Existing/resale property
- Construction: Vinyl siding; Asphalt roof; Poured foundation; Copper and PEX plumbing
- Exterior features: Rectangular residential lot; City street frontage; Lot dimensions approximately 35 x 41
Interior
- Kitchen: Gas oven; Gas range; Microwave; Refrigerator; Granite counters
- Bedrooms: Total rooms: 9 (includes bedrooms and living spaces)
- Flooring: Luxury vinyl
- Bathrooms: 2 full bathrooms; 1 main-level bathroom
- Heating & cooling: Gas forced-air heating
- Interior features: Separate formal living room; Separate formal dining room; Granite counters; Luxury vinyl flooring; Full basement
- Laundry & utility: Laundry in basement; Gas water heater
Neighborhood map
What this means for you Summary
Snapshot
- This is a 3-bed/1.0-bath single-family listed at $230k.
Deal economics
- At list price, monthly cash flow is $99 ($1k/yr) — positive.
- The deal already cash-flows at list — no discount required.
- To meet the 1% rule (rent ≥ 1% of price), the offer needs to be $186k (19.3% below list).
- Recommended offer: $186k (19.3% below list) — sets the bar for 1% rule.
Location & tenants
- Location reads 77/100 on livability (#195 in NY, #3,011 nationally) — a middle-class / working-renter tenant base. Strengths: commute A+, housing A+, health & safety A+; Watch: crime F, employment D-.
- Buffalo City School District (urban): math 41% / reading 40% proficiency, ranked #535 of 590 in NY (top 91%) — families likely to look elsewhere, expect single-tenant / working-renter base with shorter leases; 75% free/reduced lunch — lower-income household profile, screen leases tightly.
- Market conditions: Rents rising fast (+8.5%/yr); 56 active listings in the ZIP; 40 comparable units currently listed for rent nearby; rentals at typical pace (median 24d on market — plan ~3-4 weeks tenant-placement turnaround); 42% of comp listings sitting > 30 days — soft ceiling on asking rent; 1,244 units permitted in Erie County in 2024 (563 in 5+ unit buildings).
- This rent runs 44% of the median local income ($50k/yr) — at the standard rent-burdened threshold; future hikes will face affordability resistance.
Forward outlook
- In year one you build about $6k of equity ($2k loan paydown + $4k appreciation (1.9% local appreciation)).
- At projected returns (1.9% appreciation + 8.0% rent growth), your $64k cash investment doubles in ~6 years — after that, you're playing with house money.
- By year 6, paydown + projected appreciation supports a ~$32k cash-out refi (75% LTV) — recoverable capital for the next deal without selling this one.
Negotiation context
- It's been on market 36 days — a 3% lower offer ($223k) is reasonable based on typical stale-listing flexibility.
- Current owner paid $80k; list at $230k implies a 187% gain — meaningful room to come down on a strong offer.
Risks & watch-outs
- Watch-outs: built in 1900 — expect roof / HVAC / electrical / plumbing capex.
Questions for the listing agent
- It's been on market 36 days. Have you received any prior offers? Is the seller open to a 19% concession, seller financing, or rate buy-down credit?
- Built in 1900 — when were the roof, HVAC, electrical panel, plumbing, and water heater last replaced?
- Is there a deadline driving the sale (1031 exchange, divorce, estate, relocation)? That informs how much negotiation room exists.
- Crime grade is F in this area — have there been break-ins, vandalism, or insurance claims at this property in the last 3 years? What carrier currently insures it and at what premium?
- What's the average days-on-market for RENTAL listings here right now (not sales)? A rising rental-DOM trend means longer vacancies and softer asking-rent achievability than the comps imply.
- What's the recent tenant-quality profile in this submarket — average credit score on applications, eviction rate, late-payment / NSF rate, and stable-employment percentage? A property-management company in the area should have these aggregated.
- How much new for-sale + rental construction is in the pipeline within 1–3 miles? Heavy new supply typically softens prices + rents 12–24 months out; constrained supply supports both.
Investment metrics
- 1% rule
- 0.81% ✗
- Cap rate
- 6.81%
- Cash-on-cash
- 1.85%
- DSCR
- 1.08
- GRM
- 10.3
CMA / ARV
- ARV (median comp)
- $275,684
- List price
- $229,999
- Delta
- -16.57%
- Verdict
- UNDERPRICED
- Comps
- 20 within 1.0 mi
Show comp detail 12 sales within ~0.75 mi
| Address | Dist | Beds/Ba | Sqft | Sold | Price | $/sf | Match |
|---|---|---|---|---|---|---|---|
| 187 Chester St | 0.41mi | 3/1.5 | 1,456 (+4%) | 1mo | $99,000 | $68 | 72 |
| 146 Waverly St | 0.47mi | 3/1.5 | 1,456 (+4%) | 8mo | $250,000 | $172 | 63 |
| 170 Oxford Ave | 0.15mi | 3/1.5 | 1,538 (+10%) | 17mo | $316,000 | $205 | 60 |
| 71 Chester St | 0.59mi | 3/1.5 | 1,300 (-7%) | 2mo | $250,000 | $192 | 57 |
| 770 W Ferry St, #35 | 0.59mi | 3/2.5 | 1,330 (-5%) | 2mo | $479,000 | $360 | 56 |
| 273 Purdy St | 0.47mi | 4/2.0 (+1) | 1,520 (+9%) | 6mo | $90,000 | $59 | 50 |
| 188 Waverly St | 0.42mi | 3/1.5 | 1,541 (+10%) | 15mo | $264,000 | $171 | 50 |
| 78 Rumsey Rd | 0.60mi | 2/2.0 (-1) | 1,563 (+12%) | 4mo | $725,000 | $464 | 40 |
| 131 Woodlawn Ave | 0.61mi | 3/2.0 | 1,514 (+8%) | 21mo | $240,000 | $159 | 37 |
| 654 Auburn Ave | 0.69mi | 3/1.0 | 1,592 (+14%) | 18mo | $285,000 | $179 | 30 |
| 119 Purdy St | 0.69mi | 4/2.0 (+1) | 1,269 (-9%) | 18mo | $150,000 | $118 | 28 |
| 86 Verplanck St | 0.70mi | 4/1.5 (+1) | 1,258 (-10%) | 22mo | $115,000 | $91 | 25 |
Match score weights: distance 35% · size 25% · config 20% · recency 20%. Top-matched comps best support the ARV.
Projected returns pro-forma
1.86% appreciation · 8.0% rent growth · sell at horizon
- IRR
- 8.5%
- Equity multiple
- 1.47×
- Total profit
- $30,188
- Equity at exit
- $89,012
- IRR
- 14.3%
- Equity multiple
- 3.09×
- Total profit
- $134,410
- Equity at exit
- $126,882
Cash invested: $64,400 (down + closing). Projections, not guarantees.
Landlord ↔ Tenant lean methodology
- Overall (STATE)
- 15 Strongly Tenant-Friendly
- State New York
- 15 Strongly Tenant-Friendly · D+10
- County
- — inherits STATE
- City
- — inherits STATE
ZIP-level market 14209
- Home prices YoY
- 0.4%
- Rents YoY
- 8.5%
- Active inventory
- 56
- Price-to-rent
- 10.3×
Monthly cashflow live
- Estimated rent
- $1,856 high interval (Pro) →
- Mortgage (P&I)
- −$1,206
- Tax from tax record
- −$65 /mo · $776/yr
- Insurance
- −$96
- HOA
- −$0
- Vacancy / Maint / Mgmt
- −$390
- Net cashflow
- $99
Break-even live
UW: 25.0% down · 7.5% · 30yr · 1.5% tax · 5.0% vac · 8.0% maint · 8.0% mgmt
Financing live
Cash to close
- Down payment
- $57,500
- Closing costs
- $6,900
- Reserves months
- —
- Total cash needed
- —
Loan-product check · same deal, 3 products live
Conventional
25% down · 7.5% · 30yr
- Down + closing
- —
- Monthly P&I
- —
- Monthly cashflow
- —
- DSCR
- —
- Eligible?
- —
Personal DTI + credit; lowest rate.
DSCR
20% down · 8.5% · 30yr
- Down + closing
- —
- Monthly P&I
- —
- Monthly cashflow
- —
- DSCR
- —
- Eligible?
- —
No personal income docs; deal must DSCR.
Hard money
10% down · 12.0% · 12mo
- Down + closing
- —
- Monthly P&I
- —
- Monthly cashflow
- —
- DSCR
- —
- Eligible?
- —
Short-term bridge; refi at stabilization.
Rent comps 40 comps
| Address | Beds | Baths | Sqft | Rent | $/sqft | DOM | Units | Dist |
|---|---|---|---|---|---|---|---|---|
| 238 Oxford Ave Unit Upper Buffalo, NY | 3.0 | 1.0 | 1100 | $1,600 | $1.45 | 23d | 1 | 0.05mi |
| 1786 Main St Unit 103 Buffalo, NY | 2.0 | 1.5 | 1110 | $1,677 | $1.51 | 43d | 1 | 0.21mi |
| 1786 Main St Unit 104 Buffalo, NY | 2.0 | 2.0 | 1256 | $1,875 | $1.49 | 43d | 1 | 0.21mi |
| 75 Inwood Pl Unit Lower Buffalo, NY | 2.0 | 1.0 | 1175 | $1,550 | $1.32 | 43d | 1 | 0.35mi |
| 1560 Delaware Ave Unit 1 Buffalo, NY | 3.0 | 1.0 | 1000 | $2,800 | $2.80 | 23d | 1 | 0.40mi |
| 102 Florida St Buffalo, NY | 3.0 | 1.0 | 1296 | $1,650 | $1.27 | 43d | 1 | 0.40mi |
| 825 Forest Ave Buffalo, NY | 3.0 | 1.0 | 1200 | $2,000 | $1.67 | 23d | 1 | 0.49mi |
| 825 Forest Ave Unit 1 Buffalo, NY | 3.0 | 1.0 | 1200 | $1,700 | $1.42 | 3d | 1 | 0.49mi |
| 76 Chester St Unit 1 Buffalo, NY | 3.0 | 1.0 | 1100 | $1,000 | $0.91 | 14d | 1 | 0.56mi |
| 685 Auburn Ave Unit 2 Buffalo, NY | 3.0 | 1.0 | 1200 | $1,750 | $1.46 | 14d | 1 | 0.67mi |
| 685 Auburn Ave Buffalo, NY | 2.0 | 1.0 | 1200 | $1,600 | $1.33 | 44d | 1 | 0.67mi |
| 2 Agassiz Cir Unit B Buffalo, NY | 2.0 | 1.0 | 983 | $2,050 | $2.09 | 23d | 1 | 0.67mi |
| 2 Agassiz Cir Unit A Buffalo, NY | 2.0 | 1.0 | 1076 | $2,150 | $2.00 | 23d | 1 | 0.67mi |
| 107 Humboldt Pkwy Unit A Buffalo, NY | 2.0 | 1.0 | 1172 | $1,995 | $1.70 | 43d | 1 | 0.68mi |
| 117 Humboldt Pkwy Unit A Buffalo, NY | 3.0 | 1.0 | 1105 | $2,300 | $2.08 | 43d | 1 | 0.68mi |
| 121 Humboldt Pkwy Unit B Buffalo, NY | 2.0 | 1.0 | 1265 | $1,750 | $1.38 | 43d | 1 | 0.68mi |
| 664 Auburn Ave Unit 2 Buffalo, NY | 2.0 | 1.0 | 900 | $2,200 | $2.44 | 43d | 1 | 0.69mi |
| 1015 Elmwood Ave Unit 3 Buffalo, NY | 2.0 | 2.0 | 1000 | $1,400 | $1.40 | 43d | 1 | 0.72mi |
| 117 Bidwell Pkwy Unit 3 Buffalo, NY | 2.0 | 1.0 | 1192 | $1,500 | $1.26 | 3d | 1 | 0.74mi |
| 88 W Utica St Unit 1 Buffalo, NY | 3.0 | 2.0 | 990 | $2,150 | $2.17 | 14d | 1 | 0.82mi |
| 88 W Utica St Unit 1 Buffalo, NY | 3.0 | 2.0 | 990 | $2,150 | $2.17 | 2d | 1 | 0.82mi |
| 104 Butler Ave Buffalo, NY | 3.0 | 1.0 | 1000 | $1,400 | $1.40 | 43d | 1 | 0.84mi |
| 179 Donaldson Rd Buffalo, NY | 3.0 | 1.0 | 1152 | $1,350 | $1.17 | 3d | 1 | 0.90mi |
| 569 Elmwood Ave Buffalo, NY | 2.0 | 1.0 | 1500 | $1,750 | $1.17 | 11d | 1 | 0.96mi |
| 891 Richmond Ave Buffalo, NY | 3.0 | 1.0 | 1176 | $1,800 | $1.53 | 43d | 1 | 0.98mi |
| 184 Butler Ave Unit 1545840P Buffalo, NY | 4.0 | 1.0 | 1496 | $3,226 | $2.16 | 14d | 1 | 0.98mi |
| 916 Delaware Ave Buffalo, NY | 2.0 | 1.0 | 750 | $1,625 | $2.17 | 3d | 9 | 0.99mi |
| 305 W Utica St Unit B302 Buffalo, NY | 2.0 | 2.0 | 1180 | $2,060 | $1.75 | 14d | 1 | 1.05mi |
| 888 Delaware Ave Buffalo, NY | 2.0 | 1.0–2.0 | 899 | $2,440 | $2.71 | 23d | 1 | 1.07mi |
| 37 Abbottsford Pl Buffalo, NY | 3.0 | 1.0 | 1130 | $1,650 | $1.46 | 43d | 1 | 1.08mi |
| 57 Abbottsford Pl Buffalo, NY | 2.0 | 1.0 | 1000 | $1,550 | $1.55 | 23d | 1 | 1.10mi |
| 451 Elmwood Ave Buffalo, NY | 2.0 | 1.0 | 1633 | $3,305 | $2.02 | 43d | 1 | 1.11mi |
| 478 Breckenridge St Buffalo, NY | 3.0 | 1.0 | 1100 | $1,575 | $1.43 | 43d | 1 | 1.11mi |
| 40 Putnam St Buffalo, NY | 4.0 | 1.0 | 1600 | $2,100 | $1.31 | 23d | 1 | 1.13mi |
| 374 Baynes St Buffalo, NY | 3.0 | 1.0 | 1126 | $1,550 | $1.38 | 43d | 1 | 1.15mi |
| 217 Norwood Ave Apt 1 Buffalo, NY | 2.0 | 1.0 | 1500 | $2,700 | $1.80 | 43d | 1 | 1.16mi |
| 130 Linwood Ave Buffalo, NY | 2.0 | 1.0 | 900 | $1,900 | $2.11 | 23d | 1 | 1.17mi |
| 1152 Main St Apt 3 Buffalo, NY | 3.0 | 1.0 | 1000 | $2,400 | $2.40 | 14d | 1 | 1.19mi |
| 340 Bird Ave #202 Buffalo, NY | 2.0 | 2.5 | 1505 | $2,950 | $1.96 | 10d | 1 | 1.21mi |
| 118 Ashland Ave Buffalo, NY | 3.0 | 1.0 | 1326 | $1,850 | $1.40 | 14d | 1 | 1.26mi |
Listing history 16 events
-
2026-06-18days on market $229,999 Active 36 DOM
-
2026-06-17days on market $229,999 Active 35 DOM
-
2026-06-16days on market $229,999 Active 34 DOM
-
2026-06-15days on market $229,999 Active 33 DOM
-
2026-06-13days on market $229,999 Active 31 DOM
-
2026-06-13days on market $229,999 Active 30 DOM
-
2026-06-10days on market $229,999 Active 28 DOM
-
2026-06-09days on market $229,999 Active 27 DOM
-
2026-06-08days on market $229,999 Active 26 DOM
-
2026-06-07pricedays on market $229,999 Active 25 DOM
-
2026-06-03days on market $244,900 Active 21 DOM
-
2026-06-02days on market $244,900 Active 20 DOM
-
2026-06-01days on market $244,900 Active 19 DOM
-
2026-05-31days on market $244,900 Active 18 DOM
-
2026-05-12$249,000 Active 527-char remark
-
2025-06-16soldstatus $80,000
ⓘ Source: listings_history table (triggers on properties + properties_extension) + one-shot
backfill from property_details.listing_events for pre-trigger history.
Tax reassessment forecast NY · Partial reset (capped growth)
- Current annual tax
- $776 · $65/mo
- Projected year-2 tax
- $2,332 · $194/mo
- Expected delta
- +$1,555/yr (+$130/mo · 200.4%)
ⓘ Screening estimate from a state-policy table — verify with the county assessor before closing.
Climate risk First Street
- Flood 1/10 Low FEMA zone X (unshaded) · 0% chance over 30 yrs
- Wildfire 1/10 Low
- Heat 2/10 Low 7 d/yr ≥91°F today · 14 d/yr by 30 yrs out
- Wind 1/10 Low
- Air quality 4/10 Moderate 4 unhealthy d/yr today · 9 by 30 yrs out
Nearby sold comps map
Loading sold comps map…
Walkable amenities ~0.75 mi
Loading nearby amenities…
Taxation est. · year 1
- Rental income
- $22,268
- − Mortgage interest
- −$12,884
- − Property taxes
- −$776
- − Insurance
- −$1,150
- − Repairs & maintenance
- −$1,781
- − Management
- −$1,781
- − Depreciation
- −$6,691
- Taxable loss
- −$2,796
- Est. tax savings @ 24.0%
- +$671
- After-tax cash flow
- $1,863/yr
For passive investors: Depreciation is non-cash, so a rental often shows a tax loss while cash-flowing — sheltering income. Rental losses are passive: they offset passive income freely, and up to $25,000/yr can offset ordinary (W-2) income if you actively participate and your MAGI is under $100k (phasing out to $0 by $150k); unused losses carry forward. On sale, claimed depreciation is recaptured at up to 25%, and gains may owe capital-gains tax (a 1031 exchange can defer both). Figures are a year-1 estimate at your 24.0% rate — not tax advice; consult a CPA.
Schools (NCES district)
- District
- Buffalo City School District
- NCES district ID
- 3605850
- Math proficiency
- 41% ▲ 11.00%
- Reading proficiency
- 40% ▲ 7.00%
- Median HH income
- $31,665
- Composite
- 33.17/100
- National rank
- #5544
- State rank
- #535 of 590 in NY
Livability — Buffalo
- Score
- 77/100
- State rank
- #195
- US rank
- #3011
Category grades
Schools grade is shown separately in the Schools card above.
Census & demographics
- Census place
- Buffalo, NY
- County
- Erie County · 714,559 people
- City population
- 440,021
- Metro
- Buffalo-Cheektowaga, NY
- Population (ZIP)
- 8,313
- Household income
- $50,046
- Rent vs Own
- Severe rent burden
- 959.0
Population outlook (Erie County) Hauer SSP2
- Today (2025)
- 933,037 people
- By 2030
- 935,181 · +0.2%
- By 2040
- 928,531 · -0.5%
- By 2050
- 905,725 · -2.9%
- By 2075
- 834,037 · -10.6%
- By 2100
- 708,033 · -24.1%
Race, ethnicity, and origin ACS 2023
- Neighborhood character
- Diverse neighborhood (Simpson 0.62)
- Race & ethnicity
- White 53% Black 30% Hispanic / Latino 11% Two or more races 5% Asian 3%
- Hispanic origin (detail)
- Puerto Rican 6% Dominican 1%
- Common ancestry
- Romanian 6% Lithuanian 2% Scotch-Irish 2%
- Foreign-born
- 9% · Canada, Dominican Republic, China
- Languages at home
- 88% English-only · Spanish 5% Other Indo-European 2% French/Haitian/Cajun 2%
Political lean MEDSL · Erie
- 2024 margin
- Lean D (+9.7) · D 54.8% · R 45.2%
- 2008→2024 swing
- -7.9pp toward R · 2008: 17.5pp · 2024: 9.7pp
- All cycles
- 2024: D+9.7 2020: D+14.7 2016: D+4.8 2012: D+15.6 2008: D+17.5
Not yet ingested
- Civics
- —
Market trends
- HPI YoY
- ▲ 1.86%
- Current HPI
- 443.9414
- Rent YoY
- ▲ 8.53%
- Metro
- Buffalo-Cheektowaga, NY
- State GDP YoY
- ▲ 2.60%
- F500 in state
- 92
Industry mix (Fortune 500 HQ in NY)
| Industry | F500 HQs | Revenue |
|---|---|---|
| Financial Services | 10 | $950B |
|
||
| Consumer Goods | 9 | $162B |
|
||
| Insurance | 4 | $225B |
|
||
| Telecommunications | 2 | $144B |
|
||
| Pharmaceuticals | 2 | $112B |
|
||
| Media / Entertainment | 2 | $69B |
|
||
Price history
+187.5% since first listed4 events — show timeline
- 2026-06-03 Price Changed $229,999 WNYREIS
- 2026-05-25 Price Changed $244,900 WNYREIS
- 2026-05-12 Listed $249,000 WNYREIS
- 2025-06-16 Sold (Public Records) $80,000 Public Records
Property tax history
+16.3%/yrLatest (2025): $776 · -38.7% YoY. Source: county tax records.
Cash-flow waterfall
monthlySold comps — $/sqft
last 12 mo · ≤1 miLoading sold comps…