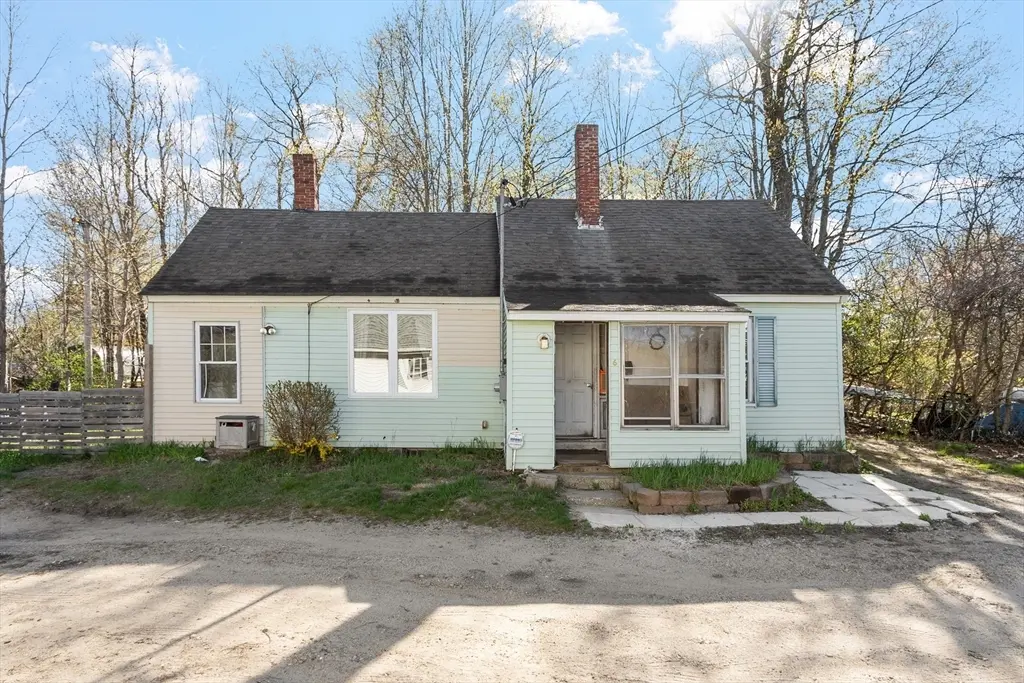
6 Kennedy Way · Gardner, MA
Flood risk 1/10 · Minimal
- FEMA flood zone
- —
- Chance of flooding over 30 yrs
- 0.0%
- Est. flood insurance / yr
- —
Fire risk 3/10 · Minor
- Est. fire insurance / yr
- $915 – $1,699
Heat risk 3/10 · Minor
- Hot days now (above 92°F)
- 7 days/yr
- Hot days in 30 yrs
- 17 days/yr
Wind risk 5/10 · Moderate
- Chance of severe wind over 30 yrs
- 25.0%
Air-quality risk 2/10 · Minimal
- Unhealthy air days now
- 1 days/yr
- Unhealthy air days in 30 yrs
- 1 days/yr
Risk factors via First Street. Map © Google.
Why this score? — see what drove the C- grade
The composite is a weighted blend of 9 inputs, each scored 0–100. Each bar is that input's sub-score; the figure is the points it added to the 100-point composite (weight × sub-score).
- ARV discount +15.0/15.0
- Cash flow +12.1/30.0
- Appreciation +8.7/10.0
- Livability +3.8/5.0
- DSCR +3.6/10.0
- 1% rule +2.8/10.0
- Rent growth +2.5/5.0
- Condition / age +2.5/5.0
- Schools +2.0/10.0
$240,000
🖨 Deal sheet (PDF) 📄 Offer letter ✓ Due diligence
Listing remarks
Great condo alternative!! This adorable home is not to be missed. Enjoy the peace in quiet in your own cozy home without an association fee. Sun filled rooms all on one floor. Walk in through the 3 season porch. Great space to enjoy your morning coffee. Good sized eat in kitchen, laundry room, nice living room and 2 bedrooms complete the charm of this home. The back yard offers additional peace and quiet with a cobble stone patio area. Plenty of space for gardening or sitting around a fire with friends. Schedule your showing today before it’s gone!!
Key facts
- Back yard
- Laundry room
- Eat in kitchen
Tags
Property features AI
Finance
- HOA & community: Community offers shopping, parks, walk/jog trails, highway access, houses of worship, and public schools; Not a senior community
Exterior
- Parking: Off-street parking; Shared driveway; 3 parking spaces (including 3 open parking spaces)
- Utilities: Public water; Public sewer; 220 volt electric; Electric water heater; Electric range/oven provisions
- Home design: Single family residence; Renovated since original construction
- Construction: Frame construction; Stone foundation; Shingle roof; Originally built (year from public records) and later renovated
- Exterior features: Porch; Public road frontage; Lot near lake/pond and within 1/2 to 1 mile of beach
Interior
- Kitchen: Hardwood flooring and picture window; Range; Dishwasher; Refrigerator
- Bedrooms: Primary bedroom on first floor with closet and wall-to-wall carpet; Second bedroom on first floor with closet, wood flooring, and attic access
- Flooring: Wood; Tile; Carpet
- Bathrooms: One full bathroom on first floor with tub and shower
- Heating & cooling: Electric baseboard heating; Window air conditioning units
- Interior features: 5 total rooms; Unfinished crawl space basement
- Laundry & utility: Washer/Dryer included; Washer hookup; Electric dryer hookup (220 volts); Dryer hookup supports dual dryer setup; Laundry area on first floor
Neighborhood map
What this means for you Summary
Snapshot
- This is a 2-bed/1.0-bath single-family listed at $240k.
Deal economics
- At list price, monthly cash flow is $-53 ($-641/yr) — negative.
- To cash-flow at today's rent, offer at most $231k (3.9% below list).
- To meet the 1% rule (rent ≥ 1% of price), the offer needs to be $187k (21.9% below list).
- Recommended offer: $187k (21.9% below list) — sets the bar for 1% rule.
- Cap rate 6.0% vs local median 3.6% in Gardner — top-decile yield for the area; either an underpriced asset or a hidden risk that comps aren't pricing in. Stress-test before assuming the spread holds.
Location & tenants
- Location reads 76/100 on livability (#61 in MA, #3,394 nationally) — a middle-class / working-renter tenant base. Strengths: housing A+, health & safety A+, commute A-; Watch: employment C-, schools D+, amenities F.
- Gardner (suburban): math 16% / reading 29% proficiency, ranked #284 of 302 in MA (top 94%) — low school quality limits family demand, transient renter base, plan for 1-2y turnover.
- Market conditions: 11 active listings in the ZIP; 17 comparable units currently listed for rent nearby; rentals at typical pace (median 16d on market — plan ~3-4 weeks tenant-placement turnaround); 2,293 units permitted in Worcester County in 2024 (1,205 in 5+ unit buildings).
Forward outlook
- In year one you build about $20k of equity ($2k loan paydown + $18k appreciation (7.5% local appreciation)).
- At projected returns (7.5% appreciation + 3.0% rent growth), your $67k cash investment doubles in ~4 years — after that, you're playing with house money.
- By year 2, paydown + projected appreciation supports a ~$31k cash-out refi (75% LTV) — recoverable capital for the next deal without selling this one.
Negotiation context
- It's been on market 53 days — a 3% lower offer ($233k) is reasonable based on typical stale-listing flexibility.
- Current owner paid $60k; list at $240k implies a 297% gain — meaningful room to come down on a strong offer.
Risks & watch-outs
- Watch-outs: built in 1800 — expect roof / HVAC / electrical / plumbing capex.
- Climate carrying-cost: moderate wind risk, 25% chance of damaging wind over 30y — expect insurance premiums to compound above CPI over the hold.
Questions for the listing agent
- What do current leases actually rent for vs. the listed asking? Can we see a recent rent roll and the last 12 months of T-12 income?
- It's been on market 53 days. Have you received any prior offers? Is the seller open to a 22% concession, seller financing, or rate buy-down credit?
- Built in 1800 — when were the roof, HVAC, electrical panel, plumbing, and water heater last replaced?
- Is there a deadline driving the sale (1031 exchange, divorce, estate, relocation)? That informs how much negotiation room exists.
- Schools are D-rated, which usually means shorter tenancies and higher turnover. Who's the typical renter profile here, and what's been the actual vacancy rate?
- What's the average days-on-market for RENTAL listings here right now (not sales)? A rising rental-DOM trend means longer vacancies and softer asking-rent achievability than the comps imply.
- What's the recent tenant-quality profile in this submarket — average credit score on applications, eviction rate, late-payment / NSF rate, and stable-employment percentage? A property-management company in the area should have these aggregated.
- How much new for-sale + rental construction is in the pipeline within 1–3 miles? Heavy new supply typically softens prices + rents 12–24 months out; constrained supply supports both.
Investment metrics
- 1% rule
- 0.78% ✗
- Cap rate
- 6.03%
- Cash-on-cash
- -0.95%
- DSCR
- 0.96
- GRM
- 10.7
CMA / ARV
- ARV (median comp)
- $310,738
- List price
- $240,000
- Delta
- -22.76%
- Verdict
- UNDERPRICED
- Comps
- 20 within 1.0 mi
Show comp detail 6 sales within ~0.75 mi
| Address | Dist | Beds/Ba | Sqft | Sold | Price | $/sf | Match |
|---|---|---|---|---|---|---|---|
| 4 Moran St | 0.28mi | 2/1.0 | 781 (+4%) | 7mo | $250,000 | $320 | 76 |
| 15 Winslow St | 0.36mi | 2/1.0 | 768 (+2%) | 12mo | $300,000 | $391 | 70 |
| 18 Pond St | 0.55mi | 2/1.0 | 768 (+2%) | 10mo | $274,000 | $357 | 63 |
| 133 Douglas Rd | 0.65mi | 2/1.0 | 720 (-4%) | 1mo | $309,000 | $429 | 62 |
| 101 Euclid St | 0.51mi | 1/1.0 (-1) | 748 (-1%) | 12mo | $275,000 | $368 | 60 |
| 264 Baker St | 0.57mi | 1/1.0 (-1) | 725 (-4%) | 21mo | $265,000 | $366 | 44 |
Match score weights: distance 35% · size 25% · config 20% · recency 20%. Top-matched comps best support the ARV.
Projected returns pro-forma
7.49% appreciation · 3.0% rent growth · sell at horizon
- IRR
- 18.1%
- Equity multiple
- 2.30×
- Total profit
- $87,601
- Equity at exit
- $174,023
- IRR
- 17.2%
- Equity multiple
- 4.82×
- Total profit
- $256,569
- Equity at exit
- $337,796
Cash invested: $67,200 (down + closing). Projections, not guarantees.
Landlord ↔ Tenant lean methodology
- Overall (STATE)
- 20 Strongly Tenant-Friendly
- State Massachusetts
- 20 Strongly Tenant-Friendly · D+15
- County
- — inherits STATE
- City
- — inherits STATE
ZIP-level market 01436
- Home prices YoY
- 2.8%
- Active inventory
- 11
- Price-to-rent
- 10.7×
Monthly cashflow live
- Estimated rent
- $1,873 high interval (Pro) →
- Mortgage (P&I)
- −$1,259
- Tax from tax record
- −$175 /mo · $2,097/yr
- Insurance
- −$100
- HOA
- −$0
- Vacancy / Maint / Mgmt
- −$393
- Net cashflow
- $-53
Break-even live
Sensitivity live
| Price | -10% $82 | -5% $14 | +0% $-53 | +5% $-121 | +10% $-189 |
|---|---|---|---|---|---|
| Rent | -10% $-201 | -5% $-127 | +0% $-53 | +5% $21 | +10% $95 |
| Rate | -1.0pp $67 | -0.5pp $8 | base $-53 | +0.5pp $-116 | +1.0pp $-179 |
UW: 25.0% down · 7.5% · 30yr · 1.5% tax · 5.0% vac · 8.0% maint · 8.0% mgmt
Financing live
Cash to close
- Down payment
- $60,000
- Closing costs
- $7,200
- Reserves months
- —
- Total cash needed
- —
Loan-product check · same deal, 3 products live
Conventional
25% down · 7.5% · 30yr
- Down + closing
- —
- Monthly P&I
- —
- Monthly cashflow
- —
- DSCR
- —
- Eligible?
- —
Personal DTI + credit; lowest rate.
DSCR
20% down · 8.5% · 30yr
- Down + closing
- —
- Monthly P&I
- —
- Monthly cashflow
- —
- DSCR
- —
- Eligible?
- —
No personal income docs; deal must DSCR.
Hard money
10% down · 12.0% · 12mo
- Down + closing
- —
- Monthly P&I
- —
- Monthly cashflow
- —
- DSCR
- —
- Eligible?
- —
Short-term bridge; refi at stabilization.
Rent comps 17 comps
| Address | Beds | Baths | Sqft | Rent | $/sqft | DOM | Units | Dist |
|---|---|---|---|---|---|---|---|---|
| 20 Graham St #4 Gardner, MA | 3.0 | 1.0 | 927 | $2,100 | $2.27 | 45d | 1 | 0.06mi |
| 120 Graham St Apt 3 Gardner, MA | 2.0 | 1.0 | 1100 | $2,000 | $1.82 | 15d | 1 | 0.12mi |
| 13 Regan St Gardner, MA | 3.0 | 1.0 | 1000 | $2,150 | $2.15 | 15d | 1 | 0.15mi |
| 118 Vernon St #4 Gardner, MA | 2.0 | 1.0 | 690 | $1,650 | $2.39 | 15d | 1 | 0.15mi |
| 183 Connors St Unit 1 Gardner, MA | 2.0 | 1.0 | 970 | $1,650 | $1.70 | 45d | 1 | 0.30mi |
| 22 Knowlton St Unit 6 Gardner, MA | 3.0 | 1.0 | 1055 | $1,900 | $1.80 | 45d | 1 | 0.31mi |
| 206 Connors St Unit 1 Gardner, MA | 3.0 | 1.0 | 900 | $1,900 | $2.11 | 45d | 1 | 0.33mi |
| 94 Maple St Unit 2 Gardner, MA | 2.0 | 1.0 | 800 | $1,800 | $2.25 | 15d | 1 | 0.38mi |
| 94 Maple St Unit 1A Gardner, MA | 2.0 | 1.0 | 800 | $1,800 | $2.25 | 45d | 1 | 0.38mi |
| 98 Maple St Unit 1 Gardner, MA | 2.0 | 1.5 | 1000 | $2,100 | $2.10 | 45d | 1 | 0.39mi |
| 139 Greenwood St Unit 2 Gardner, MA | 3.0 | 1.0 | 800 | $1,625 | $2.03 | 15d | 1 | 0.43mi |
| 16 Ford St Gardner, MA | 2.0 | 1.0 | 800 | $1,600 | $2.00 | 20d | 1 | 0.56mi |
| 16 Ford St Apt B Gardner, MA | 2.0 | 1.0 | 800 | $1,700 | $2.12 | 15d | 1 | 0.56mi |
| 16 Ford St Unit 2 Gardner, MA | 2.0 | 1.0 | 800 | $1,700 | $2.12 | 15d | 1 | 0.56mi |
| 315 Elm St Unit 3 Gardner, MA | 1.0 | 1.0 | 800 | $1,475 | $1.84 | 15d | 1 | 0.93mi |
| 90 Ridgewood Ln Gardner, MA | 1.0 | 1.0 | 553 | $1,575 | $2.85 | 15d | 1 | 1.16mi |
| 167 W Broadway Unit 1 Gardner, MA | 1.0 | 1.0 | 630 | $1,700 | $2.70 | 15d | 1 | 1.31mi |
Listing history 21 events
-
2026-06-21statusdays on market $240,000 Contingent 53 DOM
-
2026-06-18days on market $240,000 Active 50 DOM
-
2026-06-17days on market $240,000 Active 49 DOM
-
2026-06-16days on market $240,000 Active 48 DOM
-
2026-06-15statusdays on market $240,000 Active 47 DOM
-
2026-06-14days on market $240,000 Price Changed 45 DOM
-
2026-06-13pricestatusdays on market $240,000 Price Changed 44 DOM
-
2026-06-10days on market $250,000 Active 42 DOM
-
2026-06-09days on market $250,000 Active 41 DOM
-
2026-06-08days on market $250,000 Active 40 DOM
-
2026-06-07days on market $250,000 Active 39 DOM
-
2026-06-05days on market $250,000 Active 36 DOM
-
2026-06-03days on market $250,000 Active 35 DOM
-
2026-06-02days on market $250,000 Active 34 DOM
-
2026-06-01days on market $250,000 Active 33 DOM
-
2026-05-31days on market $250,000 Active 32 DOM
-
2026-05-31days on market $250,000 Active 31 DOM
-
2026-05-14price $250,000 561-char remark
-
2026-05-03price $265,000 561-char remark
-
2026-04-29$280,000 New 561-char remark
-
2002-07-16soldstatus $60,500
ⓘ Source: listings_history table (triggers on properties + properties_extension) + one-shot
backfill from property_details.listing_events for pre-trigger history.
Tax reassessment forecast MA · Partial reset (capped growth)
- Current annual tax
- $2,097 · $175/mo
- Projected year-2 tax
- $2,524 · $210/mo
- Expected delta
- +$428/yr (+$36/mo · 20.4%)
ⓘ Screening estimate from a state-policy table — verify with the county assessor before closing.
Climate risk First Street
- Flood 1/10 Low 0% chance over 30 yrs
- Wildfire 3/10 Moderate
- Heat 3/10 Moderate 7 d/yr ≥92°F today · 17 d/yr by 30 yrs out
- Wind 5/10 Major 25% chance of damaging wind over 30 yrs
- Air quality 2/10 Low 1 unhealthy d/yr today · 1 by 30 yrs out
Nearby sold comps map
Loading sold comps map…
Walkable amenities ~0.75 mi
Loading nearby amenities…
Taxation est. · year 1
- Rental income
- $22,479
- − Mortgage interest
- −$13,444
- − Property taxes
- −$2,097
- − Insurance
- −$1,200
- − Repairs & maintenance
- −$1,798
- − Management
- −$1,798
- − Depreciation
- −$6,982
- Taxable loss
- −$4,840
- Est. tax savings @ 24.0%
- +$1,162
- After-tax cash flow
- $520/yr
For passive investors: Depreciation is non-cash, so a rental often shows a tax loss while cash-flowing — sheltering income. Rental losses are passive: they offset passive income freely, and up to $25,000/yr can offset ordinary (W-2) income if you actively participate and your MAGI is under $100k (phasing out to $0 by $150k); unused losses carry forward. On sale, claimed depreciation is recaptured at up to 25%, and gains may owe capital-gains tax (a 1031 exchange can defer both). Figures are a year-1 estimate at your 24.0% rate — not tax advice; consult a CPA.
Schools (NCES district)
- District
- Gardner
- NCES district ID
- 2505130
- Math proficiency
- 16% ▼ -13.00%
- Reading proficiency
- 29% ▬ 0.00%
- Median HH income
- $47,019
- Composite
- 19.65/100
- National rank
- #8739
- State rank
- #284 of 302 in MA
Livability — Gardner
- Score
- 76/100
- State rank
- #61
- US rank
- #3394
Category grades
Schools grade is shown separately in the Schools card above.
Census & demographics
- Census place
- Gardner, MA
- City population
- 21,276
- Population (ZIP)
- 3,720
Population outlook (Worcester County) Hauer SSP2
- Today (2025)
- 850,858 people
- By 2030
- 860,403 · +1.1%
- By 2040
- 869,902 · +2.2%
- By 2050
- 869,110 · +2.1%
- By 2075
- 870,120 · +2.3%
- By 2100
- 829,703 · -2.5%
Race, ethnicity, and origin ACS 2023
- Neighborhood character
- Predominantly White (94%)
- Race & ethnicity
- White 94% Hispanic / Latino 4% Two or more races 2% Black 1%
- Common ancestry
- Romanian 12% Lithuanian 8% German 6%
- Foreign-born
- 1% · Canada
- Languages at home
- 98% English-only · Spanish 2%
Political lean MEDSL · Worcester
- 2024 margin
- D (+10.0) · D 53.9% · R 43.9% · Other 2.2%
- 2008→2024 swing
- -3.8pp toward R · 2008: 13.8pp · 2024: 10.0pp
- All cycles
- 2024: D+10.0 2020: D+17.8 2016: D+10.5 2012: D+9.2 2008: D+13.8
Not yet ingested
- Civics
- —
Market trends
- HPI YoY
- ▲ 7.49%
- Current HPI
- 272.0847
- Rent YoY
- —
- Metro
- —
- State GDP YoY
- ▲ 2.28%
- F500 in state
- 38
Industry mix (Fortune 500 HQ in MA)
| Industry | F500 HQs | Revenue |
|---|---|---|
| Technology | 3 | $17B |
|
||
| Insurance | 2 | $84B |
|
||
| Retail | 2 | $76B |
|
||
| Life Sciences | 1 | $43B |
|
||
| Energy Technology | 1 | $31B |
|
||
| Aerospace / Defense | 1 | $18B |
|
||
Price history
+296.7% since first listed5 events — show timeline
- 2026-06-11 Price Changed $240,000 MLS PIN
- 2026-05-14 Price Changed $250,000 MLS PIN
- 2026-05-03 Price Changed $265,000 MLS PIN
- 2026-04-29 Listed $280,000 MLS PIN
- 2002-07-16 Sold (Public Records) $60,500 Public Records
Property tax history
+4.5%/yrLatest (2023): $2,097 · +16.9% YoY. Source: county tax records.
Cash-flow waterfall
monthlySold comps — $/sqft
last 12 mo · ≤1 miLoading sold comps…