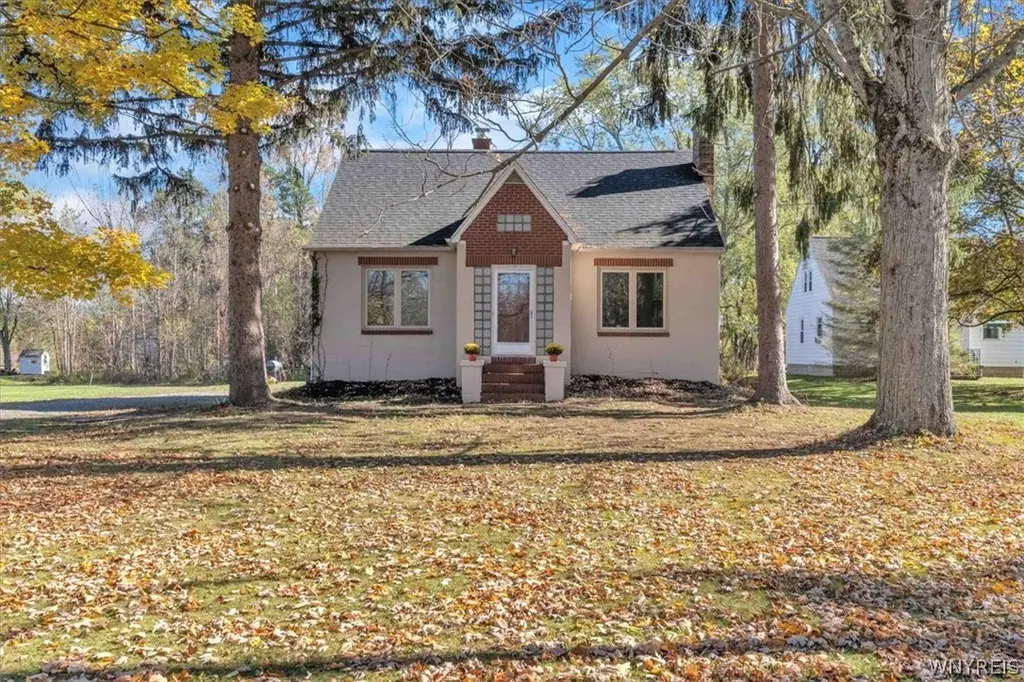
1220 Smith Rd · Harris Hill, NY
Flood risk 1/10 · Minimal
- FEMA flood zone
- X (unshaded)
- Chance of flooding over 30 yrs
- 0.0%
- Est. flood insurance / yr
- $473 – $860
Fire risk 2/10 · Minimal
- Est. fire insurance / yr
- $691 – $1,283
Heat risk 2/10 · Minimal
- Hot days now (above 94°F)
- 7 days/yr
- Hot days in 30 yrs
- 15 days/yr
Wind risk 1/10 · Minimal
- Chance of severe wind over 30 yrs
- —
Air-quality risk 2/10 · Minimal
- Unhealthy air days now
- 2 days/yr
- Unhealthy air days in 30 yrs
- 2 days/yr
Risk factors via First Street. Map © Google.
Why this score? — see what drove the C- grade
The composite is a weighted blend of 9 inputs, each scored 0–100. Each bar is that input's sub-score; the figure is the points it added to the 100-point composite (weight × sub-score).
- ARV discount +15.0/15.0
- Cash flow +12.3/30.0
- Schools +6.3/10.0
- 1% rule +4.1/10.0
- Rent growth +3.9/5.0
- DSCR +3.6/10.0
- Livability +3.6/5.0
- Condition / age +2.5/5.0
- Appreciation +0.0/10.0
$280,000
🖨 Deal sheet (PDF) 📄 Offer letter ✓ Due diligence
Listing remarks
1.6 Acres in East Amherst with Detached Garage & Updates Looking for space and privacy without giving up convenience? This East Amherst property sits on a deep 1.6-acre lot, perfect if you’ve been dreaming of a little country living just minutes from Transit Road, schools, and shopping. Inside, you’ll find a well-maintained 3-bedroom home with practical updates throughout, including central air. The kitchen was remodeled in 2015 with solid-surface countertops and modern finishes. A new tear-off roof was completed in 2019, and drainage work was professionally done in 2012 for peace of mind. Windows and doors have also been replaced, improving comfort and efficiency. The mai
Key facts
- New tear-off roof
- Remodeled kitchen
- Large backyard
Tags
Neighborhood map
What this means for you Summary
Snapshot
- This is a 3-bed/1.5-bath single-family listed at $280k.
Deal economics
- At list price, monthly cash flow is $-53 ($-630/yr) — negative.
- To cash-flow at today's rent, offer at most $271k (3.3% below list).
- To meet the 1% rule (rent ≥ 1% of price), the offer needs to be $255k (9.0% below list).
- Recommended offer: $255k (9.0% below list) — sets the bar for 1% rule.
- Cap rate 6.1% vs local median 2.7% in Harris Hill — top-decile yield for the area; either an underpriced asset or a hidden risk that comps aren't pricing in. Stress-test before assuming the spread holds.
Location & tenants
- Location reads 72/100 on livability (#345 in NY) — a middle-class / working-renter tenant base. Strengths: employment A+, housing A+, health & safety A-; Watch: amenities F, commute F, cost of living F.
- Williamsville Central School District (suburban): math 64% / reading 77% proficiency, ranked #114 of 590 in NY (top 19%) — strong family-tenant draw, lease renewals of 3-5y typical; only 10% free/reduced lunch — higher-income household profile.
- Market conditions: Rents rising fast (+5.6%/yr); 153 active listings in the ZIP; 6 comparable units currently listed for rent nearby; rentals leasing fast (median 4d on market — plan ~1-2 weeks tenant-placement turnaround); high-income renter base; 1,244 units permitted in Erie County in 2024 (563 in 5+ unit buildings).
Forward outlook
- Local home prices are declining (-3.0%/yr); year-one equity from $2k of loan paydown is wiped out by about $8k of value loss. Plan a longer hold.
Negotiation context
- Only 6 days on market — expect competitive offers; lowballing is unlikely to land.
- 2 sale attempts with the ask held roughly flat each time — persistent listings suggest the price (not the market) is what's stuck; bring a comps-based counter.
- Current owner paid $85k; list at $280k implies a 229% gain — meaningful room to come down on a strong offer.
Risks & watch-outs
- Watch-outs: built in 1952 — expect roof / HVAC / electrical / plumbing capex.
Questions for the listing agent
- What do current leases actually rent for vs. the listed asking? Can we see a recent rent roll and the last 12 months of T-12 income?
- Built in 1952 — when were the roof, HVAC, electrical panel, plumbing, and water heater last replaced?
- Is there a deadline driving the sale (1031 exchange, divorce, estate, relocation)? That informs how much negotiation room exists.
- Schools are B-rated — typically a magnet for longer-tenancy family renters. What's the average tenant stay here, and is there a school-zone premium baked into asking?
- What's the average days-on-market for RENTAL listings here right now (not sales)? A rising rental-DOM trend means longer vacancies and softer asking-rent achievability than the comps imply.
- What's the recent tenant-quality profile in this submarket — average credit score on applications, eviction rate, late-payment / NSF rate, and stable-employment percentage? A property-management company in the area should have these aggregated.
- How much new for-sale + rental construction is in the pipeline within 1–3 miles? Heavy new supply typically softens prices + rents 12–24 months out; constrained supply supports both.
Investment metrics
- 1% rule
- 0.91% ✗
- Cap rate
- 6.07%
- Cash-on-cash
- -0.80%
- DSCR
- 0.96
- GRM
- 9.2
CMA / ARV
- ARV (on-the-fly)
- $359,412
- Comps found
- 6
Show comp detail 6 sales within ~0.75 mi
| Address | Dist | Beds/Ba | Sqft | Sold | Price | $/sf | Match |
|---|---|---|---|---|---|---|---|
| 1068 Smith Rd | 0.34mi | 3/2.0 | 1,328 (-10%) | 6mo | $316,000 | $238 | 60 |
| 8020 Stahley Rd | 0.30mi | 3/2.0 | 1,389 (-6%) | 18mo | $283,500 | $204 | 59 |
| 10250 Transit Rd | 0.57mi | 3/2.5 | 1,352 (-8%) | 2mo | $391,675 | $290 | 54 |
| 50 French Oaks Ln | 0.49mi | 3/2.0 | 1,589 (+8%) | 23mo | $387,000 | $244 | 43 |
| 2420 Dodge Rd | 0.63mi | 3/3.0 | 1,652 (+12%) | 5mo | $379,000 | $229 | 40 |
| 139 Autumn Creek Ct | 0.63mi | 3/2.0 | 1,690 (+15%) | 10mo | $482,000 | $285 | 36 |
Match score weights: distance 35% · size 25% · config 20% · recency 20%. Top-matched comps best support the ARV.
Projected returns pro-forma
-3.0% appreciation · 5.59% rent growth · sell at horizon
- IRR
- -14.5%
- Equity multiple
- 0.47×
- Total profit
- $-41,781
- Equity at exit
- $41,749
- IRR
- -1.8%
- Equity multiple
- 0.86×
- Total profit
- $-10,712
- Equity at exit
- $24,209
Cash invested: $78,400 (down + closing). Projections, not guarantees.
Landlord ↔ Tenant lean methodology
- Overall (STATE)
- 15 Strongly Tenant-Friendly
- State New York
- 15 Strongly Tenant-Friendly · D+10
- County
- — inherits STATE
- City
- — inherits STATE
ZIP-level market 14051
- Home prices YoY
- -22.5%
- Rents YoY
- 5.6%
- Active inventory
- 153
- Price-to-rent
- 9.2×
Monthly cashflow live
- Estimated rent
- $2,549 high interval (Pro) →
- Mortgage (P&I)
- −$1,468
- Tax from tax record
- −$481 /mo · $5,777/yr
- Insurance
- −$117
- HOA
- −$0
- Vacancy / Maint / Mgmt
- −$535
- Net cashflow
- $-53
Break-even live
Sensitivity live
| Price | -10% $106 | -5% $27 | +0% $-53 | +5% $-132 | +10% $-211 |
|---|---|---|---|---|---|
| Rent | -10% $-254 | -5% $-153 | +0% $-53 | +5% $48 | +10% $149 |
| Rate | -1.0pp $89 | -0.5pp $19 | base $-53 | +0.5pp $-125 | +1.0pp $-199 |
UW: 25.0% down · 7.5% · 30yr · 1.5% tax · 5.0% vac · 8.0% maint · 8.0% mgmt
Financing live
Cash to close
- Down payment
- $70,000
- Closing costs
- $8,400
- Reserves months
- —
- Total cash needed
- —
Loan-product check · same deal, 3 products live
Conventional
25% down · 7.5% · 30yr
- Down + closing
- —
- Monthly P&I
- —
- Monthly cashflow
- —
- DSCR
- —
- Eligible?
- —
Personal DTI + credit; lowest rate.
DSCR
20% down · 8.5% · 30yr
- Down + closing
- —
- Monthly P&I
- —
- Monthly cashflow
- —
- DSCR
- —
- Eligible?
- —
No personal income docs; deal must DSCR.
Hard money
10% down · 12.0% · 12mo
- Down + closing
- —
- Monthly P&I
- —
- Monthly cashflow
- —
- DSCR
- —
- Eligible?
- —
Short-term bridge; refi at stabilization.
Rent comps 6 comps
| Address | Beds | Baths | Sqft | Rent | $/sqft | DOM | Units | Dist |
|---|---|---|---|---|---|---|---|---|
| 4410-4420 N French Rd East Amherst, NY | 1.0–3.0 | 1.0–2.5 | 1176 | $2,695 | $2.29 | 3d | 1 | 0.46mi |
| 4806 N French Rd East Amherst, NY | 2.0 | 2.0 | 1726 | $2,500 | $1.45 | 3d | 1 | 0.48mi |
| 5 Autumn Creek Ln East Amherst, NY | 1.0–2.0 | 1.0–2.0 | 1120 | $2,053 | $1.83 | 3d | 10 | 0.56mi |
| 9500 Transit Rd East Amherst, NY | 1.0–2.0 | 1.5–2.0 | 1021 | $3,075 | $3.01 | 3d | 12 | 0.88mi |
| 45 Beehunter Ct Unit D East Amherst, NY | 2.0 | 2.0 | 1102 | $1,850 | $1.68 | 45d | 1 | 1.21mi |
| 20 Dockside Pkwy East Amherst, NY | 1.0–3.0 | 1.0–2.0 | 1120 | $2,596 | $2.32 | 3d | 11 | 1.49mi |
Listing history 4 events
-
2026-04-22status Pending
-
2026-04-16$280,000 Active
-
2025-10-31$299,000 Active
-
2002-04-05soldstatus $85,000
ⓘ Source: listings_history table (triggers on properties + properties_extension) + one-shot
backfill from property_details.listing_events for pre-trigger history.
Tax reassessment forecast NY · Partial reset (capped growth)
- Current annual tax
- $5,777 · $481/mo
- Projected year-2 tax
- $5,777 · $481/mo
- Expected delta
- $0/yr ($0/mo · 0.0%)
ⓘ Screening estimate from a state-policy table — verify with the county assessor before closing.
Climate risk First Street
- Flood 1/10 Low FEMA zone X (unshaded) · 0% chance over 30 yrs
- Wildfire 2/10 Low
- Heat 2/10 Low 7 d/yr ≥94°F today · 15 d/yr by 30 yrs out
- Wind 1/10 Low
- Air quality 2/10 Low 2 unhealthy d/yr today · 2 by 30 yrs out
Nearby sold comps map
Loading sold comps map…
Walkable amenities ~0.75 mi
Loading nearby amenities…
Taxation est. · year 1
- Rental income
- $30,592
- − Mortgage interest
- −$15,684
- − Property taxes
- −$5,777
- − Insurance
- −$1,400
- − Repairs & maintenance
- −$2,447
- − Management
- −$2,447
- − Depreciation
- −$8,145
- Taxable loss
- −$5,310
- Est. tax savings @ 24.0%
- +$1,274
- After-tax cash flow
- $644/yr
For passive investors: Depreciation is non-cash, so a rental often shows a tax loss while cash-flowing — sheltering income. Rental losses are passive: they offset passive income freely, and up to $25,000/yr can offset ordinary (W-2) income if you actively participate and your MAGI is under $100k (phasing out to $0 by $150k); unused losses carry forward. On sale, claimed depreciation is recaptured at up to 25%, and gains may owe capital-gains tax (a 1031 exchange can defer both). Figures are a year-1 estimate at your 24.0% rate — not tax advice; consult a CPA.
Schools (NCES district)
- District
- Williamsville Central School District
- NCES district ID
- 3631470
- Math proficiency
- 64% ▼ -14.00%
- Reading proficiency
- 77% ▲ 6.00%
- Median HH income
- $79,907
- Composite
- 62.59/100
- National rank
- #678
- State rank
- #114 of 590 in NY
Livability — Harris Hill
- Score
- 72/100
- State rank
- #345
- US rank
- #5816
Category grades
Schools grade is shown separately in the Schools card above.
Census & demographics
- County
- Erie County · 714,559 people
- Metro
- Buffalo-Cheektowaga, NY
- Population (ZIP)
- 19,739
- Household income
- $135,663
- Rent vs Own
- Severe rent burden
- 375.0
Population outlook (Erie County) Hauer SSP2
- Today (2025)
- 933,037 people
- By 2030
- 935,181 · +0.2%
- By 2040
- 928,531 · -0.5%
- By 2050
- 905,725 · -2.9%
- By 2075
- 834,037 · -10.6%
- By 2100
- 708,033 · -24.1%
Race, ethnicity, and origin ACS 2023
- Neighborhood character
- Predominantly White (82%)
- Race & ethnicity
- White 82% Asian 9% Two or more races 4% Hispanic / Latino 4% Black 2%
- Common ancestry
- Romanian 13% Italian 2% Subsaharan African 2%
- Foreign-born
- 14% · Canada, China, Jamaica
- Languages at home
- 85% English-only · Other Indo-European 6% Chinese 2% Russian/Polish/Slavic 2%
Political lean MEDSL · Erie
- 2024 margin
- Lean D (+9.7) · D 54.8% · R 45.2%
- 2008→2024 swing
- -7.9pp toward R · 2008: 17.5pp · 2024: 9.7pp
- All cycles
- 2024: D+9.7 2020: D+14.7 2016: D+4.8 2012: D+15.6 2008: D+17.5
Not yet ingested
- Civics
- —
Market trends
- HPI YoY
- ▼ -93.55%
- Current HPI
- 322.688
- Rent YoY
- ▲ 5.59%
- Metro
- Buffalo-Cheektowaga, NY
- State GDP YoY
- ▲ 2.60%
- F500 in state
- 92
Industry mix (Fortune 500 HQ in NY)
| Industry | F500 HQs | Revenue |
|---|---|---|
| Financial Services | 10 | $950B |
|
||
| Consumer Goods | 9 | $162B |
|
||
| Insurance | 4 | $225B |
|
||
| Telecommunications | 2 | $144B |
|
||
| Pharmaceuticals | 2 | $112B |
|
||
| Media / Entertainment | 2 | $69B |
|
||
Price history
+229.4% since first listed4 events — show timeline
- 2026-04-22 Pending — WNYREIS
- 2026-04-16 Listed $280,000 WNYREIS
- 2025-10-31 Listed $299,000 WNYREIS
- 2002-04-05 Sold (Public Records) $85,000 Public Records
Property tax history
+7.0%/yrLatest (2025): $5,777 · +1.7% YoY. Source: county tax records.
Cash-flow waterfall
monthlySold comps — $/sqft
last 12 mo · ≤1 miLoading sold comps…