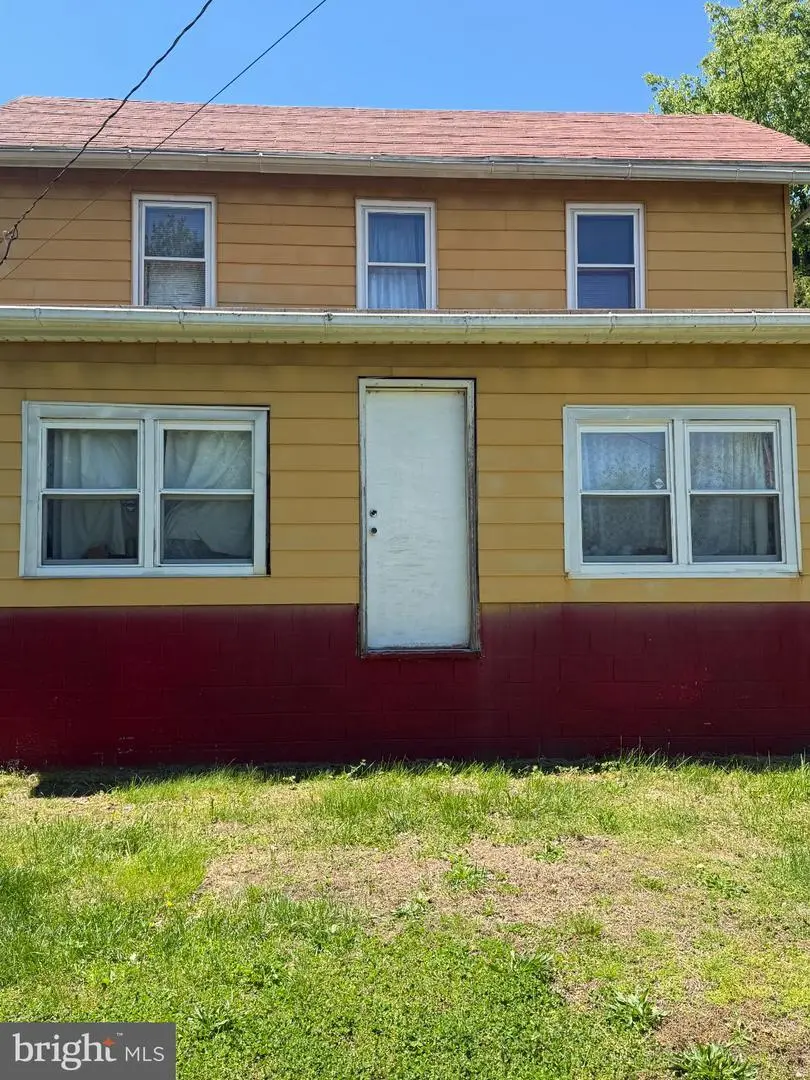
668 Fairview Rd · Clayton, NJ
Flood risk 1/10 · Minimal
- FEMA flood zone
- X (unshaded)
- Chance of flooding over 30 yrs
- 0.0%
- Est. flood insurance / yr
- $507 – $1,088
Fire risk 5/10 · Moderate
- Est. fire insurance / yr
- $526 – $976
Heat risk 6/10 · Moderate
- Hot days now (above 103°F)
- 7 days/yr
- Hot days in 30 yrs
- 15 days/yr
Wind risk 6/10 · Moderate
- Chance of severe wind over 30 yrs
- 66.0%
Air-quality risk 3/10 · Minor
- Unhealthy air days now
- 2 days/yr
- Unhealthy air days in 30 yrs
- 5 days/yr
Risk factors via First Street. Map © Google.
Why this score? — see what drove the B+ grade
The composite is a weighted blend of 9 inputs, each scored 0–100. Each bar is that input's sub-score; the figure is the points it added to the 100-point composite (weight × sub-score).
- Cash flow +30.0/30.0
- ARV discount +15.0/15.0
- 1% rule +10.0/10.0
- DSCR +10.0/10.0
- Schools +4.3/10.0
- Rent growth +3.7/5.0
- Livability +3.5/5.0
- Condition / age +2.5/5.0
- Appreciation +0.0/10.0
$165,000
🖨 Deal sheet 📄 Offer letter ✓ Due diligence
Listing remarks
Charming Colonial on 1.25 Acres – Investor or Relocation Opportunity! IMPROVED PRICE!!!! This 2-bedroom, 1-bath Colonial sits on a generous 1.25-acre lot and is being sold as-is, offering a fantastic opportunity for investors or those looking to renovate. Perfect for professors or families relocating, the property is not far from Rowan University and conveniently close to shopping and local amenities. Features: 2 bedrooms, 1 full bathroom Spacious Colonial layout Large 1.25-acre lot with potential Sold as-is – bring your vision! Excellent investment or relocation opportunity Don’t miss the chance to own this property with endless possibilities in a convenient location!
Key facts
- Convenient location
- Colonial layout
- 1.25 acres
Tags
Property features AI
Finance
- Other: Ownership: Fee simple; Above-grade finished area reported as 1,144 (assessor)
Exterior
- Parking: Driveway
- Utilities: Well water; On-site septic
- Home design: Detached structure; One or more stories (see above-grade finished area)
- Construction: Frame construction; Concrete perimeter foundation; Basement with dirt floor and poured concrete
- Exterior features: Not in a federal flood zone; Above-grade and below-grade other structures; Lot dimensions per assessor
Interior
- Bedrooms: Two bedrooms on the upper level
- Bathrooms: One full bathroom on the main level; One full bathroom total
- Heating & cooling: Forced air heating (oil-fired); Wall cooling unit; Electric hot water
- Interior features: Main-level accessibility ramp; Partially finished above-grade living area (per assessor)
Neighborhood map
What this means for you Summary
Snapshot
- This is a 2-bed/1.0-bath single-family listed at $165k.
Deal economics
- At list price, monthly cash flow is $739 ($9k/yr) — positive.
- The deal already cash-flows at list — no discount required.
- Meets the 1% rule at list price ($3k rent vs $165k).
- Recommended offer: $150k (9.0% below list) — sets the bar for market timing.
- Cap rate 11.7% vs local median 2.9% in Clayton — top-decile yield for the area; either an underpriced asset or a hidden risk that comps aren't pricing in. Stress-test before assuming the spread holds.
Location & tenants
- Location reads 70/100 on livability (#266 in NJ) — a middle-class / working-renter tenant base. Strengths: crime A+, employment A+, housing A+; Watch: cost of living C-, schools F, amenities F.
- Elk Township School District (rural): math 45% / reading 45% proficiency, ranked #419 of 612 in NJ (top 68%) — families likely to look elsewhere, expect single-tenant / working-renter base with shorter leases.
- Market conditions: Rents rising fast (+4.6%/yr); 75 active listings in the ZIP; 2 comparable units currently listed for rent nearby; solid renter incomes; 1,047 units permitted in Gloucester County in 2024 (183 in 5+ unit buildings).
- This rent runs 35% of the median local income ($89k/yr) — at the standard rent-burdened threshold; future hikes will face affordability resistance.
Forward outlook
- Local home prices are declining (-3.0%/yr); year-one equity from $1k of loan paydown is wiped out by about $5k of value loss. Plan a longer hold.
- Gloucester County population projected to shrink 5% by 2050 — rents likely to lag national; underwrite the cash flow, not the appreciation.
- At projected returns (-3.0% appreciation + 4.6% rent growth), your $46k cash investment doubles in ~6 years — after that, you're playing with house money.
Negotiation context
- It's been on market 97 days — a 9% lower offer ($150k) is reasonable based on typical stale-listing flexibility.
Risks & watch-outs
- Watch-outs: property tax is 2.6% of price; built in 1930 — expect roof / HVAC / electrical / plumbing capex.
- Climate carrying-cost: major wind risk, 66% chance of damaging wind over 30y; moderate wildfire risk; extreme-heat days projected 7→15/yr by 2055 (HVAC capex compounding) — expect insurance premiums to compound above CPI over the hold.
Questions for the listing agent
- It's been on market 97 days. Have you received any prior offers? Is the seller open to a 9% concession, seller financing, or rate buy-down credit?
- Built in 1930 — when were the roof, HVAC, electrical panel, plumbing, and water heater last replaced?
- Property tax is high relative to price — has the assessment been appealed recently, and will the sale trigger a re-assessment?
- Why hasn't it sold? Are there any deal-killer items the seller is aware of (foundation, flood, title, zoning, code violations)?
- Is there a deadline driving the sale (1031 exchange, divorce, estate, relocation)? That informs how much negotiation room exists.
- Schools are F-rated, which usually means shorter tenancies and higher turnover. Who's the typical renter profile here, and what's been the actual vacancy rate?
- What's the average days-on-market for RENTAL listings here right now (not sales)? A rising rental-DOM trend means longer vacancies and softer asking-rent achievability than the comps imply.
- What's the recent tenant-quality profile in this submarket — average credit score on applications, eviction rate, late-payment / NSF rate, and stable-employment percentage? A property-management company in the area should have these aggregated.
- How much new for-sale + rental construction is in the pipeline within 1–3 miles? Heavy new supply typically softens prices + rents 12–24 months out; constrained supply supports both.
Investment metrics
- 1% rule
- 1.56% ✓
- Cap rate
- 11.67%
- Cash-on-cash
- 19.20%
- DSCR
- 1.85
- GRM
- 5.4
CMA / ARV
- ARV (on-the-fly)
- $248,248
- Comps found
- 7
Show comp detail 7 sales within ~0.75 mi
| Address | Dist | Beds/Ba | Sqft | Sold | Price | $/sf | Match |
|---|---|---|---|---|---|---|---|
| 314 Wilson Ave | 0.25mi | 2/1.0 | 1,200 (+5%) | 6mo | $210,000 | $175 | 75 |
| 111 Earl Ave | 0.52mi | 3/2.0 (+1) | 1,144 (0%) | 8mo | $346,500 | $303 | 60 |
| 405 Whig Ln | 0.67mi | 3/1.0 (+1) | 1,150 (+0%) | 4mo | $215,000 | $187 | 60 |
| 217 Stanger Ave | 0.71mi | 3/1.0 (+1) | 1,126 (-2%) | 1mo | $355,000 | $315 | 59 |
| 306 Wilson Ave | 0.26mi | 3/1.0 (+1) | 976 (-15%) | 7mo | $120,000 | $123 | 52 |
| 121 Earl Ave | 0.56mi | 2/1.0 | 991 (-13%) | 17mo | $215,000 | $217 | 37 |
| 242 Stanger Ave | 0.66mi | 3/1.0 (+1) | 984 (-14%) | 7mo | $240,000 | $244 | 35 |
Match score weights: distance 35% · size 25% · config 20% · recency 20%. Top-matched comps best support the ARV.
Projected returns pro-forma
-3.0% appreciation · 4.64% rent growth · sell at horizon
- IRR
- 13.2%
- Equity multiple
- 1.54×
- Total profit
- $24,794
- Equity at exit
- $24,602
- IRR
- 23.4%
- Equity multiple
- 3.19×
- Total profit
- $101,048
- Equity at exit
- $14,266
Cash invested: $46,200 (down + closing). Projections, not guarantees.
Landlord ↔ Tenant lean methodology
- Overall (STATE)
- 21 Tenant-Leaning
- State New Jersey
- 21 Tenant-Leaning · D+6
- County
- — inherits STATE
- City
- — inherits STATE
ZIP-level market 08028
- Home prices YoY
- -21.2%
- Rents YoY
- 4.6%
- Active inventory
- 75
- Price-to-rent
- 5.4×
Monthly cashflow live
- Estimated rent
- $2,570 medium interval (Pro) →
- Mortgage (P&I)
- −$865
- Tax from tax record
- −$357 /mo · $4,282/yr
- Insurance
- −$69
- HOA
- −$0
- Vacancy / Maint / Mgmt
- −$540
- Net cashflow
- $739
Break-even live
UW: 25.0% down · 7.5% · 30yr · 1.5% tax · 5.0% vac · 8.0% maint · 8.0% mgmt
Financing live
Cash to close
- Down payment
- $41,250
- Closing costs
- $4,950
- Reserves months
- —
- Total cash needed
- —
Loan-product check · same deal, 3 products live
Conventional
25% down · 7.5% · 30yr
- Down + closing
- —
- Monthly P&I
- —
- Monthly cashflow
- —
- DSCR
- —
- Eligible?
- —
Personal DTI + credit; lowest rate.
DSCR
20% down · 8.5% · 30yr
- Down + closing
- —
- Monthly P&I
- —
- Monthly cashflow
- —
- DSCR
- —
- Eligible?
- —
No personal income docs; deal must DSCR.
Hard money
10% down · 12.0% · 12mo
- Down + closing
- —
- Monthly P&I
- —
- Monthly cashflow
- —
- DSCR
- —
- Eligible?
- —
Short-term bridge; refi at stabilization.
Rent comps 2 comps
| Address | Beds | Baths | Sqft | Rent | $/sqft | DOM | Units | Dist |
|---|---|---|---|---|---|---|---|---|
| 811 N New St Clayton, NJ | 3.0 | 1.0 | 912 | $2,100 | $2.30 | 19d | 1 | 1.14mi |
| 103 Still Run Unit 3BR Clayton, NJ | 3.0 | 2.5 | 850 | $2,550 | $3.00 | 10d | 1 | 1.21mi |
Listing history 16 events
-
2026-06-18days on market $165,000 Active 97 DOM
-
2026-06-17days on market $165,000 Active 96 DOM
-
2026-06-16days on market $165,000 Active 95 DOM
-
2026-06-15days on market $165,000 Active 94 DOM
-
2026-06-13days on market $165,000 Active 92 DOM
-
2026-06-13days on market $165,000 Active 91 DOM
-
2026-06-09days on market $165,000 Active 88 DOM
-
2026-06-08days on market $165,000 Active 87 DOM
-
2026-06-07days on market $165,000 Active 86 DOM
-
2026-06-04days on market $165,000 Active 83 DOM
-
2026-06-03days on market $165,000 Active 82 DOM
-
2026-06-02pricedays on market $165,000 Active 81 DOM
-
2026-06-01days on market $229,000 Active 80 DOM
-
2026-05-31days on market $229,000 Active 79 DOM
-
2026-04-26price $229,000
-
2026-03-13$235,000 Active
ⓘ Source: listings_history table (triggers on properties + properties_extension) + one-shot
backfill from property_details.listing_events for pre-trigger history.
Tax reassessment forecast NJ · Partial reset (capped growth)
- Current annual tax
- $4,282 · $357/mo
- Projected year-2 tax
- $4,282 · $357/mo
- Expected delta
- $0/yr ($0/mo · 0.0%)
ⓘ Screening estimate from a state-policy table — verify with the county assessor before closing.
Climate risk First Street
- Flood 1/10 Low FEMA zone X (unshaded) · 0% chance over 30 yrs
- Wildfire 5/10 Major
- Heat 6/10 Major 7 d/yr ≥103°F today · 15 d/yr by 30 yrs out
- Wind 6/10 Major 66% chance of damaging wind over 30 yrs
- Air quality 3/10 Moderate 2 unhealthy d/yr today · 5 by 30 yrs out
Nearby sold comps map
Loading sold comps map…
Walkable amenities ~0.75 mi
Loading nearby amenities…
Taxation est. · year 1
- Rental income
- $30,839
- − Mortgage interest
- −$9,243
- − Property taxes
- −$4,282
- − Insurance
- −$825
- − Repairs & maintenance
- −$2,467
- − Management
- −$2,467
- − Depreciation
- −$4,800
- Taxable income
- $6,755
- Est. tax owed @ 24.0%
- −$1,621
- After-tax cash flow
- $7,251/yr
For passive investors: Depreciation is non-cash, so a rental often shows a tax loss while cash-flowing — sheltering income. Rental losses are passive: they offset passive income freely, and up to $25,000/yr can offset ordinary (W-2) income if you actively participate and your MAGI is under $100k (phasing out to $0 by $150k); unused losses carry forward. On sale, claimed depreciation is recaptured at up to 25%, and gains may owe capital-gains tax (a 1031 exchange can defer both). Figures are a year-1 estimate at your 24.0% rate — not tax advice; consult a CPA.
Schools (NCES district)
- District
- Elk Township School District
- NCES district ID
- 3404620
- Math proficiency
- 45% ▲ 1.00%
- Reading proficiency
- 45% ▼ -11.00%
- Median HH income
- $68,946
- Composite
- 42.67/100
- National rank
- #6797
- State rank
- #419 of 612 in NJ
Livability — Clayton
- Score
- 70/100
- State rank
- #266
- US rank
- #7860
Category grades
Schools grade is shown separately in the Schools card above.
Census & demographics
- County
- Gloucester County · 160,422 people
- City population
- 8,395
- Metro
- Philadelphia-Camden-Wilmington, PA-NJ-DE-MD
- Population (ZIP)
- 25,098
- Household income
- $89,130
- Rent vs Own
- Severe rent burden
- 775.0
Population outlook (Gloucester County) Hauer SSP2
- Today (2025)
- 298,895 people
- By 2030
- 299,031 · +0.0%
- By 2040
- 294,020 · -1.6%
- By 2050
- 284,188 · -4.9%
- By 2075
- 260,720 · -12.8%
- By 2100
- 229,565 · -23.2%
Race, ethnicity, and origin ACS 2023
- Neighborhood character
- Diverse neighborhood (Simpson 0.58)
- Race & ethnicity
- White 61% Black 18% Hispanic / Latino 10% Asian 7% Two or more races 6%
- Hispanic origin (detail)
- Mexican 1% Puerto Rican 6%
- Common ancestry
- Romanian 3% Italian 1% Slovak 1%
- Foreign-born
- 9% · Canada, Jamaica, China
- Languages at home
- 85% English-only · Spanish 7% Other Indo-European 3% Other Asian/Pacific 1%
Political lean MEDSL · Gloucester
- 2024 margin
- Toss-up / Even · D 47.8% · R 50.6% · Other 1.6%
- 2008→2024 swing
- -15.0pp toward R · 2008: 12.2pp · 2024: -2.8pp
- All cycles
- 2024: R+2.8 2020: D+1.9 2016: R+0.4 2012: D+10.5 2008: D+12.2
Not yet ingested
- Civics
- —
Market trends
- HPI YoY
- ▼ -79.06%
- Current HPI
- 293.7251
- Rent YoY
- ▲ 4.64%
- Metro
- Philadelphia-Camden-Wilmington, PA-NJ-DE-MD
- State GDP YoY
- ▲ 2.05%
- F500 in state
- 34
Industry mix (Fortune 500 HQ in NJ)
| Industry | F500 HQs | Revenue |
|---|---|---|
| Consumer Goods | 3 | $31B |
|
||
| Pharmaceuticals | 2 | $153B |
|
||
| Technology | 2 | $21B |
|
||
| Insurance | 2 | $20B |
|
||
| Healthcare | 2 | $19B |
|
||
| Financial Services | 1 | $70B |
|
||
Price history
-2.6% since first listed2 events — show timeline
- 2026-04-26 Price Changed $229,000 BRIGHT MLS
- 2026-03-13 Listed $235,000 BRIGHT MLS
Property tax history
+1.6%/yrLatest (2025): $4,282 · +2.6% YoY. Source: county tax records.
Cash-flow waterfall
monthlySold comps — $/sqft
last 12 mo · ≤1 miLoading sold comps…