250 Shepherd Ln · Arlington, VT
Flood risk 1/10 · Minimal
- FEMA flood zone
- X (unshaded)
- Chance of flooding over 30 yrs
- 0.0%
- Est. flood insurance / yr
- $507 – $1,088
Fire risk 3/10 · Minor
- Est. fire insurance / yr
- $480 – $892
Heat risk 1/10 · Minimal
- Hot days now (above 90°F)
- 7 days/yr
- Hot days in 30 yrs
- 17 days/yr
Wind risk 3/10 · Minor
- Chance of severe wind over 30 yrs
- 5.0%
Air-quality risk 2/10 · Minimal
- Unhealthy air days now
- 0 days/yr
- Unhealthy air days in 30 yrs
- 1 days/yr
Risk factors via First Street. Map © Google.
Why this score? — see what drove the D- grade
The composite is a weighted blend of 9 inputs, each scored 0–100. Each bar is that input's sub-score; the figure is the points it added to the 100-point composite (weight × sub-score).
- ARV discount +13.4/15.0
- Appreciation +10.0/10.0
- Schools +5.0/10.0
- Livability +2.9/5.0
- Cash flow +2.5/30.0
- Rent growth +2.5/5.0
- Condition / age +2.5/5.0
- 1% rule +0.0/10.0
- DSCR +0.0/10.0
$350,000
🖨 Deal sheet 📄 Offer letter ✓ Due diligence
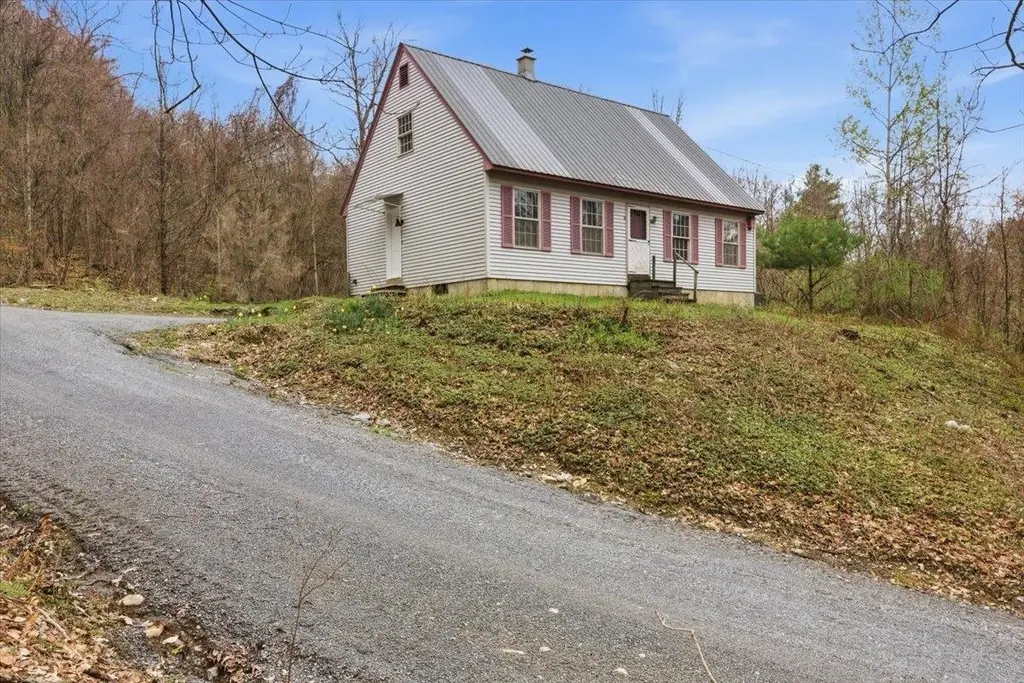
Listing remarks MLS
Never before offered for sale this cape style home is on 14 tranquil acres of woods and trails and seclusion. Enjoy the bluestone patio and enclosed porch or quiet stting area in woods with mountain views. Hike, hunt or snowshoe right on your own proeprty. New driveway with grading done summer of 2012. New electric panel and new flooring added recenlty. Tiled floor in kitchen and dining area, hardwoods in living room and laminate in bedrooms. Well insulated and newer metal roof. Next year is ready for logging and potential income from that.
Key facts
- 14 acre lot
- Built 1988
- Listed 55 days
Property features AI
Exterior
- Parking: Driveway with crushed stone, dirt and gravel surfaces
- Utilities: Drilled well; Septic system; 100 amp electrical service; Cable internet available; Cable service and LP/bottled gas available
- Home design: Cape-style home; Existing construction
- Construction: Vinyl siding; Metal roof; Built in 1988
- Exterior features: Country setting; Hilly terrain; Wooded lot; Adjoins state/national forest; Rural location; Privately maintained road frontage; Crushed stone/dirt/gravel driveway
Interior
- Kitchen: Dishwasher; Electric stove; Microwave; Refrigerator
- Flooring: Carpet; Hardwood; Laminate; Slate/stone; Vinyl
- Bathrooms: One full bath; One half bath
- Heating & cooling: Oil heating; Central air conditioning
- Interior features: Five total rooms; Concrete basement with interior stair access and storage space
- Laundry & utility: Washer; Dryer
Neighborhood map
What this means for you Summary
Snapshot
- This is a 2-bed/1.5-bath single-family listed at $350k.
Deal economics
- At list price, monthly cash flow is $-1k ($-15k/yr) — negative.
- To cash-flow at today's rent, offer at most $136k (61.0% below list).
- To meet the 1% rule (rent ≥ 1% of price), the offer needs to be $134k (61.8% below list).
- Recommended offer: $134k (61.8% below list) — sets the bar for 1% rule.
Location & tenants
- Location reads 58/100 on livability (#104 in VT) — a working-class tenant base; expect higher turnover. Strengths: crime A+, housing B+, cost of living B; Watch: schools C-, employment C-, health & safety D.
- Market conditions: 17 active listings in the ZIP; 59 units permitted in Bennington County in 2024 (0 in 5+ unit buildings).
Forward outlook
- In year one you build about $37k of equity ($2k loan paydown + $35k appreciation (10.0% local appreciation)).
- Bennington County population projected at -23% by 2050 — secular population decline; favor cash flow + early exit over multi-decade hold.
- By year 2, paydown + projected appreciation supports a ~$60k cash-out refi (75% LTV) — recoverable capital for the next deal without selling this one.
Negotiation context
- It's been on market 55 days — a 3% lower offer ($340k) is reasonable based on typical stale-listing flexibility.
- 2 sale attempts since 14y ago; this cycle's ask has dropped $50k (12%) from the opening price — seller is motivated, your offer sets the floor, not the list.
- Current owner paid $230k; list at $350k implies a 52% gain — meaningful room to come down on a strong offer.
Questions for the listing agent
- What do current leases actually rent for vs. the listed asking? Can we see a recent rent roll and the last 12 months of T-12 income?
- It's been on market 55 days. Have you received any prior offers? Is the seller open to a 62% concession, seller financing, or rate buy-down credit?
- Is there a deadline driving the sale (1031 exchange, divorce, estate, relocation)? That informs how much negotiation room exists.
- The area grade is low — what's the realistic commute time and amenity access for the typical tenant pool here? Any planned neighborhood developments (good or bad) we should know about?
- What's the average days-on-market for RENTAL listings here right now (not sales)? A rising rental-DOM trend means longer vacancies and softer asking-rent achievability than the comps imply.
- What's the recent tenant-quality profile in this submarket — average credit score on applications, eviction rate, late-payment / NSF rate, and stable-employment percentage? A property-management company in the area should have these aggregated.
- How much new for-sale + rental construction is in the pipeline within 1–3 miles? Heavy new supply typically softens prices + rents 12–24 months out; constrained supply supports both.
Investment metrics
- 1% rule
- 0.38% ✗
- Cap rate
- 2.15%
- Cash-on-cash
- -14.81%
- DSCR
- 0.34
- GRM
- 21.8
CMA / ARV
- ARV (median comp)
- $402,672
- List price
- $350,000
- Delta
- -13.08%
- Verdict
- UNDERPRICED
- Comps
- 8 within 1.0 mi
Show comp detail 3 sales within ~0.75 mi
| Address | Dist | Beds/Ba | Sqft | Sold | Price | $/sf | Match |
|---|---|---|---|---|---|---|---|
| 447 Farm Rd | 0.27mi | 2/2.0 | 1,564 (+6%) | 8mo | $405,000 | $259 | 69 |
| 1799 Old West Rd | 0.44mi | 3/2.0 (+1) | 1,560 (+5%) | 17mo | $420,000 | $269 | 49 |
| 156 Gingerbread Hill Rd | 0.63mi | 2/2.0 | 1,512 (+2%) | 23mo | $440,000 | $291 | 46 |
Match score weights: distance 35% · size 25% · config 20% · recency 20%. Top-matched comps best support the ARV.
Projected returns pro-forma
10.0% appreciation · 3.0% rent growth · sell at horizon
- IRR
- 14.0%
- Equity multiple
- 2.16×
- Total profit
- $113,522
- Equity at exit
- $315,308
- IRR
- 14.0%
- Equity multiple
- 5.03×
- Total profit
- $394,729
- Equity at exit
- $679,973
Cash invested: $98,000 (down + closing). Projections, not guarantees.
Landlord ↔ Tenant lean methodology
- Overall (STATE)
- 41 Moderately Tenant-Leaning
- State Vermont
- 41 Moderately Tenant-Leaning · D+15
- County
- — inherits STATE
- City
- — inherits STATE
ZIP-level market 05250
- Home prices YoY
- 11.7%
- Active inventory
- 17
- Price-to-rent
- 21.8×
Monthly cashflow live
- Estimated rent
- $1,338 medium interval (Pro) →
- Mortgage (P&I)
- −$1,835
- Tax from tax record
- −$285 /mo · $3,420/yr
- Insurance
- −$146
- HOA
- −$0
- Vacancy / Maint / Mgmt
- −$281
- Net cashflow
- $-1,209
Break-even live
UW: 25.0% down · 7.5% · 30yr · 1.5% tax · 5.0% vac · 8.0% maint · 8.0% mgmt
Financing live
Cash to close
- Down payment
- $87,500
- Closing costs
- $10,500
- Reserves months
- —
- Total cash needed
- —
Loan-product check · same deal, 3 products live
Conventional
25% down · 7.5% · 30yr
- Down + closing
- —
- Monthly P&I
- —
- Monthly cashflow
- —
- DSCR
- —
- Eligible?
- —
Personal DTI + credit; lowest rate.
DSCR
20% down · 8.5% · 30yr
- Down + closing
- —
- Monthly P&I
- —
- Monthly cashflow
- —
- DSCR
- —
- Eligible?
- —
No personal income docs; deal must DSCR.
Hard money
10% down · 12.0% · 12mo
- Down + closing
- —
- Monthly P&I
- —
- Monthly cashflow
- —
- DSCR
- —
- Eligible?
- —
Short-term bridge; refi at stabilization.
Listing history 20 events
-
2026-06-18days on market $350,000 Active 55 DOM
-
2026-06-17days on market $350,000 Active 54 DOM
-
2026-06-16days on market $350,000 Active 53 DOM
-
2026-06-15days on market $350,000 Active 52 DOM
-
2026-06-15days on market $350,000 Active 51 DOM
-
2026-06-13days on market $350,000 Active 50 DOM
-
2026-06-12days on market $350,000 Active 49 DOM
-
2026-06-09days on market $350,000 Active 46 DOM
-
2026-06-08pricedays on market $350,000 Active 45 DOM
-
2026-06-08days on market $389,900 Active 44 DOM
-
2026-06-07days on market $389,900 Active 43 DOM
-
2026-06-03days on market $389,900 Active 40 DOM
-
2026-06-02days on market $389,900 Active 39 DOM
-
2026-06-01days on market $389,900 Active 38 DOM
-
2026-05-31days on market $389,900 Active 37 DOM
-
2026-05-18price $389,900 943-char remark
-
2026-04-24$399,900 Active 943-char remark
-
2013-05-31soldstatus $230,000
-
2013-05-23soldstatus $230,000 546-char remark
Show marketing remark (546 chars)
Never before offered for sale this cape style home is on 14 tranquil acres of woods and trails and seclusion. Enjoy the bluestone patio and enclosed porch or quiet stting area in woods with mountain views. Hike, hunt or snowshoe right on your own proeprty. New driveway with grading done summer of 2012. New electric panel and new flooring added recenlty. Tiled floor in kitchen and dining area, hardwoods in living room and laminate in bedrooms. Well insulated and newer metal roof. Next year is ready for logging and potential income from that.
-
2012-08-22$235,000 546-char remark
Show marketing remark (546 chars)
Never before offered for sale this cape style home is on 14 tranquil acres of woods and trails and seclusion. Enjoy the bluestone patio and enclosed porch or quiet stting area in woods with mountain views. Hike, hunt or snowshoe right on your own proeprty. New driveway with grading done summer of 2012. New electric panel and new flooring added recenlty. Tiled floor in kitchen and dining area, hardwoods in living room and laminate in bedrooms. Well insulated and newer metal roof. Next year is ready for logging and potential income from that.
ⓘ Source: listings_history table (triggers on properties + properties_extension) + one-shot
backfill from property_details.listing_events for pre-trigger history.
Tax reassessment forecast VT · Partial reset (capped growth)
- Current annual tax
- $3,420 · $285/mo
- Projected year-2 tax
- $5,035 · $420/mo
- Expected delta
- +$1,615/yr (+$135/mo · 47.2%)
ⓘ Screening estimate from a state-policy table — verify with the county assessor before closing.
Climate risk First Street
- Flood 1/10 Low FEMA zone X (unshaded) · 0% chance over 30 yrs
- Wildfire 3/10 Moderate
- Heat 1/10 Low 7 d/yr ≥90°F today · 17 d/yr by 30 yrs out
- Wind 3/10 Moderate 5% chance of damaging wind over 30 yrs
- Air quality 2/10 Low 0 unhealthy d/yr today · 1 by 30 yrs out
Nearby sold comps map
Loading sold comps map…
Walkable amenities ~0.75 mi
Loading nearby amenities…
Taxation est. · year 1
- Rental income
- $16,055
- − Mortgage interest
- −$19,605
- − Property taxes
- −$3,420
- − Insurance
- −$1,750
- − Repairs & maintenance
- −$1,284
- − Management
- −$1,284
- − Depreciation
- −$10,182
- Taxable loss
- −$21,471
- Est. tax savings @ 24.0%
- +$5,153
- After-tax cash flow
- $-9,359/yr
For passive investors: Depreciation is non-cash, so a rental often shows a tax loss while cash-flowing — sheltering income. Rental losses are passive: they offset passive income freely, and up to $25,000/yr can offset ordinary (W-2) income if you actively participate and your MAGI is under $100k (phasing out to $0 by $150k); unused losses carry forward. On sale, claimed depreciation is recaptured at up to 25%, and gains may owe capital-gains tax (a 1031 exchange can defer both). Figures are a year-1 estimate at your 24.0% rate — not tax advice; consult a CPA.
Schools (NCES district)
No district data.
Livability — Arlington
- Score
- 58/100
- State rank
- #104
- US rank
- #21059
Category grades
Schools grade is shown separately in the Schools card above.
Census & demographics
- Population (ZIP)
- 3,907
Population outlook (Bennington County) Hauer SSP2
- Today (2025)
- 34,407 people
- By 2030
- 32,975 · -4.2%
- By 2040
- 29,711 · -13.6%
- By 2050
- 26,638 · -22.6%
- By 2075
- 21,318 · -38.0%
- By 2100
- 16,086 · -53.2%
Race, ethnicity, and origin ACS 2023
- Neighborhood character
- Predominantly White (85%)
- Race & ethnicity
- White 85% Two or more races 6% Hispanic / Latino 5% Black 4% Asian 2%
- Hispanic origin (detail)
- Mexican 2%
- Common ancestry
- Romanian 4% Lithuanian 4% Iranian 2%
- Foreign-born
- 3% · Canada, China
- Languages at home
- 96% English-only · Spanish 2% Other Indo-European 1%
Political lean MEDSL · Bennington
- 2024 margin
- Strong D (+22.5) · D 60.0% · R 37.5% · Other 2.6%
- 2008→2024 swing
- -10.9pp toward R · 2008: 33.4pp · 2024: 22.5pp
- All cycles
- 2024: D+22.5 2020: D+27.3 2016: D+22.1 2012: D+33.3 2008: D+33.4
Not yet ingested
- Civics
- —
Market trends
- HPI YoY
- ▲ 32.92%
- Current HPI
- 315.5985
- Rent YoY
- —
- Metro
- —
- State GDP YoY
- —
- F500 in state
- 0
Price history
+48.9% since first listed6 events — show timeline
- 2026-06-08 Price Changed $350,000 PrimeMLS
- 2026-05-18 Price Changed $389,900 PrimeMLS
- 2026-04-24 Listed $399,900 PrimeMLS
- 2013-05-31 Sold (Public Records) $230,000 Public Records
- 2013-05-23 Sold (MLS) $230,000 PrimeMLS
- 2012-08-22 Listed $235,000 PrimeMLS
Property tax history
-1.7%/yrLatest (2024): $3,420 · -1.3% YoY. Source: county tax records.
Cash-flow waterfall
monthlySold comps — $/sqft
last 12 mo · ≤1 miLoading sold comps…