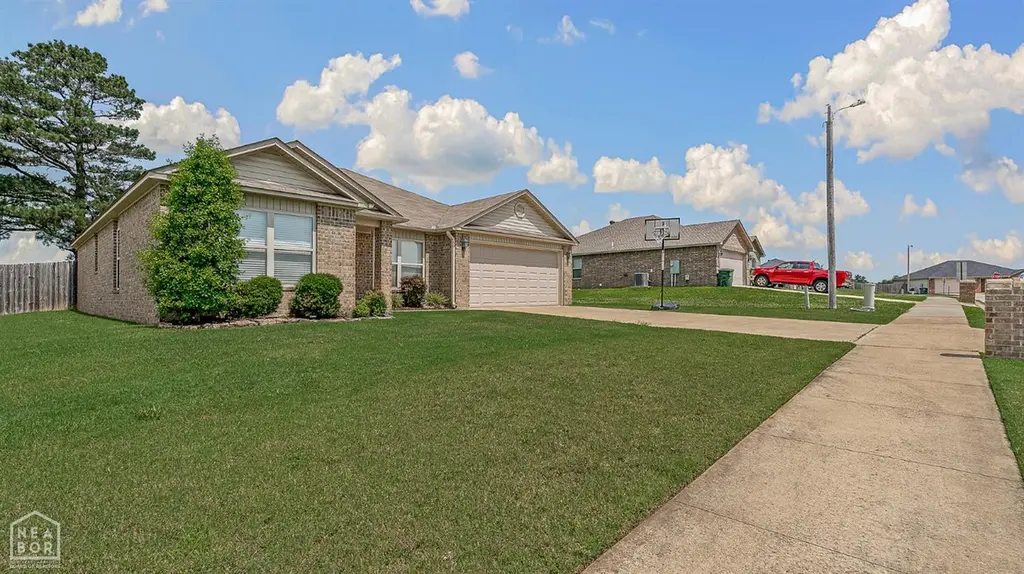
111 Clark Dr · Brookland, AR
Flood risk 1/10 · Minimal
- FEMA flood zone
- X
- Chance of flooding over 30 yrs
- 0.0%
- Est. flood insurance / yr
- $507 – $1,088
Fire risk 3/10 · Minor
- Est. fire insurance / yr
- $1,499 – $2,785
Heat risk 6/10 · Moderate
- Hot days now (above 110°F)
- 7 days/yr
- Hot days in 30 yrs
- 22 days/yr
Wind risk 4/10 · Minor
- Chance of severe wind over 30 yrs
- 9.0%
Air-quality risk 1/10 · Minimal
- Unhealthy air days now
- 0 days/yr
- Unhealthy air days in 30 yrs
- 0 days/yr
Risk factors via First Street. Map © Google.
Why this score? — see what drove the D+ grade
The composite is a weighted blend of 9 inputs, each scored 0–100. Each bar is that input's sub-score; the figure is the points it added to the 100-point composite (weight × sub-score).
- Cash flow +13.3/30.0
- Appreciation +10.0/10.0
- ARV discount +6.7/15.0
- DSCR +4.0/10.0
- Schools +3.6/10.0
- Livability +3.5/5.0
- 1% rule +2.9/10.0
- Rent growth +2.5/5.0
- Condition / age +2.5/5.0
$229,900
🖨 Deal sheet 📄 Offer letter ✓ Due diligence
Listing remarks
Beautiful 4-Bedroom Home in Brookland Heights This all-brick home in desirable Brookland Heights offers space, comfort, and convenience. Thoughtfully landscaped with a privacy-fenced backyard, it provides the peace and security your family deserves. Inside, you'll find a spacious kitchen with ample counter spaceperfect for the home chef. The split floor plan offers a private retreat with the large primary suite located separately from the other three bedrooms. Situated in one of Arkansas' fastest-growing school districts, this home is just minutes from both Jonesboro and Paragould, with Brookland itself quickly expanding with new businesses and amenities. One of the few 4-bedroom homes c
Key facts
- Spacious kitchen
- Split floor plan
- All brick home
Tags
Property features AI
Exterior
- Parking: Attached or detached 2-car garage
- Utilities: Public water; Public sewer
- Home design: Single-family residence; One story
- Construction: Brick construction; Slab foundation
- Exterior features: Patio; Lot of about 0.23 acres
Interior
- Kitchen: Dishwasher; Microwave
- Flooring: Carpet; Ceramic tile
- Bathrooms: 2 full bathrooms
- Heating & cooling: Central heating; Central air conditioning
- Interior features: Ceiling fans; Electric water heater
Neighborhood map
What this means for you Summary
Snapshot
- This is a 4-bed/2.0-bath single-family listed at $230k.
Deal economics
- At list price, monthly cash flow is $-2 ($-23/yr) — negative.
- To cash-flow at today's rent, offer at most $230k (0.1% below list).
- To meet the 1% rule (rent ≥ 1% of price), the offer needs to be $181k (21.3% below list).
- Recommended offer: $181k (21.3% below list) — sets the bar for 1% rule.
- Cap rate 6.3% vs local median 4.1% in Brookland — top-decile yield for the area; either an underpriced asset or a hidden risk that comps aren't pricing in. Stress-test before assuming the spread holds.
Location & tenants
- Location reads 70/100 on livability (#57 in AR) — a middle-class / working-renter tenant base. Strengths: cost of living A+, housing A+, health & safety A; Watch: crime D, amenities F, commute F.
- Brookland School District (suburban): math 45% / reading 39% proficiency, ranked #47 of 238 in AR (top 20%) — families likely to look elsewhere, expect single-tenant / working-renter base with shorter leases.
- Market conditions: 117 active listings in the ZIP; 6 comparable units currently listed for rent nearby; rentals lingering (median 44d on market — plan ~5-8 weeks vacancy on turnover, expect pricing pressure); 100% of comp listings sitting > 30 days — soft ceiling on asking rent; 926 units permitted in Craighead County in 2024 (69 in 5+ unit buildings).
- This rent runs 35% of the median local income ($62k/yr) — at the standard rent-burdened threshold; future hikes will face affordability resistance.
Forward outlook
- In year one you build about $25k of equity ($2k loan paydown + $23k appreciation (10.0% local appreciation)).
- Craighead County population projected at +38% by 2050 — long-run rental-demand tailwind backs the buy-and-hold thesis.
- At projected returns (10.0% appreciation + 3.0% rent growth), your $64k cash investment doubles in ~3 years — after that, you're playing with house money.
- By year 2, paydown + projected appreciation supports a ~$40k cash-out refi (75% LTV) — recoverable capital for the next deal without selling this one.
Negotiation context
- It's been on market 19 days — a 2% lower offer ($226k) is reasonable based on typical stale-listing flexibility.
- 6 sale attempts since 10y ago with the ask held roughly flat each time — persistent listings suggest the price (not the market) is what's stuck; bring a comps-based counter.
- Current owner paid $159k; 45% above their basis — modest negotiation headroom, anchor on the comps not their cost.
Risks & watch-outs
- Climate carrying-cost: extreme-heat days projected 7→22/yr by 2055 (HVAC capex compounding) — expect insurance premiums to compound above CPI over the hold.
Questions for the listing agent
- What do current leases actually rent for vs. the listed asking? Can we see a recent rent roll and the last 12 months of T-12 income?
- Is there a deadline driving the sale (1031 exchange, divorce, estate, relocation)? That informs how much negotiation room exists.
- Crime grade is D in this area — have there been break-ins, vandalism, or insurance claims at this property in the last 3 years? What carrier currently insures it and at what premium?
- The area grade is low — what's the realistic commute time and amenity access for the typical tenant pool here? Any planned neighborhood developments (good or bad) we should know about?
- What's the average days-on-market for RENTAL listings here right now (not sales)? A rising rental-DOM trend means longer vacancies and softer asking-rent achievability than the comps imply.
- What's the recent tenant-quality profile in this submarket — average credit score on applications, eviction rate, late-payment / NSF rate, and stable-employment percentage? A property-management company in the area should have these aggregated.
- How much new for-sale + rental construction is in the pipeline within 1–3 miles? Heavy new supply typically softens prices + rents 12–24 months out; constrained supply supports both.
Investment metrics
- 1% rule
- 0.79% ✗
- Cap rate
- 6.28%
- Cash-on-cash
- -0.04%
- DSCR
- 1.00
- GRM
- 10.6
CMA / ARV
- ARV (median comp)
- $226,062
- List price
- $229,900
- Delta
- 1.70%
- Verdict
- FAIR
- Comps
- 20 within 1.0 mi
Show comp detail 12 sales within ~0.75 mi
| Address | Dist | Beds/Ba | Sqft | Sold | Price | $/sf | Match |
|---|---|---|---|---|---|---|---|
| 307 Harper Dr | 0.28mi | 4/2.0 | 1,566 (+3%) | 4mo | $205,000 | $131 | 79 |
| 357 Emma Dr | 0.34mi | 3/2.0 (-1) | 1,568 (+3%) | 4mo | $165,000 | $105 | 71 |
| 107 Ellis Dr | 0.53mi | 4/2.0 | 1,470 (-4%) | 3mo | $212,500 | $145 | 67 |
| 237 Cole Dr | 0.51mi | 3/2.0 (-1) | 1,485 (-3%) | 1mo | $214,900 | $145 | 66 |
| 68 Clearwater Dr | 0.54mi | 4/2.0 | 1,497 (-2%) | 8mo | $258,990 | $173 | 65 |
| 124 Harper Dr | 0.14mi | 3/2.0 (-1) | 1,716 (+13%) | 6mo | $243,250 | $142 | 62 |
| 97 Ellis Dr | 0.53mi | 4/2.0 | 1,652 (+8%) | 0mo | $207,000 | $125 | 61 |
| 93 Clearwater Dr | 0.49mi | 3/2.0 (-1) | 1,672 (+10%) | 2mo | $283,990 | $170 | 54 |
| 101 Ellis Dr | 0.65mi | 3/2.0 (-1) | 1,436 (-6%) | 2mo | $220,000 | $153 | 53 |
| 74 Clearwater Dr | 0.54mi | 3/2.0 (-1) | 1,672 (+10%) | 2mo | $286,990 | $172 | 52 |
| 126 Ellis Dr | 0.65mi | 3/2.0 (-1) | 1,386 (-9%) | 2mo | $218,850 | $158 | 47 |
| 74 Clearwater Dr | 0.67mi | 3/2.0 (-1) | 1,672 (+10%) | 2mo | $286,990 | $172 | 46 |
Match score weights: distance 35% · size 25% · config 20% · recency 20%. Top-matched comps best support the ARV.
Projected returns pro-forma
10.0% appreciation · 3.0% rent growth · sell at horizon
- IRR
- 24.2%
- Equity multiple
- 2.94×
- Total profit
- $125,017
- Equity at exit
- $207,112
- IRR
- 21.5%
- Equity multiple
- 6.72×
- Total profit
- $368,114
- Equity at exit
- $446,645
Cash invested: $64,372 (down + closing). Projections, not guarantees.
Landlord ↔ Tenant lean methodology
- Overall (STATE)
- 92 Strongly Landlord-Friendly
- State Arkansas
- 92 Strongly Landlord-Friendly · R+14
- County
- — inherits STATE
- City
- — inherits STATE
ZIP-level market 72417
- Home prices YoY
- 20.6%
- Active inventory
- 117
- Price-to-rent
- 10.6×
Monthly cashflow live
- Estimated rent
- $1,809 high interval (Pro) →
- Mortgage (P&I)
- −$1,206
- Tax from tax record
- −$130 /mo · $1,557/yr
- Insurance
- −$96
- HOA
- −$0
- Vacancy / Maint / Mgmt
- −$380
- Net cashflow
- $-2
Break-even live
UW: 25.0% down · 7.5% · 30yr · 1.5% tax · 5.0% vac · 8.0% maint · 8.0% mgmt
Financing live
Cash to close
- Down payment
- $57,475
- Closing costs
- $6,897
- Reserves months
- —
- Total cash needed
- —
Loan-product check · same deal, 3 products live
Conventional
25% down · 7.5% · 30yr
- Down + closing
- —
- Monthly P&I
- —
- Monthly cashflow
- —
- DSCR
- —
- Eligible?
- —
Personal DTI + credit; lowest rate.
DSCR
20% down · 8.5% · 30yr
- Down + closing
- —
- Monthly P&I
- —
- Monthly cashflow
- —
- DSCR
- —
- Eligible?
- —
No personal income docs; deal must DSCR.
Hard money
10% down · 12.0% · 12mo
- Down + closing
- —
- Monthly P&I
- —
- Monthly cashflow
- —
- DSCR
- —
- Eligible?
- —
Short-term bridge; refi at stabilization.
Rent comps 6 comps
| Address | Beds | Baths | Sqft | Rent | $/sqft | DOM | Units | Dist |
|---|---|---|---|---|---|---|---|---|
| 123 Hidden Creek Dr Brookland, AR | 3.0 | 2.0 | 1970 | $2,550 | $1.29 | 43d | 1 | 0.46mi |
| 315 Story St Brookland, AR | 3.0 | 2.0 | 1250 | $1,270 | $1.02 | 43d | 1 | 1.06mi |
| 300 Story St Brookland, AR | 3.0 | 2.0 | 1200 | $1,270 | $1.06 | 43d | 1 | 1.11mi |
| 338 Story St Brookland, AR | 3.0 | 2.0 | 1250 | $1,270 | $1.02 | 43d | 1 | 1.11mi |
| 105 Cherry St Brookland, AR | 3.0 | 2.0 | 1170 | $1,575 | $1.35 | 43d | 1 | 1.26mi |
| 203 N Bernis St Brookland, AR | 3.0 | 2.0 | 1328 | $1,550 | $1.17 | 43d | 1 | 1.37mi |
Listing history 9 events
-
2026-05-08$229,900 Active 803-char remark
-
2026-01-19$239,900 Active
-
2025-06-23$239,900 Active
-
2022-11-18historical
-
2022-10-19$225,000
-
2022-10-19$225,000 New Listing
-
2016-12-01soldstatus $159,000
-
2016-11-11soldstatus $159,000
-
2016-07-18$159,000
ⓘ Source: listings_history table (triggers on properties + properties_extension) + one-shot
backfill from property_details.listing_events for pre-trigger history.
Tax reassessment forecast AR · Resets to sale price
- Current annual tax
- $1,557 · $130/mo
- Projected year-2 tax
- $1,557 · $130/mo
- Expected delta
- $0/yr ($0/mo · 0.0%)
ⓘ Screening estimate from a state-policy table — verify with the county assessor before closing.
Climate risk First Street
- Flood 1/10 Low FEMA zone X · 0% chance over 30 yrs
- Wildfire 3/10 Moderate
- Heat 6/10 Major 7 d/yr ≥110°F today · 22 d/yr by 30 yrs out
- Wind 4/10 Moderate 9% chance of damaging wind over 30 yrs
- Air quality 1/10 Low 0 unhealthy d/yr today · 0 by 30 yrs out
Nearby sold comps map
Loading sold comps map…
Walkable amenities ~0.75 mi
Loading nearby amenities…
Taxation est. · year 1
- Rental income
- $21,710
- − Mortgage interest
- −$12,878
- − Property taxes
- −$1,557
- − Insurance
- −$1,150
- − Repairs & maintenance
- −$1,737
- − Management
- −$1,737
- − Depreciation
- −$6,688
- Taxable loss
- −$4,036
- Est. tax savings @ 24.0%
- +$969
- After-tax cash flow
- $946/yr
For passive investors: Depreciation is non-cash, so a rental often shows a tax loss while cash-flowing — sheltering income. Rental losses are passive: they offset passive income freely, and up to $25,000/yr can offset ordinary (W-2) income if you actively participate and your MAGI is under $100k (phasing out to $0 by $150k); unused losses carry forward. On sale, claimed depreciation is recaptured at up to 25%, and gains may owe capital-gains tax (a 1031 exchange can defer both). Figures are a year-1 estimate at your 24.0% rate — not tax advice; consult a CPA.
Schools (NCES district)
- District
- Brookland School District
- NCES district ID
- 0503640
- Math proficiency
- 45% ▼ -15.00%
- Reading proficiency
- 39% ▼ -16.00%
- Median HH income
- $52,226
- Composite
- 36.4/100
- National rank
- #4678
- State rank
- #47 of 238 in AR
Livability — Brookland
- Score
- 70/100
- State rank
- #57
- US rank
- #7817
Category grades
Schools grade is shown separately in the Schools card above.
Census & demographics
- Census place
- Brookland, AR
- County
- Craighead County · 97,185 people
- City population
- 5,940
- Metro
- Jonesboro, AR
- Population (ZIP)
- 5,940
- Household income
- $61,964
- Rent vs Own
- Severe rent burden
- 152.0
Population outlook (Craighead County) Hauer SSP2
- Today (2025)
- 122,235 people
- By 2030
- 131,338 · +7.4%
- By 2040
- 149,862 · +22.6%
- By 2050
- 168,034 · +37.5%
- By 2075
- 208,094 · +70.2%
- By 2100
- 233,251 · +90.8%
Race, ethnicity, and origin ACS 2023
- Neighborhood character
- Predominantly White (91%)
- Race & ethnicity
- White 91% Two or more races 5% Black 2% Hispanic / Latino 2%
- Common ancestry
- Slovak 3% Italian 3%
- Foreign-born
- 1% · Canada, South Korea
Political lean MEDSL · Craighead
- 2024 margin
- Solid R (+37.4) · D 30.1% · R 67.5% · Other 2.4%
- 2008→2024 swing
- -12.9pp toward R · 2008: -24.5pp · 2024: -37.4pp
- All cycles
- 2024: R+37.4 2020: R+35.4 2016: R+35.2 2012: R+31.1 2008: R+24.5
Not yet ingested
- Civics
- —
Market trends
- HPI YoY
- ▲ 56.75%
- Current HPI
- 331.5025
- Rent YoY
- —
- Metro
- Jonesboro, AR
- State GDP YoY
- ▲ 3.80%
- F500 in state
- 10
Industry mix (Fortune 500 HQ in AR)
| Industry | F500 HQs | Revenue |
|---|---|---|
| Retail | 1 | $681B |
|
||
| Food / Agriculture | 1 | $53B |
|
||
| Retail / Energy | 1 | $22B |
|
||
| Transportation / Logistics | 1 | $12B |
|
||
| Energy | 1 | $4B |
|
||
Price history
+44.6% since first listed9 events — show timeline
- 2026-05-08 Listed $229,900 NEABOR MLS
- 2026-01-19 Listed $239,900 NEABOR MLS
- 2025-06-23 Listed $239,900 NEABOR MLS
- 2022-11-18 Listing Removed — CARMLS
- 2022-10-19 Listed $225,000 CARMLS
- 2022-10-19 Listed $225,000 NEABOR MLS
- 2016-12-01 Sold (Public Records) $159,000 Public Records
- 2016-11-11 Sold (MLS) $159,000 NEABOR MLS
- 2016-07-18 Listed $159,000 NEABOR MLS
Property tax history
+0.7%/yrLatest (2025): $1,557 · +0.0% YoY. Source: county tax records.
Cash-flow waterfall
monthlySold comps — $/sqft
last 12 mo · ≤1 miLoading sold comps…