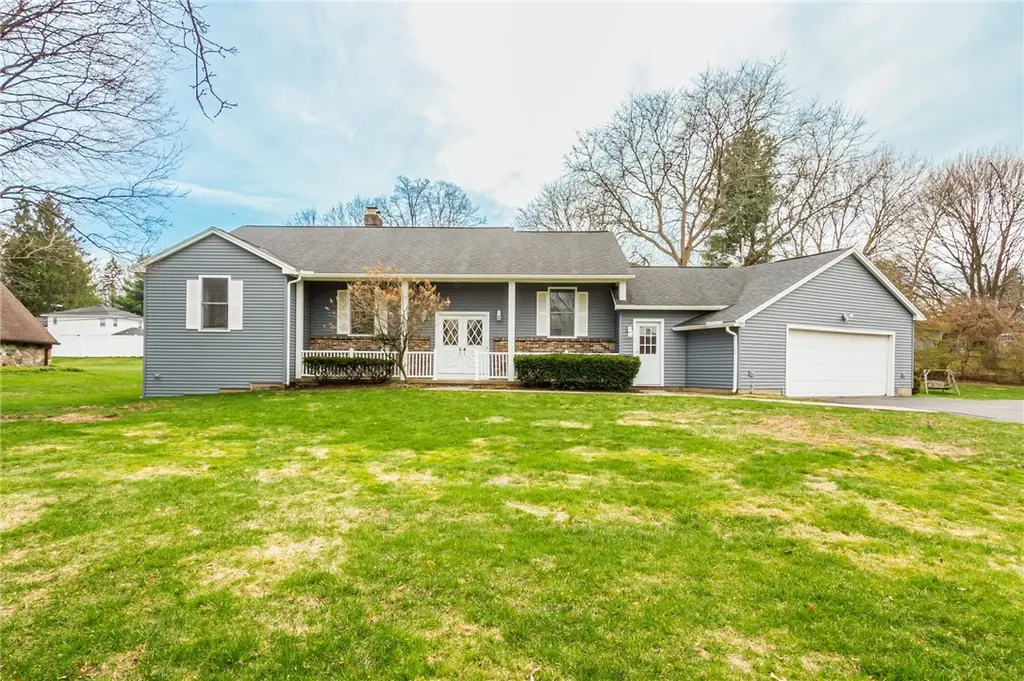
299 Fairport Rd · East Rochester, NY
Flood risk 1/10 · Minimal
- FEMA flood zone
- X (unshaded)
- Chance of flooding over 30 yrs
- 0.0%
- Est. flood insurance / yr
- $473 – $860
Fire risk 3/10 · Minor
- Est. fire insurance / yr
- $691 – $1,283
Heat risk 3/10 · Minor
- Hot days now (above 96°F)
- 7 days/yr
- Hot days in 30 yrs
- 16 days/yr
Wind risk 1/10 · Minimal
- Chance of severe wind over 30 yrs
- —
Air-quality risk 2/10 · Minimal
- Unhealthy air days now
- 1 days/yr
- Unhealthy air days in 30 yrs
- 2 days/yr
Risk factors via First Street. Map © Google.
Why this score? — see what drove the D+ grade
The composite is a weighted blend of 9 inputs, each scored 0–100. Each bar is that input's sub-score; the figure is the points it added to the 100-point composite (weight × sub-score).
- ARV discount +15.0/15.0
- Cash flow +13.1/30.0
- Schools +4.3/10.0
- DSCR +3.9/10.0
- Livability +3.9/5.0
- 1% rule +3.7/10.0
- Rent growth +2.5/5.0
- Condition / age +2.5/5.0
- Appreciation +0.0/10.0
$289,000
🖨 Deal sheet (PDF) 📄 Offer letter ✓ Due diligence
Listing remarks
Welcome to this spacious raised ranch on nearly an acre in the Town of Pittsford with East Rochester schools! This 6-bedroom, 3 full bath home offers a versatile layout and great potential to make it your own. The beautifully updated kitchen features granite countertops, abundant cabinetry, and ample storage, & opens to the large dining area with a sliding glass door leading to the deck—perfect for indoor-outdoor entertaining. The dining space flows into a bright and inviting great room. All four bedrooms are generously sized, providing comfort and flexibility. The lower level includes a sizable family room, plus a flexible space with built-in cabinetry and desk—ideal for a
Key facts
- Sliding glass door
- Updated kitchen
- Abundant cabinetry
Tags
Neighborhood map
What this means for you Summary
Snapshot
- This is a 4-bed/3.0-bath single-family listed at $289k.
Deal economics
- At list price, monthly cash flow is $-13 ($-153/yr) — negative.
- To cash-flow at today's rent, offer at most $287k (0.6% below list).
- To meet the 1% rule (rent ≥ 1% of price), the offer needs to be $251k (13.1% below list).
- Recommended offer: $251k (13.1% below list) — sets the bar for 1% rule.
- Cap rate 6.2% vs local median 4.5% in East Rochester — top-decile yield for the area; either an underpriced asset or a hidden risk that comps aren't pricing in. Stress-test before assuming the spread holds.
Location & tenants
- Location reads 78/100 on livability (#155 in NY, #2,400 nationally) — a middle-class / working-renter tenant base. Strengths: amenities A+, cost of living A+, housing A+; Watch: employment D+, crime D.
- East Rochester Union Free School District (suburban): math 50% / reading 51% proficiency, ranked #371 of 590 in NY (top 63%) — acceptable for families but not a draw, mixed tenant base, ~2y average lease.
- Zoned schools: East Rochester Elementary School (math 42% / reading 57%, grade D, #1,085 of 2,108 statewide, top 56%, 458 students, 48% FRL); East Rochester Junior-Senior High School (math 57% / reading 47%, grade D+, #946 of 1,100 statewide, top 88%, 515 students, 51% FRL).
- Market conditions: 34 active listings in the ZIP; 1 comparable units currently listed for rent nearby; 1,169 units permitted in Monroe County in 2024 (591 in 5+ unit buildings).
- This rent runs 41% of the median local income ($74k/yr) — at the standard rent-burdened threshold; future hikes will face affordability resistance.
Forward outlook
- Local home prices are declining (-3.0%/yr); year-one equity from $2k of loan paydown is wiped out by about $9k of value loss. Plan a longer hold.
- Monroe County population projected to shrink 6% by 2050 — rents likely to lag national; underwrite the cash flow, not the appreciation.
Negotiation context
- Only 7 days on market — expect competitive offers; lowballing is unlikely to land.
- Current owner paid $165k; list at $289k implies a 75% gain — meaningful room to come down on a strong offer.
Questions for the listing agent
- What do current leases actually rent for vs. the listed asking? Can we see a recent rent roll and the last 12 months of T-12 income?
- Built in 1979 — when were the roof, HVAC, electrical panel, plumbing, and water heater last replaced?
- Is there a deadline driving the sale (1031 exchange, divorce, estate, relocation)? That informs how much negotiation room exists.
- Schools are A-rated — typically a magnet for longer-tenancy family renters. What's the average tenant stay here, and is there a school-zone premium baked into asking?
- Crime grade is D in this area — have there been break-ins, vandalism, or insurance claims at this property in the last 3 years? What carrier currently insures it and at what premium?
- The area grade is low — what's the realistic commute time and amenity access for the typical tenant pool here? Any planned neighborhood developments (good or bad) we should know about?
- What's the average days-on-market for RENTAL listings here right now (not sales)? A rising rental-DOM trend means longer vacancies and softer asking-rent achievability than the comps imply.
- What's the recent tenant-quality profile in this submarket — average credit score on applications, eviction rate, late-payment / NSF rate, and stable-employment percentage? A property-management company in the area should have these aggregated.
- How much new for-sale + rental construction is in the pipeline within 1–3 miles? Heavy new supply typically softens prices + rents 12–24 months out; constrained supply supports both.
Investment metrics
- 1% rule
- 0.87% ✗
- Cap rate
- 6.24%
- Cash-on-cash
- -0.19%
- DSCR
- 0.99
- GRM
- 9.6
CMA / ARV
- ARV (on-the-fly)
- $486,300
- Comps found
- 5
Show comp detail 5 sales within ~0.75 mi
| Address | Dist | Beds/Ba | Sqft | Sold | Price | $/sf | Match |
|---|---|---|---|---|---|---|---|
| 3 Tuxford Rd | 0.24mi | 4/3.0 | 2,948 (-9%) | 10mo | $555,000 | $188 | 65 |
| 901 Main St | 0.33mi | 5/4.5 (+1) | 3,200 (-1%) | 10mo | $289,000 | $90 | 63 |
| 59 Callingham Rd | 0.19mi | 3/2.5 (-1) | 2,840 (-12%) | 3mo | $425,000 | $150 | 61 |
| 114 W Ivy St | 0.31mi | 5/3.0 (+1) | 3,237 (-0%) | 24mo | $345,000 | $107 | 61 |
| 46 Oak Manor Ln | 0.56mi | 4/2.5 | 2,756 (-15%) | 21mo | $429,900 | $156 | 29 |
Match score weights: distance 35% · size 25% · config 20% · recency 20%. Top-matched comps best support the ARV.
Projected returns pro-forma
-3.0% appreciation · 3.0% rent growth · sell at horizon
- IRR
- -16.6%
- Equity multiple
- 0.41×
- Total profit
- $-47,605
- Equity at exit
- $43,091
- IRR
- -8.4%
- Equity multiple
- 0.48×
- Total profit
- $-42,345
- Equity at exit
- $24,987
Cash invested: $80,920 (down + closing). Projections, not guarantees.
Landlord ↔ Tenant lean methodology
- Overall (STATE)
- 15 Strongly Tenant-Friendly
- State New York
- 15 Strongly Tenant-Friendly · D+10
- County
- — inherits STATE
- City
- — inherits STATE
ZIP-level market 14445
- Home prices YoY
- -9.5%
- Active inventory
- 34
- Price-to-rent
- 9.6×
Monthly cashflow live
- Estimated rent
- $2,512 medium interval (Pro) →
- Mortgage (P&I)
- −$1,516
- Tax est. 1.5%
- −$361 /mo · $4,335/yr
- Insurance
- −$120
- HOA
- −$0
- Vacancy / Maint / Mgmt
- −$528
- Net cashflow
- $-13
Break-even live
Sensitivity live
| Price | -10% $187 | -5% $87 | +0% $-13 | +5% $-113 | +10% $-212 |
|---|---|---|---|---|---|
| Rent | -10% $-211 | -5% $-112 | +0% $-13 | +5% $86 | +10% $186 |
| Rate | -1.0pp $133 | -0.5pp $61 | base $-13 | +0.5pp $-88 | +1.0pp $-164 |
UW: 25.0% down · 7.5% · 30yr · 1.5% tax · 5.0% vac · 8.0% maint · 8.0% mgmt
Financing live
Cash to close
- Down payment
- $72,250
- Closing costs
- $8,670
- Reserves months
- —
- Total cash needed
- —
Loan-product check · same deal, 3 products live
Conventional
25% down · 7.5% · 30yr
- Down + closing
- —
- Monthly P&I
- —
- Monthly cashflow
- —
- DSCR
- —
- Eligible?
- —
Personal DTI + credit; lowest rate.
DSCR
20% down · 8.5% · 30yr
- Down + closing
- —
- Monthly P&I
- —
- Monthly cashflow
- —
- DSCR
- —
- Eligible?
- —
No personal income docs; deal must DSCR.
Hard money
10% down · 12.0% · 12mo
- Down + closing
- —
- Monthly P&I
- —
- Monthly cashflow
- —
- DSCR
- —
- Eligible?
- —
Short-term bridge; refi at stabilization.
Rent comps 1 comps
| Address | Beds | Baths | Sqft | Rent | $/sqft | DOM | Units | Dist |
|---|---|---|---|---|---|---|---|---|
| 1253 Fairport Rd Fairport, NY | 3.0 | 2.0 | 2194 | $2,500 | $1.14 | 4d | 1 | 1.48mi |
Listing history 3 events
-
2026-04-21status Pending
-
2026-04-14$289,000 Active
-
1998-12-03soldstatus $164,900
ⓘ Source: listings_history table (triggers on properties + properties_extension) + one-shot
backfill from property_details.listing_events for pre-trigger history.
Climate risk First Street
- Flood 1/10 Low FEMA zone X (unshaded) · 0% chance over 30 yrs
- Wildfire 3/10 Moderate
- Heat 3/10 Moderate 7 d/yr ≥96°F today · 16 d/yr by 30 yrs out
- Wind 1/10 Low
- Air quality 2/10 Low 1 unhealthy d/yr today · 2 by 30 yrs out
Nearby sold comps map
Loading sold comps map…
Walkable amenities ~0.75 mi
Loading nearby amenities…
Taxation est. · year 1
- Rental income
- $30,144
- − Mortgage interest
- −$16,188
- − Property taxes
- −$4,335
- − Insurance
- −$1,445
- − Repairs & maintenance
- −$2,412
- − Management
- −$2,412
- − Depreciation
- −$8,407
- Taxable loss
- −$5,055
- Est. tax savings @ 24.0%
- +$1,213
- After-tax cash flow
- $1,060/yr
For passive investors: Depreciation is non-cash, so a rental often shows a tax loss while cash-flowing — sheltering income. Rental losses are passive: they offset passive income freely, and up to $25,000/yr can offset ordinary (W-2) income if you actively participate and your MAGI is under $100k (phasing out to $0 by $150k); unused losses carry forward. On sale, claimed depreciation is recaptured at up to 25%, and gains may owe capital-gains tax (a 1031 exchange can defer both). Figures are a year-1 estimate at your 24.0% rate — not tax advice; consult a CPA.
Schools (NCES district)
- District
- East Rochester Union Free School District
- NCES district ID
- 3609930
- Math proficiency
- 50% ▼ -16.00%
- Reading proficiency
- 51% ▲ 5.00%
- Median HH income
- $50,308
- Composite
- 43.23/100
- National rank
- #3058
- State rank
- #371 of 590 in NY
Livability — East Rochester
- Score
- 78/100
- State rank
- #155
- US rank
- #2400
Category grades
Schools grade is shown separately in the Schools card above.
Census & demographics
- County
- Monroe County · 674,131 people
- City population
- 7,529
- Metro
- Rochester, NY
- Population (ZIP)
- 7,529
- Household income
- $73,625
- Rent vs Own
- Severe rent burden
- 216.0
Population outlook (Monroe County) Hauer SSP2
- Today (2025)
- 759,460 people
- By 2030
- 757,154 · -0.3%
- By 2040
- 740,644 · -2.5%
- By 2050
- 714,443 · -5.9%
- By 2075
- 645,883 · -15.0%
- By 2100
- 547,084 · -28.0%
Race, ethnicity, and origin ACS 2023
- Neighborhood character
- Predominantly White (88%)
- Race & ethnicity
- White 88% Hispanic / Latino 6% Black 3% Two or more races 3%
- Hispanic origin (detail)
- Puerto Rican 3%
- Common ancestry
- Romanian 4% Portuguese 2% Lithuanian 2%
- Foreign-born
- 4% · Canada
- Languages at home
- 96% English-only · Spanish 2% Other Indo-European 1% Tagalog/Filipino 1%
Political lean MEDSL · Monroe
- 2024 margin
- D (+19.1) · D 59.5% · R 40.5%
- 2008→2024 swing
- +1.4pp toward D · 2008: 17.7pp · 2024: 19.1pp
- All cycles
- 2024: D+19.1 2020: D+21.0 2016: D+14.1 2012: D+17.4 2008: D+17.7
Not yet ingested
- Civics
- —
Market trends
- HPI YoY
- ▼ -28.80%
- Current HPI
- 273.7033
- Rent YoY
- —
- Metro
- Rochester, NY
- State GDP YoY
- ▲ 2.60%
- F500 in state
- 92
Industry mix (Fortune 500 HQ in NY)
| Industry | F500 HQs | Revenue |
|---|---|---|
| Financial Services | 10 | $950B |
|
||
| Consumer Goods | 9 | $162B |
|
||
| Insurance | 4 | $225B |
|
||
| Telecommunications | 2 | $144B |
|
||
| Pharmaceuticals | 2 | $112B |
|
||
| Media / Entertainment | 2 | $69B |
|
||
Price history
+75.3% since first listed3 events — show timeline
- 2026-04-21 Pending — UNYREIS
- 2026-04-14 Listed $289,000 UNYREIS
- 1998-12-03 Sold (Public Records) $164,900 Public Records
Property tax history
+4.8%/yrLatest (2025): $199 · +0.0% YoY. Source: county tax records.
Cash-flow waterfall
monthlySold comps — $/sqft
last 12 mo · ≤1 miLoading sold comps…