 6-Plex
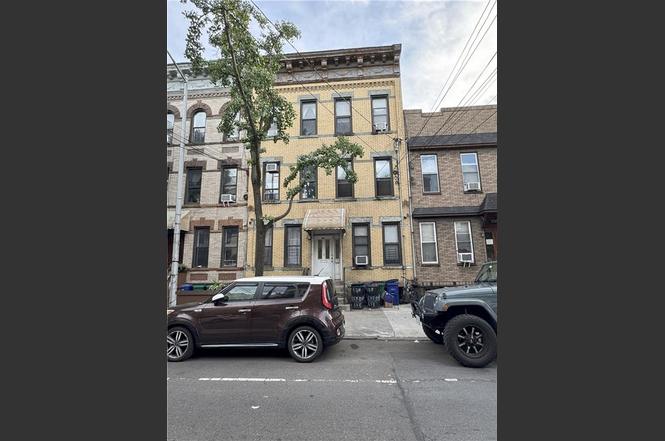
508 Onderdonk Ave · New York, NY
Flood risk 1/10 · Minimal
- FEMA flood zone
- X (unshaded)
- Chance of flooding over 30 yrs
- 0.0%
- Est. flood insurance / yr
- $507 – $1,088
Fire risk 1/10 · Minimal
- Est. fire insurance / yr
- $691 – $1,283
Heat risk 6/10 · Moderate
- Hot days now (above 99°F)
- 7 days/yr
- Hot days in 30 yrs
- 14 days/yr
Wind risk 6/10 · Moderate
- Chance of severe wind over 30 yrs
- 40.0%
Air-quality risk 5/10 · Moderate
- Unhealthy air days now
- 6 days/yr
- Unhealthy air days in 30 yrs
- 8 days/yr
Risk factors via First Street. Map © Google.
Why this score? — see what drove the C grade
The composite is a weighted blend of 9 inputs, each scored 0–100. Each bar is that input's sub-score; the figure is the points it added to the 100-point composite (weight × sub-score).
- Cash flow +24.1/30.0
- DSCR +7.8/10.0
- ARV discount +7.5/15.0
- 1% rule +5.5/10.0
- Schools +5.0/10.0
- Livability +3.8/5.0
- Rent growth +3.7/5.0
- Condition / age +2.5/5.0
- Appreciation +0.0/10.0
$1,799,000
🖨 Deal sheet (PDF) 📄 Offer letter ✓ Due diligence
Multi-family units
County records classify this as Multi-Family (5+ Unit). Listing-text estimate: 6 units. confirmed
5+ unit building — per-unit beds/baths from public records are typically unavailable; the breakdown below (if shown) is an estimate from the listing text.
Listing remarks
Let us presents an exceptional investment opportunity in the heart of Ridgewood. This six-family building is comprised of six spacious two-bedroom, one-bathroom apartments, each designed with functional layouts that maximize living space and natural light. The property offers investors strong income potential with stable tenancy and a desirable unit mix that appeals to a wide range of renters. Each apartment features comfortable living areas, well-proportioned bedrooms, and classic finishes that provide both practicality and charm. With its solid construction and well-maintained condition, this building is ideal for long-term ownership or value-add strategies. The configuration of multiple
Key facts
- 2,500 sq ft lot
- Built 1930
- Listed 304 days
Property features AI
Finance
- Other: Estimated utility expense listed
- Financial info: Rental income reported (45240); Financing options: exchange considered, bank mortgage, or cash
Exterior
- Parking: No parking
- Security: Secure lobby
- Utilities: Hot water by gas; Heating fuel: gas; Electric: 110V
- Home design: Attached building; Residential property; Zoned R6B
- Construction: Block construction; Brick exterior; Asphalt/tar roof; Block foundation
- Exterior features: Back yard
Interior
- Kitchen: Units include microwave, refrigerator and stove
- Bedrooms: Six 2-bedroom units (two on each floor across three floors); Each unit has 2 bedrooms
- Flooring: Hardwood floors; Tile floors
- Bathrooms: Six full bathrooms total (one full bath per unit)
- Heating & cooling: Gas heating delivered by hot air; 110V electric service
- Interior features: Window A/C units; Microwave; Refrigerator; Stove; Finished basement
Neighborhood map
What this means for you Summary
Snapshot
- This is a 6 × 2-bed/1.0-bath units multifamily listed at $1.80M.
Deal economics
- At list price, monthly cash flow is $4k ($43k/yr) — positive. Per door: $592/mo.
- The deal already cash-flows at list — no discount required.
- Meets the 1% rule at list price ($19k rent vs $1.80M).
- Recommended offer: $1.58M (12.0% below list) — sets the bar for market timing.
- Cap rate 8.7% vs local median 2.6% in New York — top-decile yield for the area; either an underpriced asset or a hidden risk that comps aren't pricing in. Stress-test before assuming the spread holds.
Location & tenants
- Location reads 75/100 on livability (#268 in NY, #4,188 nationally) — a middle-class / working-renter tenant base. Strengths: amenities A+, commute A+, health & safety A; Watch: crime F, cost of living F.
- Zoned schools: Elm Tree Elementary School (math 27% / reading 52%, grade F, #1,444 of 2,108 statewide, top 71%, 806 students, 94% FRL); Is 227 Louis Armstrong (math 52% / reading 69%, grade B+, #153 of 729 statewide, top 21%, 1,528 students, 68% FRL); Midwood High School (math 94% / reading 96%, grade A+, #83 of 1,100 statewide, top 8%, 4,062 students, 73% FRL).
- Market conditions: Rents rising fast (+5.0%/yr); 214 active listings in the ZIP; solid renter incomes; 5,302 units permitted in Queens County in 2024 (4,918 in 5+ unit buildings).
- At $18,900/mo this rent would consume 255% of the median local household income ($89k/yr) (locally 5525% of renters already pay >50% of income on rent) — very limited rent-growth headroom before tenants either downsize or default.
Forward outlook
- Local home prices are declining (-3.0%/yr); year-one equity from $12k of loan paydown is wiped out by about $54k of value loss. Plan a longer hold.
- Queens County population projected at +16% by 2050 — long-run rental-demand tailwind backs the buy-and-hold thesis.
- At projected returns (-3.0% appreciation + 5.0% rent growth), your $504k cash investment doubles in ~10 years — after that, you're playing with house money.
Negotiation context
- It's been on market 304 days — a 12% lower offer ($1.58M) is reasonable based on typical stale-listing flexibility.
- Current owner paid $447k; list at $1.80M implies a 302% gain — meaningful room to come down on a strong offer.
Risks & watch-outs
- Watch-outs: built in 1930 — expect roof / HVAC / electrical / plumbing capex.
- Climate carrying-cost: major wind risk, 40% chance of damaging wind over 30y; extreme-heat days projected 7→14/yr by 2055 (HVAC capex compounding) — expect insurance premiums to compound above CPI over the hold.
Questions for the listing agent
- It's been on market 304 days. Have you received any prior offers? Is the seller open to a 12% concession, seller financing, or rate buy-down credit?
- Can we see the unit-by-unit rent roll, current vacancy, and any below-market leases? What's the average tenancy length?
- What capital expenditures (roof, boiler, parking lot, exteriors) have been made in the last 5 years, and what's planned in the next 2?
- Built in 1930 — when were the roof, HVAC, electrical panel, plumbing, and water heater last replaced?
- Why hasn't it sold? Are there any deal-killer items the seller is aware of (foundation, flood, title, zoning, code violations)?
- Is there a deadline driving the sale (1031 exchange, divorce, estate, relocation)? That informs how much negotiation room exists.
- Schools are B-rated — typically a magnet for longer-tenancy family renters. What's the average tenant stay here, and is there a school-zone premium baked into asking?
- Crime grade is F in this area — have there been break-ins, vandalism, or insurance claims at this property in the last 3 years? What carrier currently insures it and at what premium?
- What's the average days-on-market for RENTAL listings here right now (not sales)? A rising rental-DOM trend means longer vacancies and softer asking-rent achievability than the comps imply.
- What's the recent tenant-quality profile in this submarket — average credit score on applications, eviction rate, late-payment / NSF rate, and stable-employment percentage? A property-management company in the area should have these aggregated.
- How much new apartment / multifamily construction is in the pipeline within 1–3 miles? Heavy new supply (>2% of stock underway) typically softens rents 12–24 months out; light construction supports rent growth.
Investment metrics
- 1% rule
- 1.05% ✓
- Cap rate
- 8.66%
- Cash-on-cash
- 8.46%
- DSCR
- 1.38
- GRM
- 7.9
CMA / ARV
No comps found within radius.
Projected returns pro-forma
-3.0% appreciation · 4.97% rent growth · sell at horizon
- IRR
- -1.4%
- Equity multiple
- 0.95×
- Total profit
- $-27,545
- Equity at exit
- $268,237
- IRR
- 10.1%
- Equity multiple
- 1.85×
- Total profit
- $428,918
- Equity at exit
- $155,545
Cash invested: $503,720 (down + closing). Projections, not guarantees.
Landlord ↔ Tenant lean methodology
- Overall (CITY)
- 0 Strongly Tenant-Friendly
- State New York
- 15 Strongly Tenant-Friendly · D+10
- County
- — inherits STATE
- City New York
- 0 Strongly Tenant-Friendly · D+34
ZIP-level market 11385
- Rents YoY
- 5.0%
- Active inventory
- 214
- Price-to-rent
- 47.6×
Monthly cashflow live
- Estimated rent
- $18,900 high interval (Pro) →
- Mortgage (P&I)
- −$9,434
- Tax from tax record
- −$1,197 /mo · $14,361/yr
- Insurance
- −$750
- HOA
- −$0
- Lot rent
- −$0
- Vacancy / Maint / Mgmt
- −$3,969
- Net cashflow
- $3,551
Break-even live
Sensitivity live
| Price | -10% $4,569 | -5% $4,060 | +0% $3,551 | +5% $3,041 | +10% $2,532 |
|---|---|---|---|---|---|
| Rent | -10% $2,057 | -5% $2,804 | +0% $3,551 | +5% $4,297 | +10% $5,044 |
| Rate | -1.0pp $4,457 | -0.5pp $4,008 | base $3,551 | +0.5pp $3,084 | +1.0pp $2,610 |
6-unit breakdown (identical units grouped — click to expand)
| Units | Beds | Baths | Est. rent |
|---|---|---|---|
| 6× units | 2 | 1 | $18,900 |
| #1 | 2 | 1 | $3,150 |
| #2 | 2 | 1 | $3,150 |
| #3 | 2 | 1 | $3,150 |
| #4 | 2 | 1 | $3,150 |
| #5 | 2 | 1 | $3,150 |
| #6 | 2 | 1 | $3,150 |
| Total (6 units) | $18,900 | ||
UW: 25.0% down · 7.5% · 30yr · 1.5% tax · 5.0% vac · 8.0% maint · 8.0% mgmt
Financing live
Cash to close
- Down payment
- $449,750
- Closing costs
- $53,970
- Reserves months
- —
- Total cash needed
- —
Loan-product check · same deal, 3 products live
Conventional
25% down · 7.5% · 30yr
- Down + closing
- —
- Monthly P&I
- —
- Monthly cashflow
- —
- DSCR
- —
- Eligible?
- —
Personal DTI + credit; lowest rate.
DSCR
20% down · 8.5% · 30yr
- Down + closing
- —
- Monthly P&I
- —
- Monthly cashflow
- —
- DSCR
- —
- Eligible?
- —
No personal income docs; deal must DSCR.
Hard money
10% down · 12.0% · 12mo
- Down + closing
- —
- Monthly P&I
- —
- Monthly cashflow
- —
- DSCR
- —
- Eligible?
- —
Short-term bridge; refi at stabilization.
Listing history 16 events
-
2026-06-22days on market $1,799,000 Active 304 DOM
-
2026-06-21days on market $1,799,000 Active 303 DOM
-
2026-06-18days on market $1,799,000 Active 300 DOM
-
2026-06-17days on market $1,799,000 Active 299 DOM
-
2026-06-15days on market $1,799,000 Active 297 DOM
-
2026-06-13days on market $1,799,000 Active 295 DOM
-
2026-06-10days on market $1,799,000 Active 291 DOM
-
2026-06-08days on market $1,799,000 Active 290 DOM
-
2026-06-03days on market $1,799,000 Active 285 DOM
-
2026-06-01days on market $1,799,000 Active 283 DOM
-
2026-05-31days on market $1,799,000 Active 282 DOM
-
2025-08-22$1,799,000 Active
-
2025-08-17price $1,799,000
-
2002-10-18soldstatus $447,000
-
1989-04-27soldstatus $195,000
-
1986-03-21soldstatus $148,000
ⓘ Source: listings_history table (triggers on properties + properties_extension) + one-shot
backfill from property_details.listing_events for pre-trigger history.
Tax reassessment forecast NY · Partial reset (capped growth)
- Current annual tax
- $14,361 · $1,197/mo
- Projected year-2 tax
- $22,382 · $1,865/mo
- Expected delta
- +$8,021/yr (+$668/mo · 55.9%)
ⓘ Screening estimate from a state-policy table — verify with the county assessor before closing.
Climate risk First Street
- Flood 1/10 Low FEMA zone X (unshaded) · 0% chance over 30 yrs
- Wildfire 1/10 Low
- Heat 6/10 Major 7 d/yr ≥99°F today · 14 d/yr by 30 yrs out
- Wind 6/10 Major 40% chance of damaging wind over 30 yrs
- Air quality 5/10 Major 6 unhealthy d/yr today · 8 by 30 yrs out
Nearby sold comps map
Loading sold comps map…
Walkable amenities ~0.75 mi
Loading nearby amenities…
Taxation est. · year 1
- Rental income
- $226,800
- − Mortgage interest
- −$100,772
- − Property taxes
- −$14,361
- − Insurance
- −$8,995
- − Repairs & maintenance
- −$18,144
- − Management
- −$18,144
- − Depreciation
- −$52,335
- Taxable income
- $14,050
- Est. tax owed @ 24.0%
- −$3,372
- After-tax cash flow
- $39,234/yr
For passive investors: Depreciation is non-cash, so a rental often shows a tax loss while cash-flowing — sheltering income. Rental losses are passive: they offset passive income freely, and up to $25,000/yr can offset ordinary (W-2) income if you actively participate and your MAGI is under $100k (phasing out to $0 by $150k); unused losses carry forward. On sale, claimed depreciation is recaptured at up to 25%, and gains may owe capital-gains tax (a 1031 exchange can defer both). Figures are a year-1 estimate at your 24.0% rate — not tax advice; consult a CPA.
Schools (NCES district)
No district data.
Livability — New York
- Score
- 75/100
- State rank
- #268
- US rank
- #4188
Category grades
Schools grade is shown separately in the Schools card above.
Census & demographics
- Census place
- New York, NY
- County
- Queens County · 1,914,869 people
- City population
- 7,731,280
- Metro
- New York-Newark-Jersey City, NY-NJ-PA
- Population (ZIP)
- 101,704
- Household income
- $88,838
- Rent vs Own
- Severe rent burden
- 5525.0
Population outlook (Queens County) Hauer SSP2
- Today (2025)
- 2,546,320 people
- By 2030
- 2,643,059 · +3.8%
- By 2040
- 2,815,563 · +10.6%
- By 2050
- 2,944,423 · +15.6%
- By 2075
- 3,123,338 · +22.7%
- By 2100
- 3,098,688 · +21.7%
Race, ethnicity, and origin ACS 2023
- Neighborhood character
- Diverse neighborhood (Simpson 0.61)
- Race & ethnicity
- Hispanic / Latino 45% White 43% Two or more races 17% Asian 7% Black 3%
- Hispanic origin (detail)
- Mexican 4% Puerto Rican 12% Dominican 8%
- Common ancestry
- Romanian 7% Scandinavian 1% Subsaharan African 1%
- Foreign-born
- 39% · Canada, Jamaica, China
- Languages at home
- 42% English-only · Spanish 34% Russian/Polish/Slavic 9% Other Indo-European 8%
Political lean MEDSL · Queens
- 2024 margin
- Strong D (+24.6) · D 62.3% · R 37.7%
- 2008→2024 swing
- -26.2pp toward R · 2008: 50.8pp · 2024: 24.6pp
- All cycles
- 2024: D+24.6 2020: D+45.2 2016: D+53.4 2012: D+58.5 2008: D+50.8
Not yet ingested
- Civics
- —
Market trends
- HPI YoY
- ▼ -213.55%
- Current HPI
- 300.9364
- Rent YoY
- ▲ 4.97%
- Metro
- New York-Newark-Jersey City, NY-NJ-PA
- State GDP YoY
- ▲ 2.60%
- F500 in state
- 92
Industry mix (Fortune 500 HQ in NY)
| Industry | F500 HQs | Revenue |
|---|---|---|
| Financial Services | 10 | $950B |
|
||
| Consumer Goods | 9 | $162B |
|
||
| Insurance | 4 | $225B |
|
||
| Telecommunications | 2 | $144B |
|
||
| Pharmaceuticals | 2 | $112B |
|
||
| Media / Entertainment | 2 | $69B |
|
||
Price history
+1115.5% since first listed5 events — show timeline
- 2025-08-22 Listed $1,799,000 BNYMLS
- 2025-08-17 Price Changed $1,799,000 BNYMLS
- 2002-10-18 Sold (Public Records) $447,000 Public Records
- 1989-04-27 Sold (Public Records) $195,000 Public Records
- 1986-03-21 Sold (Public Records) $148,000 Public Records
Property tax history
+5.8%/yrLatest (2025): $14,361 · -0.9% YoY. Source: county tax records.
Cash-flow waterfall
monthlySold comps — $/sqft
last 12 mo · ≤1 miLoading sold comps…