115-117 Spring St · Springville, NY
Flood risk 1/10 · Minimal
- FEMA flood zone
- X (unshaded)
- Chance of flooding over 30 yrs
- 0.0%
- Est. flood insurance / yr
- $473 – $860
Fire risk 1/10 · Minimal
- Est. fire insurance / yr
- $691 – $1,283
Heat risk 1/10 · Minimal
- Hot days now (above 91°F)
- 7 days/yr
- Hot days in 30 yrs
- 16 days/yr
Wind risk 1/10 · Minimal
- Chance of severe wind over 30 yrs
- —
Air-quality risk 2/10 · Minimal
- Unhealthy air days now
- 0 days/yr
- Unhealthy air days in 30 yrs
- 1 days/yr
Risk factors via First Street. Map © Google.
Why this score? — see what drove the D+ grade
The composite is a weighted blend of 9 inputs, each scored 0–100. Each bar is that input's sub-score; the figure is the points it added to the 100-point composite (weight × sub-score).
- ARV discount +15.0/15.0
- Cash flow +13.3/30.0
- Schools +4.3/10.0
- DSCR +4.0/10.0
- Livability +3.8/5.0
- 1% rule +3.7/10.0
- Rent growth +2.5/5.0
- Condition / age +2.2/5.0
- Appreciation +0.0/10.0
$134,900
🖨 Deal sheet 📄 Offer letter ✓ Due diligence
Listing remarks MLS
Currently utilized as a single-family home, this property offers excellent potential to easily convert back to a duplex for added income opportunities. Conveniently located in the Village of Springville, close to Bertrand Chaffee Hospital, downtown shops, restaurants, and everyday conveniences. The home is currently set up as a spacious 4 bedroom, 1.5 bath residence featuring a first-floor laundry area, office space, blacktop driveway, and a good-sized backyard. Updates include a roof completed in 2010 and some vinyl replacement windows installed in 2002. With solid space, flexible possibilities, and plenty of potential, this property is a great opportunity for an owner occupant or investor ready to add their personal touch and build equity! See ML R1683334 for Single Family listing.
Key facts
- Blacktop driveway
- Office space
- Good-sized backyard
Tags
Property features AI
Exterior
- Parking: No garage; Shared driveway
- Utilities: Public water (connected); Sewer connected; Electric with fuses
- Home design: 2-story existing home; Poured foundation; Asphalt roof
- Construction: Poured foundation; Asphalt roof; Construction details: see remarks
- Exterior features: Blacktop driveway; City street frontage; Rectangular residential lot (approximately 0.3788 acres; 50 x 330)
Interior
- Kitchen: Gas oven; Gas range; Eat-in kitchen
- Bedrooms: One main-level bedroom; Second-floor bedrooms (three additional bedrooms)
- Flooring: Carpet; Hardwood; Laminate; Varies
- Bathrooms: One full bathroom; One half bathroom; One main-level bathroom
- Heating & cooling: Gas forced-air heating
- Interior features: Separate/formal dining room; Eat-in kitchen; Separate/formal living room; Natural woodwork; Bedroom on main level; Full basement
- Laundry & utility: Main-level laundry; Washer; Dryer; Gas water heater
Neighborhood map
What this means for you Summary
Snapshot
- This is a 4-bed/1.5-bath single-family listed at $135k. Condition is rated fair.
Deal economics
- At list price, monthly cash flow is $0 ($-3/yr) — negative.
- To cash-flow at today's rent, offer at most $135k (0.0% below list).
- To meet the 1% rule (rent ≥ 1% of price), the offer needs to be $118k (12.5% below list).
- Recommended offer: $118k (12.5% below list) — sets the bar for 1% rule.
- Cap rate 6.3% vs local median 2.2% in Springville — top-decile yield for the area; either an underpriced asset or a hidden risk that comps aren't pricing in. Stress-test before assuming the spread holds.
Location & tenants
- Location reads 76/100 on livability (#213 in NY, #3,281 nationally) — a middle-class / working-renter tenant base. Strengths: housing A+, health & safety A+, cost of living A; Watch: employment D+, commute F.
- Springville-Griffith Institute Central School District (town): math 47% / reading 52% proficiency, ranked #385 of 590 in NY (top 65%) — families likely to look elsewhere, expect single-tenant / working-renter base with shorter leases.
- Market conditions: 39 active listings in the ZIP; 1,244 units permitted in Erie County in 2024 (563 in 5+ unit buildings).
Forward outlook
- Local home prices are declining (-3.0%/yr); year-one equity from $933 of loan paydown is wiped out by about $4k of value loss. Plan a longer hold.
Negotiation context
- It's been on market 17 days — a 2% lower offer ($133k) is reasonable based on typical stale-listing flexibility.
- 2 sale attempts with the ask held roughly flat each time — persistent listings suggest the price (not the market) is what's stuck; bring a comps-based counter.
Risks & watch-outs
- Watch-outs: built in 1930 — expect roof / HVAC / electrical / plumbing capex.
Questions for the listing agent
- What do current leases actually rent for vs. the listed asking? Can we see a recent rent roll and the last 12 months of T-12 income?
- Have any recent inspections been done? Can we get a copy of the seller's disclosures and any deferred-maintenance estimates?
- Built in 1930 — when were the roof, HVAC, electrical panel, plumbing, and water heater last replaced?
- Is there a deadline driving the sale (1031 exchange, divorce, estate, relocation)? That informs how much negotiation room exists.
- Schools are B-rated — typically a magnet for longer-tenancy family renters. What's the average tenant stay here, and is there a school-zone premium baked into asking?
- The area grade is low — what's the realistic commute time and amenity access for the typical tenant pool here? Any planned neighborhood developments (good or bad) we should know about?
- What's the average days-on-market for RENTAL listings here right now (not sales)? A rising rental-DOM trend means longer vacancies and softer asking-rent achievability than the comps imply.
- What's the recent tenant-quality profile in this submarket — average credit score on applications, eviction rate, late-payment / NSF rate, and stable-employment percentage? A property-management company in the area should have these aggregated.
- How much new for-sale + rental construction is in the pipeline within 1–3 miles? Heavy new supply typically softens prices + rents 12–24 months out; constrained supply supports both.
Investment metrics
- 1% rule
- 0.87% ✗
- Cap rate
- 6.29%
- Cash-on-cash
- -0.01%
- DSCR
- 1.00
- GRM
- 9.5
CMA / ARV
- ARV (on-the-fly)
- $250,614
- Comps found
- 12
Show comp detail 12 sales within ~0.75 mi
| Address | Dist | Beds/Ba | Sqft | Sold | Price | $/sf | Match |
|---|---|---|---|---|---|---|---|
| 167 E Main St | 0.25mi | 5/2.0 (+1) | 2,196 (+2%) | 10mo | $275,000 | $125 | 68 |
| 54 Spring St | 0.12mi | 3/2.0 (-1) | 2,019 (-6%) | 12mo | $175,000 | $87 | 68 |
| 96 W Edgewood Dr | 0.56mi | 4/2.5 | 2,122 (-1%) | 3mo | $306,000 | $144 | 66 |
| 24 Prospect Ave | 0.32mi | 4/2.5 | 2,203 (+3%) | 18mo | $305,000 | $138 | 62 |
| 59 Maple Ave | 0.12mi | 4/2.0 | 2,360 (+10%) | 21mo | $275,000 | $117 | 58 |
| 72 Childs St | 0.44mi | 3/1.0 (-1) | 2,254 (+5%) | 21mo | $70,000 | $31 | 46 |
| 206 Elk St | 0.64mi | 5/2.0 (+1) | 2,272 (+6%) | 11mo | $260,000 | $114 | 44 |
| 72 Ellis Ave | 0.74mi | 4/2.0 | 2,024 (-6%) | 14mo | $289,900 | $143 | 43 |
| 56 Mill St | 0.46mi | 3/2.0 (-1) | 2,320 (+8%) | 19mo | $250,000 | $108 | 42 |
| 17 Chestnut St | 0.67mi | 4/1.0 | 2,403 (+12%) | 18mo | $212,999 | $89 | 32 |
| 155 Woodward Ave | 0.66mi | 3/2.0 (-1) | 1,852 (-14%) | 17mo | $35,000 | $19 | 26 |
| 9 Rauch Dr | 0.75mi | 3/2.5 (-1) | 2,450 (+14%) | 16mo | $530,000 | $216 | 19 |
Match score weights: distance 35% · size 25% · config 20% · recency 20%. Top-matched comps best support the ARV.
Projected returns pro-forma
-3.0% appreciation · 3.0% rent growth · sell at horizon
- IRR
- -16.3%
- Equity multiple
- 0.42×
- Total profit
- $-21,858
- Equity at exit
- $20,114
- IRR
- -8.0%
- Equity multiple
- 0.50×
- Total profit
- $-18,983
- Equity at exit
- $11,664
Cash invested: $37,772 (down + closing). Projections, not guarantees.
Landlord ↔ Tenant lean methodology
- Overall (STATE)
- 15 Strongly Tenant-Friendly
- State New York
- 15 Strongly Tenant-Friendly · D+10
- County
- — inherits STATE
- City
- — inherits STATE
ZIP-level market 14141
- Home prices YoY
- -15.8%
- Active inventory
- 39
- Price-to-rent
- 9.5×
Monthly cashflow live
- Estimated rent
- $1,180 medium interval (Pro) →
- Mortgage (P&I)
- −$707
- Tax est. 1.5%
- −$169 /mo · $2,024/yr
- Insurance
- −$56
- HOA
- −$0
- Vacancy / Maint / Mgmt
- −$248
- Net cashflow
- $-0
Break-even live
UW: 25.0% down · 7.5% · 30yr · 1.5% tax · 5.0% vac · 8.0% maint · 8.0% mgmt
Financing live
Cash to close
- Down payment
- $33,725
- Closing costs
- $4,047
- Reserves months
- —
- Total cash needed
- —
Loan-product check · same deal, 3 products live
Conventional
25% down · 7.5% · 30yr
- Down + closing
- —
- Monthly P&I
- —
- Monthly cashflow
- —
- DSCR
- —
- Eligible?
- —
Personal DTI + credit; lowest rate.
DSCR
20% down · 8.5% · 30yr
- Down + closing
- —
- Monthly P&I
- —
- Monthly cashflow
- —
- DSCR
- —
- Eligible?
- —
No personal income docs; deal must DSCR.
Hard money
10% down · 12.0% · 12mo
- Down + closing
- —
- Monthly P&I
- —
- Monthly cashflow
- —
- DSCR
- —
- Eligible?
- —
Short-term bridge; refi at stabilization.
Listing history 12 events
-
2026-06-13status $134,900 Pending 17 DOM
-
2026-06-10statusdays on market $134,900 Active 17 DOM
-
2026-06-09days on market $134,900 Active Under Contract 16 DOM
-
2026-06-08days on market $134,900 Active Under Contract 15 DOM
-
2026-06-08status $134,900 Active Under Contract 14 DOM
-
2026-06-05status $134,900 Pending 14 DOM
-
2026-06-03days on market $134,900 Active 14 DOM
-
2026-06-02days on market $134,900 Active 13 DOM
-
2026-06-01days on market $134,900 Active 12 DOM
-
2026-05-31days on market $134,900 Active 11 DOM
-
2026-05-20$134,900 Active 795-char remark
Show marketing remark (795 chars)
Currently utilized as a single-family home, this property offers excellent potential to easily convert back to a duplex for added income opportunities. Conveniently located in the Village of Springville, close to Bertrand Chaffee Hospital, downtown shops, restaurants, and everyday conveniences. The home is currently set up as a spacious 4 bedroom, 1.5 bath residence featuring a first-floor laundry area, office space, blacktop driveway, and a good-sized backyard. Updates include a roof completed in 2010 and some vinyl replacement windows installed in 2002. With solid space, flexible possibilities, and plenty of potential, this property is a great opportunity for an owner occupant or investor ready to add their personal touch and build equity! See ML R1683334 for Single Family listing.
-
2026-05-20$134,900 Active
Show marketing remark (795 chars)
Currently utilized as a single-family home, this property offers excellent potential to easily convert back to a duplex for added income opportunities. Conveniently located in the Village of Springville, close to Bertrand Chaffee Hospital, downtown shops, restaurants, and everyday conveniences. The home is currently set up as a spacious 4 bedroom, 1.5 bath residence featuring a first-floor laundry area, office space, blacktop driveway, and a good-sized backyard. Updates include a roof completed in 2010 and some vinyl replacement windows installed in 2002. With solid space, flexible possibilities, and plenty of potential, this property is a great opportunity for an owner occupant or investor ready to add their personal touch and build equity! See ML R1683334 for Single Family listing.
ⓘ Source: listings_history table (triggers on properties + properties_extension) + one-shot
backfill from property_details.listing_events for pre-trigger history.
Climate risk First Street
- Flood 1/10 Low FEMA zone X (unshaded) · 0% chance over 30 yrs
- Wildfire 1/10 Low
- Heat 1/10 Low 7 d/yr ≥91°F today · 16 d/yr by 30 yrs out
- Wind 1/10 Low
- Air quality 2/10 Low 0 unhealthy d/yr today · 1 by 30 yrs out
Nearby sold comps map
Loading sold comps map…
Walkable amenities ~0.75 mi
Loading nearby amenities…
Taxation est. · year 1
- Rental income
- $14,157
- − Mortgage interest
- −$7,556
- − Property taxes
- −$2,024
- − Insurance
- −$674
- − Repairs & maintenance
- −$1,133
- − Management
- −$1,133
- − Depreciation
- −$3,924
- Taxable loss
- −$2,287
- Est. tax savings @ 24.0%
- +$549
- After-tax cash flow
- $546/yr
For passive investors: Depreciation is non-cash, so a rental often shows a tax loss while cash-flowing — sheltering income. Rental losses are passive: they offset passive income freely, and up to $25,000/yr can offset ordinary (W-2) income if you actively participate and your MAGI is under $100k (phasing out to $0 by $150k); unused losses carry forward. On sale, claimed depreciation is recaptured at up to 25%, and gains may owe capital-gains tax (a 1031 exchange can defer both). Figures are a year-1 estimate at your 24.0% rate — not tax advice; consult a CPA.
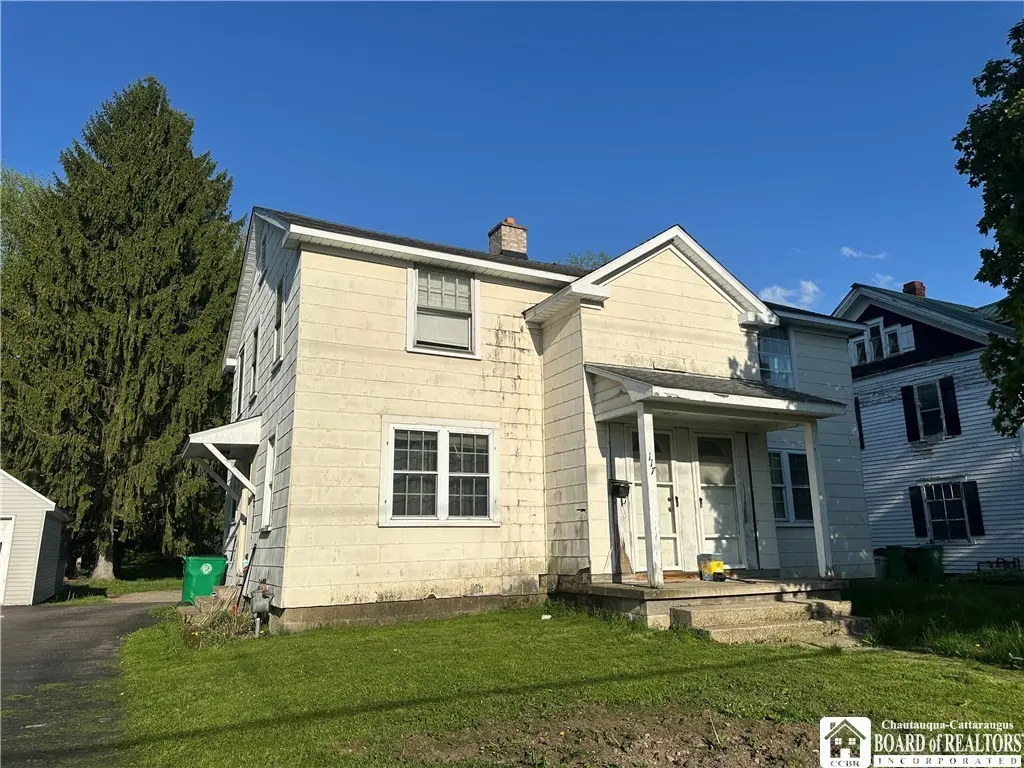
Condition & rehab AI · 1 photo
The home requires significant repairs and maintenance, including a new roof, exterior painting, and landscaping. These improvements will significantly increase its resale and rental value.
Repairs flagged
- Major roof — The roof appears to be in poor condition based on the satellite image.
- Major exterior siding — The exterior siding appears to be in poor condition.
- Major windows — The windows appear to be in poor condition.
- Major landscaping — The landscaping appears to be overgrown and in poor condition.
Value-add opportunities
- Both repair and replace roof — A new roof will improve the home's appearance and increase its value.
- Both repair and paint exterior — A fresh coat of paint will improve the home's curb appeal and increase its value.
- Both replace windows — New windows will improve energy efficiency and increase the home's value.
- Both trim and landscape — A well-maintained yard will improve the home's curb appeal and increase its value.
Renovation cost estimate screening
| Repair item | Severity | Est. cost |
|---|---|---|
| roof · The roof appears to be in poor condition based on the satellite image. | Major | $15,000–50,000 |
| exterior siding · The exterior siding appears to be in poor condition. | Major | $15,000–50,000 |
| windows · The windows appear to be in poor condition. | Major | $15,000–50,000 |
| landscaping · The landscaping appears to be overgrown and in poor condition. | Major | $15,000–50,000 |
| Total estimated repair cost · 4 items | $60,000–200,000 |
Value-add ROI direction
- Both repair and replace roof — A new roof will improve the home's appearance and increase its value. ↑
- Both repair and paint exterior — A fresh coat of paint will improve the home's curb appeal and increase its value. ↑
- Both replace windows — New windows will improve energy efficiency and increase the home's value. ↑
- Both trim and landscape — A well-maintained yard will improve the home's curb appeal and increase its value. ↑
ⓘ Cost ranges are severity-bucket heuristics (US national rule-of-thumb). Get contractor quotes + a written scope before underwriting a rehab budget.
Schools (NCES district)
- District
- Springville-Griffith Institute Central School District
- NCES district ID
- 3612990
- Math proficiency
- 47% ▼ -15.00%
- Reading proficiency
- 52% ▲ 7.00%
- Median HH income
- $53,569
- Composite
- 42.7/100
- National rank
- #3170
- State rank
- #385 of 590 in NY
Livability — Springville
- Score
- 76/100
- State rank
- #213
- US rank
- #3281
Category grades
Schools grade is shown separately in the Schools card above.
Census & demographics
- Census place
- Springville, NY
- Population (ZIP)
- 7,624
Population outlook (Erie County) Hauer SSP2
- Today (2025)
- 933,037 people
- By 2030
- 935,181 · +0.2%
- By 2040
- 928,531 · -0.5%
- By 2050
- 905,725 · -2.9%
- By 2075
- 834,037 · -10.6%
- By 2100
- 708,033 · -24.1%
Race, ethnicity, and origin ACS 2023
- Neighborhood character
- Predominantly White (96%)
- Race & ethnicity
- White 96% Two or more races 2% Hispanic / Latino 1%
- Common ancestry
- Romanian 19% Lithuanian 2% Slovak 2%
- Foreign-born
- 1%
Political lean MEDSL · Erie
- 2024 margin
- Lean D (+9.7) · D 54.8% · R 45.2%
- 2008→2024 swing
- -7.9pp toward R · 2008: 17.5pp · 2024: 9.7pp
- All cycles
- 2024: D+9.7 2020: D+14.7 2016: D+4.8 2012: D+15.6 2008: D+17.5
Not yet ingested
- Civics
- —
Market trends
- HPI YoY
- ▼ -70.52%
- Current HPI
- 374.6726
- Rent YoY
- —
- Metro
- —
- State GDP YoY
- ▲ 2.60%
- F500 in state
- 92
Industry mix (Fortune 500 HQ in NY)
| Industry | F500 HQs | Revenue |
|---|---|---|
| Financial Services | 10 | $950B |
|
||
| Consumer Goods | 9 | $162B |
|
||
| Insurance | 4 | $225B |
|
||
| Telecommunications | 2 | $144B |
|
||
| Pharmaceuticals | 2 | $112B |
|
||
| Media / Entertainment | 2 | $69B |
|
||
Price history
+0.0% since first listed2 events — show timeline
- 2026-05-20 Listed $134,900 UNYREIS
- 2026-05-20 Listed $134,900 UNYREIS
Cash-flow waterfall
monthlySold comps — $/sqft
last 12 mo · ≤1 miLoading sold comps…