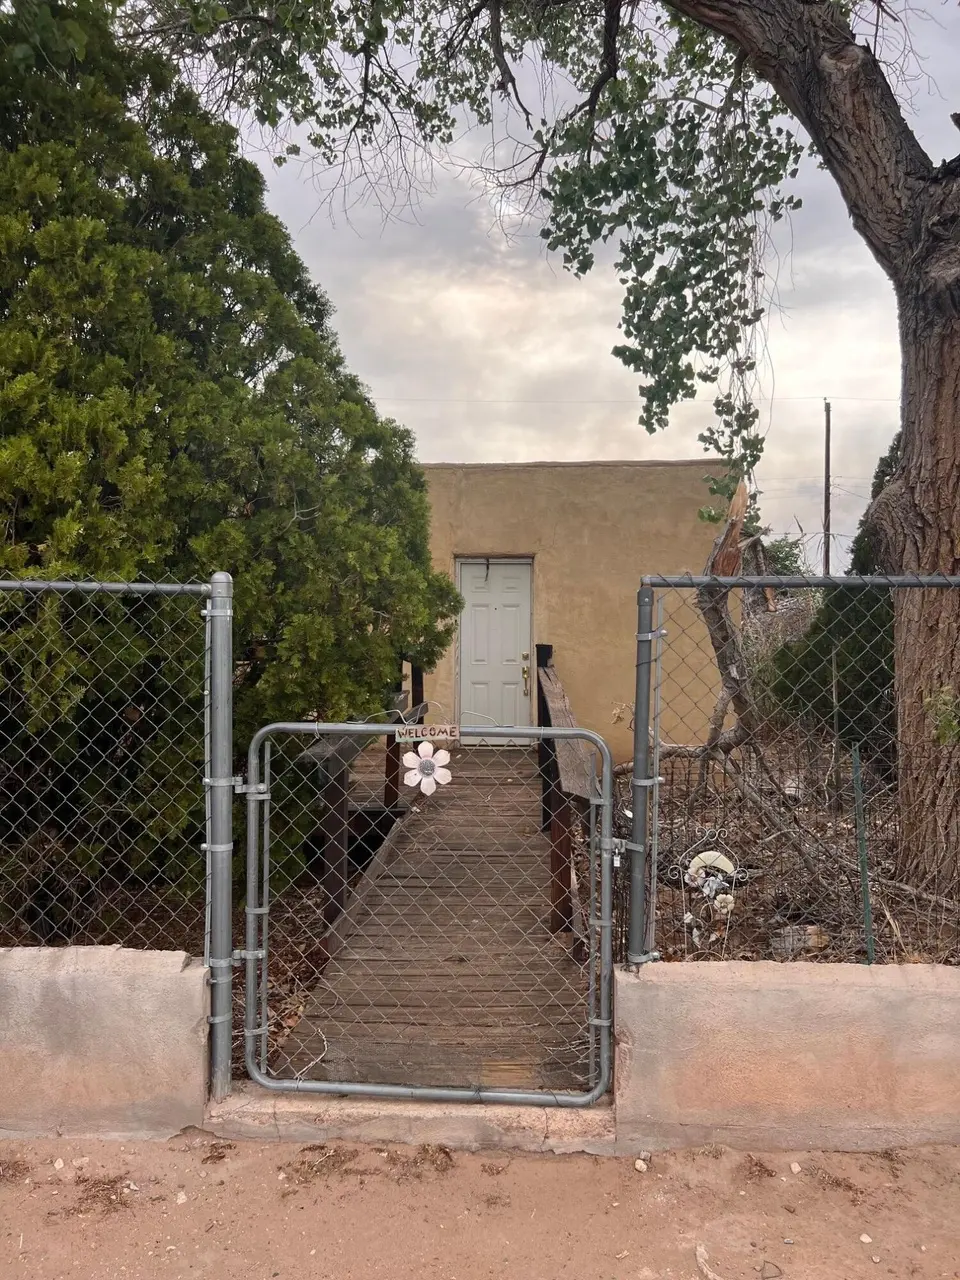
3078 Benny Rd SW · South Valley, NM
Flood risk 1/10 · Minimal
- FEMA flood zone
- X
- Chance of flooding over 30 yrs
- 0.0%
- Est. flood insurance / yr
- $507 – $1,088
Fire risk 1/10 · Minimal
- Est. fire insurance / yr
- $706 – $1,312
Heat risk 5/10 · Moderate
- Hot days now (above 95°F)
- 7 days/yr
- Hot days in 30 yrs
- 18 days/yr
Wind risk 1/10 · Minimal
- Chance of severe wind over 30 yrs
- —
Air-quality risk 2/10 · Minimal
- Unhealthy air days now
- 1 days/yr
- Unhealthy air days in 30 yrs
- 2 days/yr
Risk factors via First Street. Map © Google.
Why this score? — see what drove the C- grade
The composite is a weighted blend of 9 inputs, each scored 0–100. Each bar is that input's sub-score; the figure is the points it added to the 100-point composite (weight × sub-score).
- Cash flow +19.8/30.0
- ARV discount +7.5/15.0
- DSCR +6.3/10.0
- Schools +5.3/10.0
- 1% rule +4.8/10.0
- Livability +3.0/5.0
- Rent growth +2.5/5.0
- Condition / age +2.5/5.0
- Appreciation +0.0/10.0
$140,000
🖨 Deal sheet (PDF) 📄 Offer letter ✓ Due diligence
Listing remarks
Investor Special! Great opportunity to unlock this property's potential. Whether you're looking for your next renovation project, rental, investment, or value-add opportunity, this home offers endless possibilities. This property is sold as is. Bring your ideas and make it shine!
Key facts
- 0.24 acre lot
- Parking
- Built 1948
Property features AI
Exterior
- Parking: Has carport; 1 carport space
- Utilities: Electricity connected; Natural gas connected; Water connected (public); Public sewer
- Home design: Single-story home; Flat roof; Block and stucco construction; Resale property
- Construction: Built (year from public records); Block construction; Stucco exterior; Flat roof
- Exterior features: Private yard; Faces east; City street frontage; Paved road access; R-1 zoning
Interior
- Flooring: Carpet-free flooring
- Bathrooms: 1 full bathroom
- Heating & cooling: Wall furnace heating; Evaporative cooling
- Interior features: Main level primary bedroom; No carpet (carpet-free)
- Laundry & utility: Washer hookup; Electric dryer hookup; Gas dryer hookup
Neighborhood map
What this means for you Summary
Snapshot
- This is a 2-bed/1.0-bath other listed at $140k.
Deal economics
- At list price, monthly cash flow is $166 ($2k/yr) — positive.
- The deal already cash-flows at list — no discount required.
- To meet the 1% rule (rent ≥ 1% of price), the offer needs to be $138k (1.5% below list).
- Recommended offer: $138k (1.5% below list) — sets the bar for 1% rule.
- Cap rate 7.7% vs local median 3.9% in South Valley — top-decile yield for the area; either an underpriced asset or a hidden risk that comps aren't pricing in. Stress-test before assuming the spread holds.
Location & tenants
- Location reads 60/100 on livability (#113 in NM) — a middle-class / working-renter tenant base. Strengths: cost of living A+, housing A; Watch: commute C-, employment D, crime F.
- Albuquerque Public Schools (urban): math 51% / reading 75% proficiency, ranked #3 of 29 in NM (top 10%) — acceptable for families but not a draw, mixed tenant base, ~2y average lease; 60% free/reduced lunch — lower-income household profile, screen leases tightly.
- Zoned schools: Coronado Elementary (308 students, 30% FRL); Ernie Pyle Middle (453 students, 100% FRL); Rio Grande High (math 5% / reading 24%, grade F, #107 of 110 statewide, top 97%, 1,532 students, 100% FRL) — zoned schools average 77% FRL vs 60% district-wide (17 pts higher); higher-poverty schools than district average — tighter screening recommended.
- Zoned-school proficiency averages 15% at this address vs 63% district-wide (-48 pts) — the specific schools serving this property underperform the Albuquerque Public Schools average; the district grade overstates school quality for this exact location.
- Market conditions: 166 active listings in the ZIP; 5 comparable units currently listed for rent nearby; rentals at typical pace (median 23d on market — plan ~3-4 weeks tenant-placement turnaround); 40% of comp listings sitting > 30 days — soft ceiling on asking rent; 1,316 units permitted in Bernalillo County in 2024 (546 in 5+ unit buildings).
Forward outlook
- Local home prices are declining (-3.0%/yr); year-one equity from $968 of loan paydown is wiped out by about $4k of value loss. Plan a longer hold.
Negotiation context
- It's been on market 17 days — a 2% lower offer ($138k) is reasonable based on typical stale-listing flexibility.
Risks & watch-outs
- Watch-outs: built in 1948 — expect roof / HVAC / electrical / plumbing capex.
- Climate carrying-cost: extreme-heat days projected 7→18/yr by 2055 (HVAC capex compounding) — expect insurance premiums to compound above CPI over the hold.
Questions for the listing agent
- Built in 1948 — when were the roof, HVAC, electrical panel, plumbing, and water heater last replaced?
- Is there a deadline driving the sale (1031 exchange, divorce, estate, relocation)? That informs how much negotiation room exists.
- Schools are F-rated, which usually means shorter tenancies and higher turnover. Who's the typical renter profile here, and what's been the actual vacancy rate?
- Crime grade is F in this area — have there been break-ins, vandalism, or insurance claims at this property in the last 3 years? What carrier currently insures it and at what premium?
- What's the average days-on-market for RENTAL listings here right now (not sales)? A rising rental-DOM trend means longer vacancies and softer asking-rent achievability than the comps imply.
- What's the recent tenant-quality profile in this submarket — average credit score on applications, eviction rate, late-payment / NSF rate, and stable-employment percentage? A property-management company in the area should have these aggregated.
- How much new for-sale + rental construction is in the pipeline within 1–3 miles? Heavy new supply typically softens prices + rents 12–24 months out; constrained supply supports both.
Investment metrics
- 1% rule
- 0.98% ✗
- Cap rate
- 7.72%
- Cash-on-cash
- 5.08%
- DSCR
- 1.23
- GRM
- 8.5
CMA / ARV
No comps found within radius.
Projected returns pro-forma
-3.0% appreciation · 3.0% rent growth · sell at horizon
- IRR
- -8.4%
- Equity multiple
- 0.69×
- Total profit
- $-12,119
- Equity at exit
- $20,874
- IRR
- 1.1%
- Equity multiple
- 1.08×
- Total profit
- $3,036
- Equity at exit
- $12,105
Cash invested: $39,200 (down + closing). Projections, not guarantees.
Landlord ↔ Tenant lean methodology
- Overall (STATE)
- 55 Moderately Landlord-Leaning
- State New Mexico
- 55 Moderately Landlord-Leaning · D+3
- County
- — inherits STATE
- City
- — inherits STATE
ZIP-level market 87105
- Active inventory
- 166
- Price-to-rent
- 8.5×
Monthly cashflow live
- Estimated rent
- $1,379 high interval (Pro) →
- Mortgage (P&I)
- −$734
- Tax from tax record
- −$131 /mo · $1,569/yr
- Insurance
- −$58
- HOA
- −$0
- Vacancy / Maint / Mgmt
- −$290
- Net cashflow
- $166
Break-even live
Sensitivity live
| Price | -10% $245 | -5% $206 | +0% $166 | +5% $126 | +10% $87 |
|---|---|---|---|---|---|
| Rent | -10% $57 | -5% $112 | +0% $166 | +5% $220 | +10% $275 |
| Rate | -1.0pp $237 | -0.5pp $202 | base $166 | +0.5pp $130 | +1.0pp $93 |
UW: 25.0% down · 7.5% · 30yr · 1.5% tax · 5.0% vac · 8.0% maint · 8.0% mgmt
Financing live
Cash to close
- Down payment
- $35,000
- Closing costs
- $4,200
- Reserves months
- —
- Total cash needed
- —
Loan-product check · same deal, 3 products live
Conventional
25% down · 7.5% · 30yr
- Down + closing
- —
- Monthly P&I
- —
- Monthly cashflow
- —
- DSCR
- —
- Eligible?
- —
Personal DTI + credit; lowest rate.
DSCR
20% down · 8.5% · 30yr
- Down + closing
- —
- Monthly P&I
- —
- Monthly cashflow
- —
- DSCR
- —
- Eligible?
- —
No personal income docs; deal must DSCR.
Hard money
10% down · 12.0% · 12mo
- Down + closing
- —
- Monthly P&I
- —
- Monthly cashflow
- —
- DSCR
- —
- Eligible?
- —
Short-term bridge; refi at stabilization.
Rent comps 5 comps
| Address | Beds | Baths | Sqft | Rent | $/sqft | DOM | Units | Dist |
|---|---|---|---|---|---|---|---|---|
| 707 Luna Rd SW Unit B Albuquerque, NM | 2.0 | 1.0 | 800 | $1,395 | $1.74 | 16d | 1 | 0.64mi |
| 1226 Goff Blvd SW Unit F Albuquerque, NM | 1.0 | 1.0 | 650 | $975 | $1.50 | 4d | 1 | 1.02mi |
| 1327 Ojo Feliz St SW Albuquerque, NM | 2.0 | 1.0 | 924 | $1,695 | $1.83 | 23d | 1 | 1.04mi |
| 370 Atrisco Dr SW Apt 9 Albuquerque, NM | 2.0 | 1.0 | 800 | $985 | $1.23 | 45d | 1 | 1.34mi |
| 5817 Central Ave NW Apt 13 Albuquerque, NM | 3.0 | 2.0 | 900 | $1,595 | $1.77 | 45d | 1 | 1.43mi |
Listing history 12 events
-
2026-06-22days on market $140,000 Active 17 DOM
-
2026-06-18days on market $140,000 Active 14 DOM
-
2026-06-17days on market $140,000 Active 13 DOM
-
2026-06-16days on market $140,000 Active 12 DOM
-
2026-06-15days on market $140,000 Active 11 DOM
-
2026-06-13days on market $140,000 Active 9 DOM
-
2026-06-10days on market $140,000 Active 6 DOM
-
2026-06-09days on market $140,000 Active 5 DOM
-
2026-06-08days on market $140,000 Active 4 DOM
-
2026-06-07days on market $140,000 Active 3 DOM
-
2026-06-05remarks 280-char remark
-
2026-06-05$140,000 Active 1 DOM
ⓘ Source: listings_history table (triggers on properties + properties_extension) + one-shot
backfill from property_details.listing_events for pre-trigger history.
Tax reassessment forecast NM · Resets to sale price
- Current annual tax
- $1,569 · $131/mo
- Projected year-2 tax
- $1,569 · $131/mo
- Expected delta
- $0/yr ($0/mo · 0.0%)
ⓘ Screening estimate from a state-policy table — verify with the county assessor before closing.
Climate risk First Street
- Flood 1/10 Low FEMA zone X · 0% chance over 30 yrs
- Wildfire 1/10 Low
- Heat 5/10 Major 7 d/yr ≥95°F today · 18 d/yr by 30 yrs out
- Wind 1/10 Low
- Air quality 2/10 Low 1 unhealthy d/yr today · 2 by 30 yrs out
Nearby sold comps map
Loading sold comps map…
Walkable amenities ~0.75 mi
Loading nearby amenities…
Taxation est. · year 1
- Rental income
- $16,546
- − Mortgage interest
- −$7,842
- − Property taxes
- −$1,569
- − Insurance
- −$700
- − Repairs & maintenance
- −$1,324
- − Management
- −$1,324
- − Depreciation
- −$4,073
- Taxable loss
- −$285
- Est. tax savings @ 24.0%
- +$68
- After-tax cash flow
- $2,061/yr
For passive investors: Depreciation is non-cash, so a rental often shows a tax loss while cash-flowing — sheltering income. Rental losses are passive: they offset passive income freely, and up to $25,000/yr can offset ordinary (W-2) income if you actively participate and your MAGI is under $100k (phasing out to $0 by $150k); unused losses carry forward. On sale, claimed depreciation is recaptured at up to 25%, and gains may owe capital-gains tax (a 1031 exchange can defer both). Figures are a year-1 estimate at your 24.0% rate — not tax advice; consult a CPA.
Schools (NCES district)
- District
- Albuquerque Public Schools
- NCES district ID
- 3500060
- Math proficiency
- 51% ▲ 30.00%
- Reading proficiency
- 75% ▲ 45.00%
- Median HH income
- $48,151
- Composite
- 53.29/100
- National rank
- #1487
- State rank
- #3 of 29 in NM
Livability — South Valley
- Score
- 60/100
- State rank
- #113
- US rank
- #19456
Category grades
Schools grade is shown separately in the Schools card above.
Census & demographics
- Census place
- South Valley, NM
- County
- Bernalillo County · 647,165 people
- City population
- 54,215
- Metro
- Albuquerque, NM
- Population (ZIP)
- 54,367
- Household income
- $55,644
- Rent vs Own
- Severe rent burden
- 1175.0
Population outlook (Bernalillo County) Hauer SSP2
- Today (2025)
- 704,528 people
- By 2030
- 711,723 · +1.0%
- By 2040
- 714,522 · +1.4%
- By 2050
- 709,274 · +0.7%
- By 2075
- 680,015 · -3.5%
- By 2100
- 619,879 · -12.0%
Race, ethnicity, and origin ACS 2023
- Neighborhood character
- Predominantly Hispanic (80%)
- Race & ethnicity
- Hispanic / Latino 80% Two or more races 34% White 14% Native American 6%
- Hispanic origin (detail)
- Mexican 55%
- Common ancestry
- Romanian 1% Scotch-Irish 1% Italian 1%
- Foreign-born
- 15% · Canada
- Languages at home
- 52% English-only · Spanish 45%
Political lean MEDSL · Bernalillo
- 2024 margin
- Strong D (+21.0) · D 59.2% · R 38.2% · Other 2.6%
- 2008→2024 swing
- -0.3pp no change · 2008: 21.4pp · 2024: 21.0pp
- All cycles
- 2024: D+21.0 2020: D+24.4 2016: D+17.8 2012: D+16.2 2008: D+21.4
Not yet ingested
- Civics
- —
Market trends
- HPI YoY
- ▼ -223.16%
- Current HPI
- 269.4587
- Rent YoY
- —
- Metro
- Albuquerque, NM
- State GDP YoY
- —
- F500 in state
- 0
Price history
5 events — show timeline
- 2026-05-31 Listed $140,000 Southwest MLS
- 2024-01-18 Sold (Public Records) — Public Records
- 1999-05-28 Sold (Public Records) — Public Records
- 1999-05-28 Sold (Public Records) — Public Records
- 1999-05-28 Sold (Public Records) — Public Records
Property tax history
+6.5%/yrLatest (2025): $1,569 · +44.7% YoY. Source: county tax records.
Cash-flow waterfall
monthlySold comps — $/sqft
last 12 mo · ≤1 miLoading sold comps…