409 N Silver St · Wykoff, MN
Flood risk No data
- FEMA flood zone
- —
- Chance of flooding over 30 yrs
- —
- Est. flood insurance / yr
- —
Fire risk No data
- Est. fire insurance / yr
- —
Heat risk No data
- Hot days now (above threshold)
- —
- Hot days in 30 yrs
- —
Wind risk No data
- Chance of severe wind over 30 yrs
- —
Air-quality risk No data
- Unhealthy air days now
- —
- Unhealthy air days in 30 yrs
- —
Risk factors via First Street. Map © Google.
Why this score? — see what drove the D- grade
The composite is a weighted blend of 9 inputs, each scored 0–100. Each bar is that input's sub-score; the figure is the points it added to the 100-point composite (weight × sub-score).
- Appreciation +7.9/10.0
- ARV discount +7.5/15.0
- Cash flow +7.3/30.0
- Schools +3.9/10.0
- Livability +3.3/5.0
- Rent growth +2.5/5.0
- Condition / age +2.5/5.0
- 1% rule +2.0/10.0
- DSCR +1.4/10.0
$160,000
🖨 Deal sheet 📄 Offer letter ✓ Due diligence
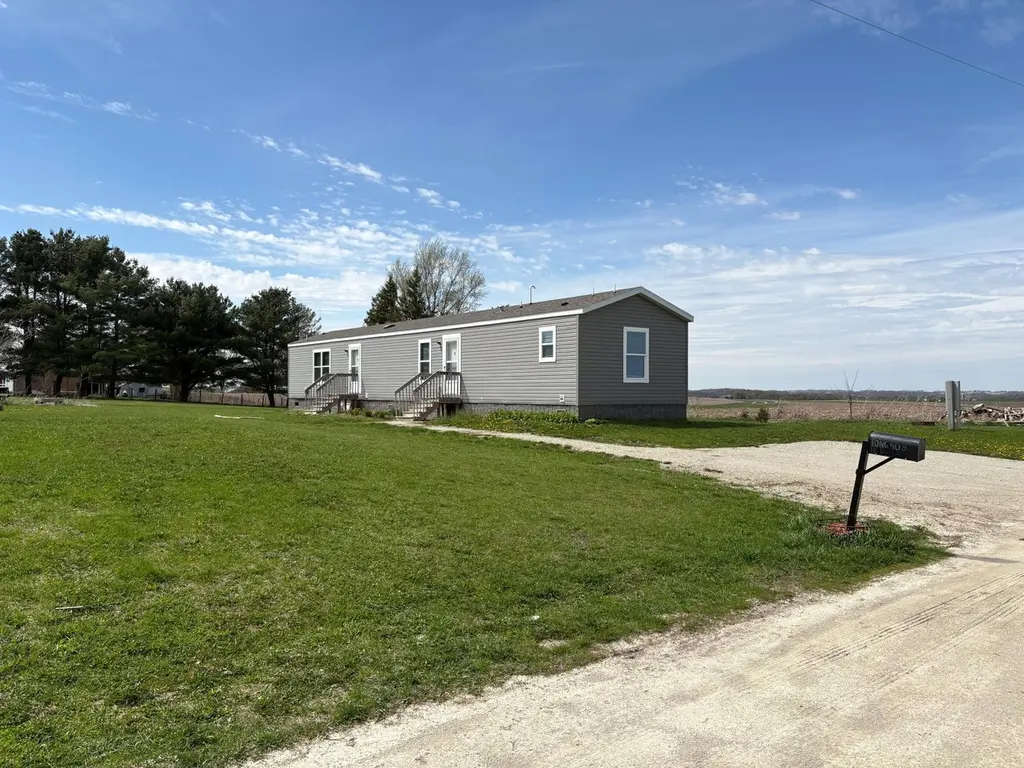
Listing remarks
This is a newer manufactured home built by Schult Homes, sitting on its own large private city lot. The home offers updated finishes, a large primary bedroom with a private primary bath and walk-in closet. The lot borders a farm field with pretty views and has ample green space.
Key facts
- Private city lot
- Ample green space
- Walk-in closet
Tags
Property features AI
Finance
- Other: Lot approximately 0.309 acres (dimensions ~90 x 150)
Exterior
- Parking: Gravel parking
- Utilities: City water (connected); City sewer (connected); Electric and natural gas service
- Home design: Residential manufactured home; One level; Entry level: One; Pillar/post/pier foundation
- Construction: Asphalt roof (age 8 years or less); Built on a 14x80 foundation footprint
- Exterior features: Vinyl exterior; Road frontage on a city street; Publicly maintained road access
Interior
- Kitchen: Dishwasher; Microwave; Range; Refrigerator
- Bedrooms: Three bedrooms (all on one level; primary suite on main floor)
- Bathrooms: Two full bathrooms (including a full main-floor primary bath and a private primary bath)
- Heating & cooling: Forced air heating; Central air conditioning
- Interior features: Dishwasher; Microwave; Range; Refrigerator; All living facilities on one level; Main floor primary bedroom suite; Main floor full bath; Private primary bathroom
- Laundry & utility: Main level laundry room with washer and electric dryer hookups
Neighborhood map
What this means for you Summary
Snapshot
- This is a 3-bed/2.0-bath single-family listed at $160k.
Deal economics
- At list price, monthly cash flow is $-217 ($-3k/yr) — negative.
- To cash-flow at today's rent, offer at most $129k (19.6% below list).
- To meet the 1% rule (rent ≥ 1% of price), the offer needs to be $113k (29.7% below list).
- Recommended offer: $113k (29.7% below list) — sets the bar for 1% rule.
Location & tenants
- Location reads 66/100 on livability (#492 in MN) — a middle-class / working-renter tenant base. Strengths: cost of living A+, housing A+, employment B; Watch: crime D+, amenities F, commute F.
- Kingsland Public School District (rural): math 34% / reading 56% proficiency, ranked #178 of 301 in MN (top 59%) — families likely to look elsewhere, expect single-tenant / working-renter base with shorter leases.
- Market conditions: 8 active listings in the ZIP; 65 units permitted in Fillmore County in 2024 (0 in 5+ unit buildings).
Forward outlook
- In year one you build about $11k of equity ($1k loan paydown + $9k appreciation (5.9% local appreciation)).
- Fillmore County population projected at -15% by 2050 — secular population decline; favor cash flow + early exit over multi-decade hold.
- By year 4, paydown + projected appreciation supports a ~$36k cash-out refi (75% LTV) — recoverable capital for the next deal without selling this one.
Negotiation context
- It's been on market 36 days — a 3% lower offer ($155k) is reasonable based on typical stale-listing flexibility.
Questions for the listing agent
- What do current leases actually rent for vs. the listed asking? Can we see a recent rent roll and the last 12 months of T-12 income?
- It's been on market 36 days. Have you received any prior offers? Is the seller open to a 30% concession, seller financing, or rate buy-down credit?
- Is there a deadline driving the sale (1031 exchange, divorce, estate, relocation)? That informs how much negotiation room exists.
- Crime grade is D in this area — have there been break-ins, vandalism, or insurance claims at this property in the last 3 years? What carrier currently insures it and at what premium?
- The area grade is low — what's the realistic commute time and amenity access for the typical tenant pool here? Any planned neighborhood developments (good or bad) we should know about?
- What's the average days-on-market for RENTAL listings here right now (not sales)? A rising rental-DOM trend means longer vacancies and softer asking-rent achievability than the comps imply.
- What's the recent tenant-quality profile in this submarket — average credit score on applications, eviction rate, late-payment / NSF rate, and stable-employment percentage? A property-management company in the area should have these aggregated.
- How much new for-sale + rental construction is in the pipeline within 1–3 miles? Heavy new supply typically softens prices + rents 12–24 months out; constrained supply supports both.
Investment metrics
- 1% rule
- 0.70% ✗
- Cap rate
- 4.67%
- Cash-on-cash
- -5.80%
- DSCR
- 0.74
- GRM
- 11.8
CMA / ARV
No comps found within radius.
Projected returns pro-forma
5.87% appreciation · 3.0% rent growth · sell at horizon
- IRR
- 10.3%
- Equity multiple
- 1.70×
- Total profit
- $31,203
- Equity at exit
- $99,293
- IRR
- 11.5%
- Equity multiple
- 3.30×
- Total profit
- $102,946
- Equity at exit
- $178,959
Cash invested: $44,800 (down + closing). Projections, not guarantees.
Landlord ↔ Tenant lean methodology
- Overall (STATE)
- 46 Balanced
- State Minnesota
- 46 Balanced · D+2
- County
- — inherits STATE
- City
- — inherits STATE
ZIP-level market 55990
- Home prices YoY
- 2.5%
- Active inventory
- 8
- Price-to-rent
- 11.8×
Monthly cashflow live
- Estimated rent
- $1,125 medium interval (Pro) →
- Mortgage (P&I)
- −$839
- Tax est. 1.5%
- −$200 /mo · $2,400/yr
- Insurance
- −$67
- HOA
- −$0
- Vacancy / Maint / Mgmt
- −$236
- Net cashflow
- $-217
Break-even live
UW: 25.0% down · 7.5% · 30yr · 1.5% tax · 5.0% vac · 8.0% maint · 8.0% mgmt
Financing live
Cash to close
- Down payment
- $40,000
- Closing costs
- $4,800
- Reserves months
- —
- Total cash needed
- —
Loan-product check · same deal, 3 products live
Conventional
25% down · 7.5% · 30yr
- Down + closing
- —
- Monthly P&I
- —
- Monthly cashflow
- —
- DSCR
- —
- Eligible?
- —
Personal DTI + credit; lowest rate.
DSCR
20% down · 8.5% · 30yr
- Down + closing
- —
- Monthly P&I
- —
- Monthly cashflow
- —
- DSCR
- —
- Eligible?
- —
No personal income docs; deal must DSCR.
Hard money
10% down · 12.0% · 12mo
- Down + closing
- —
- Monthly P&I
- —
- Monthly cashflow
- —
- DSCR
- —
- Eligible?
- —
Short-term bridge; refi at stabilization.
Listing history 11 events
-
2026-06-09statusdays on market $160,000 Pending 36 DOM
-
2026-06-08days on market $160,000 Contingent - Inspection 35 DOM
-
2026-06-07days on market $160,000 Contingent - Inspection 34 DOM
-
2026-06-07days on market $160,000 Contingent - Inspection 33 DOM
-
2026-06-04days on market $160,000 Contingent - Inspection 30 DOM
-
2026-06-02days on market $160,000 Contingent - Inspection 29 DOM
-
2026-06-01status $160,000 Contingent - Inspection 28 DOM
-
2026-06-01days on market $160,000 Active 28 DOM
-
2026-05-31days on market $160,000 Active 27 DOM
-
2026-05-31days on market $160,000 Active 26 DOM
-
2026-05-04$160,000 Active 281-char remark
ⓘ Source: listings_history table (triggers on properties + properties_extension) + one-shot
backfill from property_details.listing_events for pre-trigger history.
Nearby sold comps map
Loading sold comps map…
Walkable amenities ~0.75 mi
Loading nearby amenities…
Taxation est. · year 1
- Rental income
- $13,505
- − Mortgage interest
- −$8,962
- − Property taxes
- −$2,400
- − Insurance
- −$800
- − Repairs & maintenance
- −$1,080
- − Management
- −$1,080
- − Depreciation
- −$4,655
- Taxable loss
- −$5,472
- Est. tax savings @ 24.0%
- +$1,313
- After-tax cash flow
- $-1,286/yr
For passive investors: Depreciation is non-cash, so a rental often shows a tax loss while cash-flowing — sheltering income. Rental losses are passive: they offset passive income freely, and up to $25,000/yr can offset ordinary (W-2) income if you actively participate and your MAGI is under $100k (phasing out to $0 by $150k); unused losses carry forward. On sale, claimed depreciation is recaptured at up to 25%, and gains may owe capital-gains tax (a 1031 exchange can defer both). Figures are a year-1 estimate at your 24.0% rate — not tax advice; consult a CPA.
Schools (NCES district)
- District
- Kingsland Public School District
- NCES district ID
- 2700007
- Math proficiency
- 34% ▼ -14.00%
- Reading proficiency
- 56% ▼ -6.00%
- Median HH income
- $51,955
- Composite
- 38.74/100
- National rank
- #4126
- State rank
- #178 of 301 in MN
Livability — Wykoff
- Score
- 66/100
- State rank
- #492
- US rank
- #11898
Category grades
Schools grade is shown separately in the Schools card above.
Census & demographics
- Census place
- Wykoff, MN
- Population (ZIP)
- 895
Population outlook (Fillmore County) Hauer SSP2
- Today (2025)
- 20,318 people
- By 2030
- 19,765 · -2.7%
- By 2040
- 18,559 · -8.7%
- By 2050
- 17,194 · -15.4%
- By 2075
- 14,253 · -29.9%
- By 2100
- 10,645 · -47.6%
Race, ethnicity, and origin ACS 2023
- Neighborhood character
- Predominantly White (94%)
- Race & ethnicity
- White 94% Two or more races 5%
- Common ancestry
- Portuguese 24% Iranian 6% Slovak 2%
- Foreign-born
- 0%
- Languages at home
- 99% English-only · Spanish 1%
Political lean MEDSL · Fillmore
- 2024 margin
- Strong R (+25.5) · D 36.4% · R 61.9% · Other 1.7%
- 2008→2024 swing
- -33.8pp toward R · 2008: 8.3pp · 2024: -25.5pp
- All cycles
- 2024: R+25.5 2020: R+22.7 2016: R+21.9 2012: D+7.4 2008: D+8.3
Not yet ingested
- Civics
- —
Market trends
- HPI YoY
- ▲ 5.87%
- Current HPI
- 244.4669
- Rent YoY
- —
- Metro
- —
- State GDP YoY
- ▲ 2.41%
- F500 in state
- 34
Industry mix (Fortune 500 HQ in MN)
| Industry | F500 HQs | Revenue |
|---|---|---|
| Healthcare | 2 | $407B |
|
||
| Retail | 2 | $150B |
|
||
| Consumer Goods | 2 | $32B |
|
||
| Industrial Machinery | 2 | $6B |
|
||
| Agriculture | 1 | $40B |
|
||
| Healthcare / Medical Devices | 1 | $32B |
|
||
Price history
3 events — show timeline
- 2026-06-09 Pending — NORTHSTARMLS as Distributed by MLS Grid
- 2026-06-01 Contingent — NORTHSTARMLS as Distributed by MLS Grid
- 2026-05-04 Listed $160,000 NORTHSTARMLS as Distributed by MLS Grid
Cash-flow waterfall
monthlySold comps — $/sqft
last 12 mo · ≤1 miLoading sold comps…